
Data Center High-Voltage Direct Current (HVDC) Market Size, Share & Forecast to 2035
Market at a glance
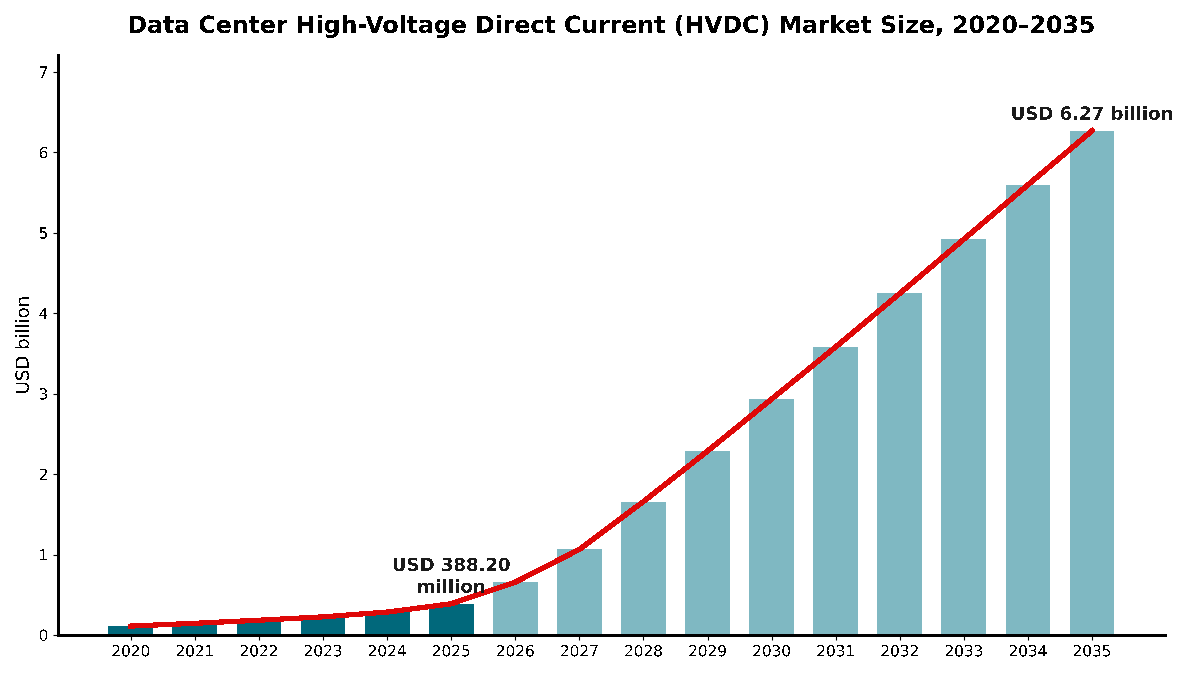
The Data Center High-Voltage Direct Current (HVDC) market was worth USD 388.2 million in 2025 and is forecast to reach USD 6,270.0 million by 2035, growing at a 32.07% CAGR. Asia Pacific accounts for 73.5% of the market.
 By Satyabrat Rajawat, Senior Research Analyst, Strategic Advisory
 Reviewed by Deepti Agrawal
Last updated 7 Oct 2026
Base year 2025 PDF + Excel
Source: DC Market Insights analysis
Key findings
AI Racks Above 200 kW Break the 54 V Model and Lift 800 VDC to USD 3.74 Billion by 2035
Solid-State Transformers Grow to USD 660.93 Million by 2035
HVDC Systems Cost About USD 560 per kW Against USD 120 for a UPS
GPU and Neocloud Operators Reach USD 1.09 Billion by 2035
What is inside the report
- 01Introduction
- 02Research Methodology
- 03Executive Summary
- 04Market Dynamics
- 05Pricing Analysis
- 06Standards and Regulation
- 07Supply Chain and Technology
- 08Market Size and Forecast
- 09Market by Voltage Architecture
- 10Market by Component
- 21chapters
- 2020-2024Historical period
- 2026-2035Forecast period
- 16Companies profiled
Regional insights
- Asia Pacific73.5%
- North America23.4%
- Europe1.9%
- Middle East and Africa0.8%
- Latin America0.3%
Segmentation
Companies profiled
- Delta Electronics
- Zhongheng Electric
- Vertiv
- Eaton
- Schneider Electric
- ABB
- Siemens
- Hitachi Energy
- GE Vernova
- Mitsubishi Electric
- LITEON
- Flex
- Infineon
- Texas Instruments
- Navitas
- onsemi
Recent developments
Microsoft described Mt Diablo, a disaggregated 400 VDC power unit developed with Meta that scales from hundreds of kW up to 1 MW (Source: Microsoft Azure blog).
NVIDIA announced its 800 VDC architecture for 1 MW IT racks, with full-scale production planned alongside Kyber rack-scale systems in 2027 (Source: NVIDIA technical blog).
Eaton acquired Resilient Power Systems, a developer of solid-state transformer technology, for USD 86 million (Source: Eaton Form 10-Q filing).
Vertiv said its 800 VDC portfolio of centralized rectifiers, DC busways and rack-level DC-DC converters is planned for release in the second half of 2026 (Source: Vertiv press release).
ST Telemedia Global Data Centres launched FutureGrid Accelerator, an HVDC-powered AI infrastructure testbed in Singapore, with LITEON, ERI@N and Amperesand (Source: JTC industry news).
Flex agreed to acquire EPC Power, which has an 800 VDC-ready platform for data centers, for a purchase price of USD 4.40 billion (Source: Flex Form 8-K exhibit).
Full analysis
The Data Center High-Voltage Direct Current (HVDC) Market covers the power systems that carry direct current (DC) at 240 volts or more from the facility to the IT rack, from rectifiers and solid-state transformers to DC busways, rack-level converters and services. DC Market Insights values the global Data Center High-Voltage Direct Current (HVDC) Market at USD 388.20 million in 2025 and forecasts USD 6.27 billion by 2035, a CAGR of 32.07%. The 2025 value is built from installed megawatts (MW) times spend per MW: 612.7 MW of new 240 volts direct current (VDC) and 336 VDC capacity at USD 0.31 million per MW, 174.0 MW of 380 VDC and ±400 VDC capacity at USD 0.56 million per MW and 24.4 MW of 800 VDC pilot capacity at USD 0.72 million per MW give USD 304.92 million of new-build spend, and service and replacement on an installed HVDC base of 3.47 GW adds USD 83.28 million. 800 VDC systems are the fastest-growing segment at 70.42% a year because AI racks heading toward 1 MW cannot be fed at 54 V, and Latin America is the fastest-growing region at 56.65% a year because it starts almost from zero.
Executive Summary
The Global Data Center High-Voltage Direct Current (HVDC) Market size was valued at USD 110.82 million in 2020, reached USD 388.20 million in 2025, and is anticipated to reach USD 6.27 billion by 2035, at a CAGR of 32.07% during the forecast period.
| Report attribute | Details |
|---|---|
| Historical Period | 2020-2024 |
| Base Year | 2025 |
| Forecast Period | 2026-2035 |
| Data Center High-Voltage Direct Current (HVDC) Market Size 2025 | USD 388.20 Million |
| Data Center High-Voltage Direct Current (HVDC) Market, CAGR | 32.07% |
| Data Center High-Voltage Direct Current (HVDC) Market Size 2035 | USD 6.27 Billion |
The market grew at 28.50% a year between 2020 and 2025, almost entirely on the back of 240 VDC systems in Chinese hyperscale data centers, and 2025 alone added 36.2% over 2024 as the first ±400 VDC halls and 800 VDC pilots arrived. HVDC-powered halls made up 2.99% of the roughly 116 GW of installed capacity at the end of 2025, a DC Market Insights estimate consistent with published penetration below 3%.
DC Market Insights forecasts the market to pass USD 1.06 billion in 2027, the year NVIDIA ties to full-scale 800 VDC production, and to reach USD 2.93 billion in 2030. By 2035, about 11.8 GW of new capacity a year is built on high-voltage DC, against 811 MW in 2025.
Market Scope: What Is HVDC Power Infrastructure for Data Centers?
HVDC power infrastructure for data centers was a USD 388.20 million market in 2025. HVDC power infrastructure for data centers is the equipment that converts grid alternating current (AC) to DC once, near the facility entrance or in a row-level sidecar, and then distributes DC at 240 V or higher to the IT racks instead of distributing AC and converting it inside every server. The Data Center High-Voltage Direct Current (HVDC) Market covers that equipment worldwide, valued at first sale in current US dollars, with 2025 as the base year and forecasts to 2035. DC Market Insights sizes it at USD 388.20 million in 2025.
Included. 240 VDC and 336 VDC rectifier systems of the type used in Chinese hyperscale data centers; 380 VDC and ±400 VDC systems, including the Mt Diablo style power racks that sit beside the IT rack; 800 VDC centralized rectifiers and sidecars; solid-state transformers that convert medium-voltage AC straight to DC; DC busways, DC switchgear, circuit breakers and power distribution units (PDUs); rack-level DC-DC converters and HVDC power shelves; battery and energy storage interfaces on the DC bus and related services.
Excluded. Utility and long-distance HVDC transmission links, -48 V telecom DC plants, 54 V and 48 V in-rack busbars fed from AC power shelves, uninterruptible power supply (UPS) systems on AC distribution, generators, medium-voltage AC switchgear and chip-level voltage regulators.
How the segments fit together. The voltage-architecture split divides the full USD 388.20 million by the DC bus voltage.
Market Drivers: Why Is High Voltage Data Center Power Moving to DC?
High voltage data center power is moving to DC because AI racks are heading toward 1 MW. AI rack power is rising from under 20 kW, and DC Market Insights estimates that this shift lifts annual HVDC installations from 811 MW in 2025 to 11.8 GW in 2035. Three drivers explain most of the growth.
AI Racks Above 200 kW Break the 54 V Model and Lift 800 VDC to USD 3.74 Billion by 2035
NVIDIA says today’s 54 V in-rack distribution begins to hit physical limits as racks exceed 200 kW, and it is leading a transition to 800 VDC data center power to support 1 MW IT racks and beyond, starting in 2027 (Source: NVIDIA technical blog). NVIDIA claims the change improves end-to-end efficiency by up to 5% compared with 54 V systems and cuts copper requirements by 45%, and that switching distribution from 415 VAC to 800 VDC moves 85% more power through the same conductor size (vendor claims). 800 VDC systems grow from USD 18.12 million in 2025 to USD 3.74 billion in 2035 on DC Market Insights estimates.
Hyperscalers Standardize ±400 VDC Power Racks Through the Open Compute Project
Google, Meta and Microsoft are standardizing a separate DC power rack through the Open Compute Project (OCP). Microsoft described the Mt Diablo design in October 2024 as a disaggregated 400 VDC unit that scales from hundreds of kW up to 1 MW and fits 15% to 35% more AI accelerators in each server rack. Google introduced ±400 VDC power delivery that can support up to 1 MW per rack, chose 400 VDC so it can use the supply chain built for electric vehicles (EVs), and expects machine learning to need more than 500 kW per IT rack before 2030. 380 VDC and ±400 VDC systems grow from USD 109.76 million in 2025 to USD 1.88 billion by 2035, a CAGR of 32.87% on DC Market Insights estimates.
Capacity Additions Rise from 12.0 GW to 27.0 GW a Year
The data center HVDC market is a new-build market first: 78.5% of 2025 spending went into new halls. BloombergNEF counted more than 23 GW of data center capacity under construction worldwide at the end of September 2025, with 15.9 GW of it in the United States. DC Market Insights models annual completions rising from 12.0 GW in 2025 to 22.0 GW in 2030 and 27.0 GW in 2035, and the HVDC share of new capacity rising from 6.8% to 43.7% over the same period.
Market Trends: How Is the HVDC Data Center Architecture Changing?
800 VDC rises from 4.7% of market value in 2025 to 59.7% by 2035, a DC Market Insights estimate. The HVDC data center architecture is moving in three directions: higher bus voltage, conversion moved out of the IT rack into sidecars and solid-state transformers, and a new semiconductor supply chain built around 800 VDC.
Solid-State Transformers Grow to USD 660.93 Million by 2035
A solid-state transformer replaces the low-frequency transformer, switchgear and rectifier chain with power electronics that turn medium-voltage AC straight into DC. Delta showed a solid-state transformer that converts medium-voltage AC directly to 800 VDC at the 2025 OCP Global Summit, and Siemens and Reinhausen are developing one for direct grid-to-rack DC conversion. Eaton bought Resilient Power Systems, a developer of solid-state transformer technology, in August 2025, and says in its 2025 annual report that the deal accelerates commercialization for data centers and energy storage. Solid-state transformers grow from USD 3.98 million in 2025 to USD 660.93 million by 2035 on DC Market Insights estimates, a CAGR of 66.74% and the fastest of any component.
Power Conversion Moves into Sidecars Beside the Rack
Power sidecars free the IT rack for compute. Schneider Electric is developing an 800 VDC sidecar capable of powering racks up to 1.2 MW, Delta showed a 1 MW-scale in-row power system built from 106 kW HVDC power shelves, and Vertiv’s 800 VDC portfolio combines centralized rectifiers, DC busways and rack-level DC-DC converters. Rack-level DC-DC converters and power shelves are worth USD 19.45 million in 2025 and USD 908.18 million by 2035 in the DC Market Insights model.
Chipmakers Build an 800 VDC Conversion Chain
Semiconductor suppliers are designing the converters that step 800 VDC down to the graphics processing unit (GPU): Texas Instruments unveiled an 800 VDC reference architecture with an 800 V-to-6 V isolated bus converter in March 2026, Infineon targets up to 98% efficiency per conversion stage, onsemi bought Aura Semiconductor’s Vcore power technology in 2025, and Navitas closed its acquisition of Claros in October 2026.
Market Challenges: What Holds the Data Center HVDC Market Back?
A ±400 VDC system costs about 4.7 times a UPS of the same rating on one published quote. Up-front cost, immature safety practice and a thin installed base hold the data center HVDC market back.
HVDC Systems Cost About USD 560 per kW Against USD 120 for a UPS
A quote reported in October 2025 put a ±400 V HVDC product for an 800 kW system at about USD 450,000 including installation and a one-year warranty, while a UPS of the same capacity costs about USD 120 per kW, or about USD 100,000. DC Market Insights calculates the HVDC quote at about USD 560 per kW. Operators that buy on first cost keep choosing AC, which is why the model keeps 240 VDC adoption outside China at or below 3% of new capacity.
DC Arc Protection, Skills and Codes Lag AC Practice
Direct current has no natural zero crossing, so breakers, connectors and arc-flash procedures must be rated for it. In the DC Market Insights view, the pool of electricians trained for 800 V DC work in a white space is still small, and site safety rules for DC busways are still being written. DC Market Insights assumes these gaps hold Europe’s ±400 VDC adoption to 0.8% of new capacity in 2025 and 5% in 2030 in the base case.
Copper at Record Prices Raises Busway Costs
London Metal Exchange (LME) cash copper set an all-time high of USD 14,850 per tonne on 17 August 2026. Copper prices lift DC busway costs in the short term, even though higher voltage cuts the copper needed per MW.
Market Opportunities: Where Are the New Revenue Pools in High Voltage DC Data Center Power?
GPU and neocloud operators, growing 45.82% a year, are the fastest-growing new revenue pool. Services are the second pool, on an installed HVDC base that grows from 3.47 GW to more than 60 GW by 2035.
GPU and Neocloud Operators Reach USD 1.09 Billion by 2035
GPU and neocloud providers spent USD 25.17 million on HVDC systems in 2025 and reach USD 1.09 billion by 2035 on DC Market Insights estimates. Rack design matters here too: the OCP Rack Market report shows how open rack standards move power conversion out of the IT rack.
Services Grow to USD 1.57 Billion as the Installed Base Expands
Service and replacement spending is modeled at USD 0.024 million per installed HVDC MW per year, which gives services USD 83.28 million in 2025 and USD 1.57 billion in 2035, or 25.0% of the market, on DC Market Insights estimates. Operators replacing AC power chains can compare costs in our Data Center UPS Market report.
Pricing: How Much Does a Direct Current Data Center Power System Cost per MW?
A direct current data center power system costs USD 0.31 million to USD 0.72 million per MW in 2025. The range runs from about USD 0.31 million per MW at 240 VDC, USD 0.56 million per MW at ±400 VDC and USD 0.72 million per MW for 800 VDC pilot systems in 2025. These are DC Market Insights estimates covering rectification, distribution, rack-level conversion and the energy storage interface, including installation where it is sold with the system; the ±400 VDC figure matches the USD 560 per kW implied by the published 800 kW quote.
| HVDC system spend per MW (USD million) | 2020 | 2025 | 2030 | 2035 |
|---|---|---|---|---|
| 240 VDC and 336 VDC | 0.34 | 0.31 | 0.29 | 0.27 |
| 380 VDC and ±400 VDC | 0.66 | 0.56 | 0.49 | 0.44 |
| 800 VDC | n/a | 0.72 | 0.50 | 0.40 |
The 240 VDC price is the lowest because these systems were already produced in volume before 2020: Delta reported in early 2020 that more than 50 MW of its Panama system, which converts 10 kV AC directly to 240 V DC at 98.5% module efficiency, had been produced and shipped, with deployments in Alibaba data centers. 800 VDC prices fall fastest, by about 6% a year to 2035, as 800 VDC products are released from the second half of 2026 and reach full-scale production in 2027, and solid-state transformers replace conventional transformer and rectifier chains.
Standards and Regulation: Which Rules Govern High Voltage DC in the Data Center?
Five rule sets govern high voltage DC up to 400 V and beyond in the data center: a European interface standard up to 400 V DC, a Chinese 240 V DC standard, a 380 VDC industry standard, the US electrical code and the Open Compute Project specifications for ±400 VDC racks.
ETSI EN 300 132-3. The European Telecommunications Standards Institute (ETSI) EN 300 132-3 defines the power supply interface at the input of information and communication technology equipment for up to 400 V DC, and its scope includes datacentres.
YD/T 2378. China’s telecom industry standard YD/T 2378-2011 covers 240 V DC power supply systems for telecommunications; 240 VDC is also the architecture of Tencent’s third-generation data center power design.
EMerge Alliance 380 VDC. The EMerge Alliance Data/Telecom Center Standard describes a 380 VDC platform that supports hybrid use of AC and DC power.
National Electrical Code (NFPA 70). Article 712 of the National Electrical Code (NEC) sets requirements for DC microgrids with more than one interconnected DC power source, which applies when batteries or on-site generation feed a data center DC bus.
Open Compute Project and EU reporting. The Mt Diablo work at OCP standardizes the electrical and mechanical interfaces of ±400 VDC power racks. In the European Union, Delegated Regulation 2024/1364 requires energy and sustainability reporting from data centers with an installed IT power demand of at least 500 kW.
Market Segmentation: Which Segment Leads the Data Center HVDC Market?
240 VDC and 336 VDC systems lead with 67.1% of 2025 value. In the data center HVDC market, rectifiers and power systems lead components with 41.0%, and hyperscale data centers lead buyers with 62.0%. 800 VDC is the fastest-growing segment at 70.42% a year, against 32.87% for ±400 VDC and 9.43% for 240 VDC, because NVIDIA’s Kyber racks and the power systems built for them reach volume production from 2027.
By Voltage Architecture: 240 VDC and 336 VDC Systems Lead with 67.1%
| Voltage architecture | 2025 (USD million) | Share 2025 | 2035 (USD billion) | CAGR 2025-2035 |
|---|---|---|---|---|
| 240 VDC and 336 VDC | 260.32 | 67.1% | 0.64 | 9.43% |
| 380 VDC and ±400 VDC | 109.76 | 28.3% | 1.88 | 32.87% |
| 800 VDC | 18.12 | 4.7% | 3.74 | 70.42% |
240 VDC keeps growing in China, where Tencent’s third-generation data center power uses a 240 V HVDC and direct mains architecture, but its share falls to 10.2% by 2035 as AI halls move to higher bus voltage. 800 VDC overtakes ±400 VDC in 2028 in the DC Market Insights model.
By Component: Rectifiers and Power Systems Lead with 41.0%
| Component | 2025 (USD million) | Share 2025 | 2035 (USD billion) | CAGR 2025-2035 |
|---|---|---|---|---|
| Rectifiers and Power Systems | 159.18 | 41.0% | 1.63 | 26.22% |
| Solid-State Transformers | 3.98 | 1.0% | 0.66 | 66.74% |
| DC Distribution (Busway, Switchgear and PDUs) | 77.55 | 20.0% | 1.02 | 29.39% |
| Rack-Level DC-DC Converters and Power Shelves | 19.45 | 5.0% | 0.91 | 46.87% |
| Energy Storage Interface | 44.76 | 11.5% | 0.48 | 26.68% |
| Services | 83.28 | 21.5% | 1.57 | 34.12% |
Rectifiers lose 14.9 points of share by 2035 as solid-state transformers take over part of the conversion job, and services gain 3.6 points as the installed base grows.
By Application: AI Training and Inference Grows Fastest at 45.06%
Cloud and general-purpose compute is the largest application in 2025 at USD 228.32 million (58.8%). AI training and inference follows at USD 135.76 million (35.0%) and grows at 45.06% a year to USD 5.60 billion, or 89.4% of the market, by 2035. Telecom and edge data centers are worth USD 24.12 million (6.2%) and grow 14.68% a year.
By End-user: Hyperscale Data Centers Lead with 62.0%
| End-user | 2025 (USD million) | Share 2025 | 2035 (USD billion) | CAGR 2025-2035 |
|---|---|---|---|---|
| Hyperscale Data Centers | 240.80 | 62.0% | 3.69 | 31.39% |
| Colocation Data Centers | 76.64 | 19.7% | 1.18 | 31.44% |
| GPU and Neocloud Providers | 25.17 | 6.5% | 1.09 | 45.82% |
| Enterprise and Telecom Data Centers | 45.59 | 11.7% | 0.30 | 20.82% |
DC Exclusive: The HVDC Voltage Transition Matrix
At USD 805.83 million in 2030, 800 VDC in hyperscale data centers is the single largest cell of the matrix and 27.5% of the whole Data Center High-Voltage Direct Current (HVDC) Market that year. The matrix below cross-tabulates bus voltage against buyer in 2030.
| 2030, USD billion | 240 VDC and 336 VDC | 380 VDC and ±400 VDC | 800 VDC | Total |
|---|---|---|---|---|
| Hyperscale Data Centers | 0.31 | 0.63 | 0.81 | 1.74 |
| Colocation Data Centers | 0.13 | 0.17 | 0.19 | 0.50 |
| GPU and Neocloud Providers | 0.03 | 0.10 | 0.39 | 0.52 |
| Enterprise and Telecom Data Centers | 0.07 | 0.07 | 0.04 | 0.17 |
| Total | 0.54 | 0.97 | 1.43 | 2.93 |
GPU and neocloud providers spend 75.6% of their 2030 HVDC budget on 800 VDC, the highest share of any buyer, because they install whatever the newest accelerator rack demands. In the DC Market Insights model, hyperscalers split their spending across all three voltages: 240 VDC in Chinese halls, ±400 VDC in Mt Diablo style halls and 800 VDC in the newest AI capacity.
The matrix is a DC Market Insights model, not a shipment count. It is built from 54 inputs: 16 annual capacity cohorts (2020 to 2035), 18 adoption curves (6 sub-regions × 3 voltage architectures), 6 regional capacity-share curves, 3 spend-per-MW curves, 1 aftermarket rate, 6 starting installed bases, 3 end-user split tables and 1 supplier revenue check. The model and its assumptions are explained on our research methodology page.
Regional Insights: Which Region Leads the Data Center HVDC Market?
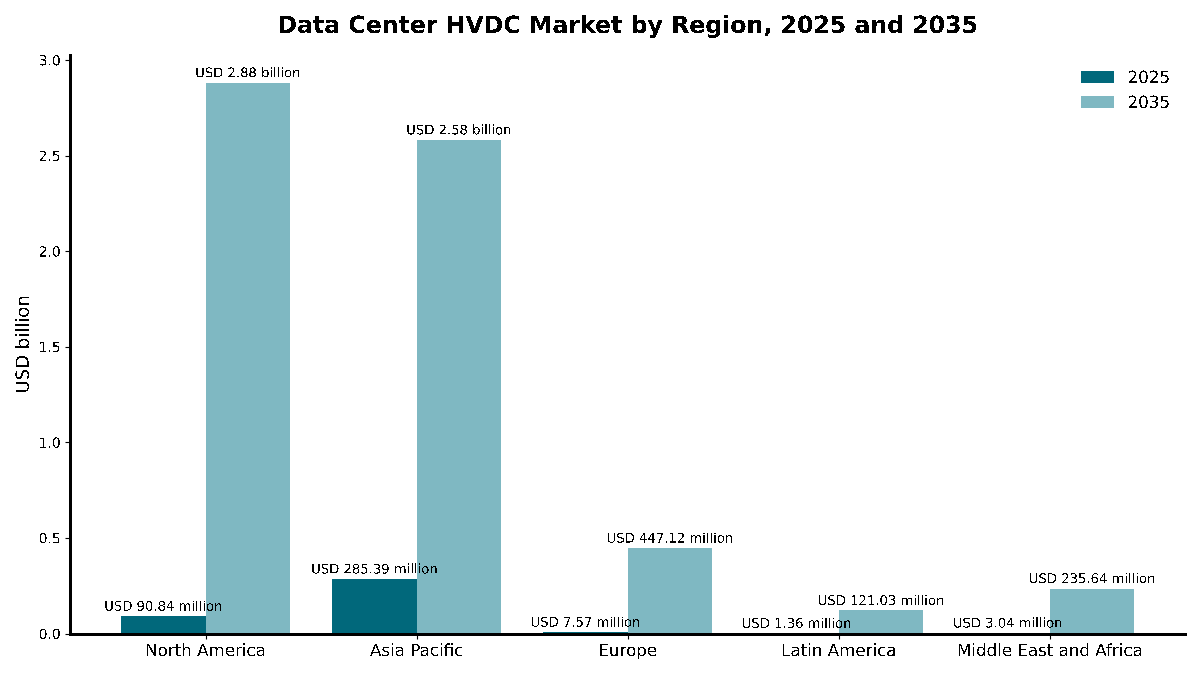
Asia Pacific leads with 73.5% of 2025 value. In the data center HVDC market, Latin America is the fastest-growing region at 56.65% a year from a base of USD 1.36 million. North America overtakes Asia Pacific in 2030 and reaches USD 2.88 billion by 2035, because 800 VDC adoption follows the AI build in the United States.
Asia Pacific Leads with 73.5% Share
Asia Pacific is worth USD 285.39 million in 2025 and USD 2.58 billion by 2035, a CAGR of 24.64%. China alone accounts for USD 248.87 million, where HVDC penetration is about 20% according to Chinese financial press in May 2026, against 1% to 5% in Southeast Asia and North America. Alibaba Cloud says it is scaling up HVDC deployment based on its Panama experience. In January 2026, ST Telemedia Global Data Centres launched FutureGrid Accelerator in Singapore, described as Southeast Asia’s first live HVDC-powered AI infrastructure testbed.
North America Holds 23.4% Share
North America is worth USD 90.84 million in 2025 and grows at 41.30% a year to USD 2.88 billion by 2035. The United States hosted 15.9 GW of the capacity under construction in late 2025, and NVIDIA’s 800 VDC power-system partners include Vertiv, Eaton and GE Vernova. DC Market Insights forecasts 800 VDC to reach 31% of new North American capacity by 2035.
Europe Holds 1.9% Share
Europe is worth USD 7.57 million in 2025 and USD 447.12 million by 2035, a CAGR of 50.36%. DC Market Insights expects grid connection limits in the main hubs to slow new AI halls, while the EU reporting rules under Delegated Regulation 2024/1364 reward lower conversion losses.
Middle East and Africa Holds 0.8% Share
The Middle East and Africa is worth USD 3.04 million in 2025 and USD 235.64 million by 2035, a CAGR of 54.50%. DC Market Insights expects new AI campuses in Saudi Arabia and the United Arab Emirates to adopt high-density DC designs from the start.
Latin America Holds 0.3% Share
Latin America is worth USD 1.36 million in 2025 and USD 121.03 million by 2035, the fastest growth of any region at 56.65% a year. DC Market Insights models the first ±400 VDC and 800 VDC halls in Brazil and Mexico after 2027.
Country Analysis: Which Countries Buy the Most HVDC Data Center Power Systems?
China leads with USD 248.87 million in 2025, 64.1% of global value. China is the largest country market for HVDC data center power systems, followed by the United States at USD 82.21 million (21.2%) and Canada at USD 8.63 million (2.2%). The 12 largest countries account for 96.5% of 2025 spending.
| Rank | Country | Region | 2025 (USD million) | Share 2025 | 2035 (USD billion) | CAGR 2025-2035 |
|---|---|---|---|---|---|---|
| 1 | China | Asia Pacific | 248.87 | 64.1% | 1.59 | 20.38% |
| 2 | United States | North America | 82.21 | 21.2% | 2.58 | 41.14% |
| 3 | Canada | North America | 8.63 | 2.2% | 0.30 | 42.72% |
| 4 | Japan | Asia Pacific | 6.21 | 1.6% | 0.14 | 36.44% |
| 5 | India | Asia Pacific | 5.84 | 1.5% | 0.22 | 43.62% |
| 6 | Singapore | Asia Pacific | 5.84 | 1.5% | 0.11 | 34.01% |
| 7 | Australia | Asia Pacific | 4.75 | 1.2% | 0.13 | 39.11% |
| 8 | South Korea | Asia Pacific | 4.38 | 1.1% | 0.11 | 37.92% |
| 9 | Malaysia | Asia Pacific | 3.65 | 0.9% | 0.14 | 43.88% |
| 10 | Germany | Europe | 1.82 | 0.5% | 0.10 | 49.03% |
| 11 | United Kingdom | Europe | 1.51 | 0.4% | 0.08 | 49.63% |
| 12 | Saudi Arabia | Middle East and Africa | 1.04 | 0.3% | 0.09 | 56.13% |
The United States overtakes China by 2029 in the DC Market Insights model and reaches USD 2.58 billion by 2035. Saudi Arabia is the fastest-growing country in the table at 56.13% a year. The country figures are a DC Market Insights allocation of the regional totals, weighted by each country’s estimated share of new and installed data center capacity and its HVDC adoption.
Forecast Scenarios: How Could the 2035 Forecast Change?
The base case reaches USD 6.27 billion by 2035. The data center HVDC market has a range of USD 4.15 billion to USD 8.49 billion across the low and high scenarios.
| Scenario | Assumption from 2026 | 2035 (USD billion) | CAGR 2025-2035 |
|---|---|---|---|
| Low | Capacity additions 15% below base; ±400 VDC and 800 VDC adoption 25% below base | 4.15 | 26.73% |
| Base | Additions rise to 27.0 GW a year; HVDC reaches 43.7% of new capacity | 6.27 | 32.07% |
| High | Additions 15% above base; ±400 VDC and 800 VDC adoption 20% above base | 8.49 | 36.13% |
The low case is a slower AI build: fewer racks pass 200 kW and 800 VDC stays a niche for the largest training clusters. The high case assumes the 800 VDC supply chain ships on time and colocation operators standardize on DC for AI suites.
Competitive Insights: Who Leads the Data Center HVDC Market?
The three largest suppliers hold about 46% of the 2025 data center HVDC market, a DC Market Insights estimate.
- Delta Electronics
- Zhongheng Electric
- Vertiv
- Eaton
- Schneider Electric
- ABB
- Siemens
- Hitachi Energy
- GE Vernova
- Mitsubishi Electric
- LITEON
- Flex
- Infineon
- Texas Instruments
- Navitas
- onsemi
DC Market Insights estimates that Delta Electronics and Zhongheng Electric, the suppliers most closely tied to the 240 VDC systems of Alibaba and Tencent, together hold about 38% of the 2025 market (DC Market Insights estimate: their China installed base set against the model’s USD 260.32 million of 240 VDC and 336 VDC demand). In October 2025, NVIDIA named data center power-system partners for 800 VDC including ABB, Eaton, GE Vernova, Hitachi Energy, Mitsubishi Electric, Schneider Electric, Siemens and Vertiv, with Delta, Flex and LITEON among the power-component partners. Vertiv, whose full-year 2025 net sales were USD 10.23 billion, said in October 2025 that it planned to release its 800 VDC portfolio in the second half of 2026. Eaton acquired Resilient Power Systems for USD 86 million, including estimated contingent consideration (Source: Eaton Form 10-Q filed with the US Securities and Exchange Commission), and GE Vernova reported USD 2.40 billion of first-quarter 2026 electrification orders tied to data center customers. Flex agreed to buy EPC Power, which has an 800 VDC-ready platform, for USD 4.40 billion. CATL invested RMB 4.10 billion for 49% of Zhongheng Technology Investment, a major investor in Zhongheng Electric.
Recent Developments
Six developments since October 2024 trace the move to 800 VDC in data center power.
- In October 2024, Microsoft described Mt Diablo, a disaggregated 400 VDC power unit developed with Meta that scales from hundreds of kW up to 1 MW (Source: Microsoft Azure blog).
- In May 2025, NVIDIA announced its 800 VDC architecture for 1 MW IT racks, with full-scale production planned alongside Kyber rack-scale systems in 2027 (Source: NVIDIA technical blog).
- In August 2025, Eaton acquired Resilient Power Systems, a developer of solid-state transformer technology, for USD 86 million (Source: Eaton Form 10-Q filing).
- In October 2025, Vertiv said its 800 VDC portfolio of centralized rectifiers, DC busways and rack-level DC-DC converters is planned for release in the second half of 2026 (Source: Vertiv press release).
- In January 2026, ST Telemedia Global Data Centres launched FutureGrid Accelerator, an HVDC-powered AI infrastructure testbed in Singapore, with LITEON, ERI@N and Amperesand (Source: JTC industry news).
- In September 2026, Flex agreed to acquire EPC Power, which has an 800 VDC-ready platform for data centers, for a purchase price of USD 4.40 billion (Source: Flex Form 8-K exhibit).
We follow these launches, deals and power architecture changes as they happen in our data center industry updates.
Methodology: How We Built the Data Center HVDC Market Model
DC Market Insights built the model from 16 annual capacity cohorts (2020 to 2035), rising from 6.0 GW of new capacity in 2020 to 12.0 GW in 2025 and 27.0 GW in 2035. Each cohort was split across 6 sub-regions, each with its own adoption curve for 240 VDC, ±400 VDC and 800 VDC. HVDC megawatts were priced with a spend-per-MW curve for each voltage, and service and replacement spending of USD 0.024 million per installed HVDC MW per year was added on the cumulative installed base, which starts from 0.65 GW at the end of 2019. The resulting installed base of 3.47 GW in 2025 equals 2.99% of global data center capacity, consistent with the published global penetration figure below 3%. The total was split by 3 voltage architectures, 6 components, 3 applications, 4 end-user types, 5 regions and 12 countries, and every split sums to the market total. The result was checked top-down against supplier disclosures: the 2025 market equals 3.8% of Vertiv’s 2025 net sales, and the ±400 VDC price matches a published USD 450,000 quote for an 800 kW system.
Table of contents
- 01Introduction
- 1.1Market Definition and Scope
- 1.2Voltage Classes Covered
- 1.3Report Structure
- 02Research Methodology
- 2.1Bottom-Up Capacity Cohort Model
- 2.2Spend per MW Assumptions
- 2.3Top-Down Supplier Checks
- 2.4Sources and Fact Verification
- 03Executive Summary
- 3.1Market Size, 2020-2035
- 3.2Key Findings
- 3.3Analyst View
- 04Market Dynamics
- 4.1Drivers
- 4.2Trends
- 4.3Challenges
- 4.4Opportunities
- 05Pricing Analysis
- 5.1HVDC System Spend per MW by Voltage, 2020-2035
- 5.2HVDC versus UPS Cost Comparison
- 06Standards and Regulation
- 6.1ETSI EN 300 132-3
- 6.2YD/T 2378 (240 V DC)
- 6.3EMerge Alliance 380 VDC
- 6.4National Electrical Code Article 712
- 6.5Open Compute Project Mt Diablo
- 6.6EU Delegated Regulation 2024/1364
- 07Supply Chain and Technology
- 7.1Power Semiconductors
- 7.2Rectifiers and Power Shelves
- 7.3Solid-State Transformers
- 7.4DC Protection and Distribution
- 08Market Size and Forecast
- 8.1Market Size, 2020-2035
- 8.2Installed HVDC Capacity
- 8.3New HVDC Capacity by Year
- 09Market by Voltage Architecture
- 9.1240 VDC and 336 VDC
- 9.2380 VDC and ±400 VDC
- 9.3800 VDC
- 10Market by Component
- 10.1Rectifiers and Power Systems
- 10.2Solid-State Transformers
- 10.3DC Distribution (Busway, Switchgear and PDUs)
- 10.4Rack-Level DC-DC Converters and Power Shelves
- 10.5Energy Storage Interface
- 10.6Services
- 11Market by Application
- 11.1AI Training and Inference
- 11.2Cloud and General-Purpose Compute
- 11.3Telecom and Edge
- 12Market by End-user
- 12.1Hyperscale Data Centers
- 12.2Colocation Data Centers
- 12.3GPU and Neocloud Providers
- 12.4Enterprise and Telecom Data Centers
- 13DC Exclusive: The HVDC Voltage Transition Matrix
- 13.1Voltage Architecture by End-user, 2030
- 13.2Model Inputs
- 14Market by Region
- 14.1North America (United States, Canada)
- 14.2Asia Pacific (China, Japan, India, Singapore, Australia, South Korea, Malaysia)
- 14.3Europe (Germany, United Kingdom, France, Netherlands)
- 14.4Latin America (Brazil, Mexico)
- 14.5Middle East and Africa (Saudi Arabia, United Arab Emirates)
- 15Country Analysis
- 15.1Top 12 Countries, 2025 and 2035
- 15.2Country Growth Rates
- 16Regional Cross-Sections
- 16.1Voltage Architecture by Region
- 16.2Adoption Share of New Capacity by Region
- 17Forecast Scenarios
- 17.1Low Case
- 17.2Base Case
- 17.3High Case
- 18Competitive Landscape
- 18.1Market Concentration
- 18.2800 VDC Partner Ecosystem
- 18.3Mergers and Acquisitions
- 19Company Profiles
- 19.1Delta Electronics
- 19.2Zhongheng Electric
- 19.3Vertiv
- 19.4Eaton
- 19.5Schneider Electric
- 19.6ABB
- 19.7Siemens
- 19.8Hitachi Energy
- 19.9GE Vernova
- 19.10Mitsubishi Electric
- 19.11LITEON
- 19.12Flex
- 19.13Infineon
- 19.14Texas Instruments
- 19.15Navitas
- 19.16onsemi
- 20Recent Developments
- 20.1Product Launches
- 20.2Acquisitions and Investments
- 21Analyst Recommendations
- 21.1For Data Center Operators
- 21.2For Power Equipment Suppliers
- 21.3For Investors
- Fig. 1Data Center High-Voltage Direct Current (HVDC) Market Size, 2020-2035
- Fig. 2Market by Voltage Architecture, 2025 and 2035
- Fig. 3Market by Component, 2025 and 2035
- Fig. 4Market by Region, 2025 and 2035
- Fig. 5HVDC Share of New Capacity, 2025 and 2035
- Fig. 6Forecast Scenarios, 2035
- Table 1Report Attributes
- Table 2HVDC System Spend per MW, 2020-2035
- Table 3Market by Voltage Architecture, 2025 and 2035
- Table 4Market by Component, 2025 and 2035
- Table 5Market by Application, 2025 and 2035
- Table 6Market by End-user, 2025 and 2035
- Table 7HVDC Voltage Transition Matrix, 2030
- Table 8Market by Region, 2025 and 2035
- Table 9Top 12 Countries, 2025 and 2035
- Table 10Forecast Scenarios, 2035
- Table 11Standards Affecting Data Center HVDC
About this report
Written by Satyabrat Rajawat and reviewed by Deepti Agrawal, Senior Editor, Research. Figures are built top-down and bottom-up and reconciled before publication, with 2025 as the base year.
Read our methodologyHow we built this
- Historical period2020-2024
- Base year2025
- Forecast period2026-2035
- Sizing approachTop-down + bottom-up
Need more than the report?
Advisory on this market
Due diligence, site selection and market entry work, by the analysts who wrote this report.
See consulting servicesFrequently asked questions
USD 388.20 million in 2025. DC Market Insights values the global Data Center High-Voltage Direct Current (HVDC) Market at USD 388.20 million in 2025 and forecasts USD 6.27 billion by 2035, a CAGR of 32.07%.
240 volts or more of direct current. HVDC power infrastructure for data centers converts grid AC to DC once and distributes DC at 240 VDC, ±400 VDC or 800 VDC to the IT racks through rectifiers, solid-state transformers, DC busways and rack-level converters.
200 kW per rack is where NVIDIA says 54 V in-rack distribution begins to hit physical limits. AI racks heading toward 1 MW need a higher bus voltage, so DC Market Insights forecasts HVDC installations to rise from 811 MW in 2025 to 11.8 GW a year by 2035.
70.42% a year. 800 VDC systems grow from USD 18.12 million in 2025 to USD 3.74 billion by 2035, the fastest of any voltage architecture, as NVIDIA Kyber rack-scale systems reach full-scale production from 2027.
About USD 0.56 million per MW for ±400 VDC in 2025, DC Market Insights estimates, against USD 0.31 million per MW at 240 VDC and USD 0.72 million per MW for 800 VDC pilot systems. One published quote put an 800 kW ±400 V system at about USD 450,000.
2.99% of installed data center capacity ran on HVDC at the end of 2025, about 3.47 GW out of roughly 116 GW, DC Market Insights estimates. Penetration is about 20% in China and 1% to 5% in Southeast Asia and North America.
73.5% of 2025 value sits in Asia Pacific, led by China at USD 248.87 million. North America overtakes Asia Pacific in 2030 and reaches USD 2.88 billion by 2035, growing 41.30% a year.
About 38% of 2025 value is held by Delta Electronics and Zhongheng Electric, DC Market Insights estimates. NVIDIA’s 800 VDC power-system partners include ABB, Eaton, GE Vernova, Hitachi Energy, Schneider Electric, Siemens and Vertiv.
240 V or higher is the DC level an HVDC data center distributes to its IT racks. It converts grid AC to DC once, near the facility entrance or in a row-level sidecar, instead of converting AC inside every server.
200 kW is where NVIDIA says 54 V in-rack distribution begins to hit physical limits. NVIDIA is leading a transition to 800 VDC power to support 1 MW IT racks and beyond, starting in 2027, and claims 85% more power through the same conductor size.
±400 VDC is the voltage Google, Meta and Microsoft are standardizing through the Open Compute Project. Microsoft described the Mt Diablo design in October 2024 as a disaggregated 400 VDC unit scaling from hundreds of kW up to 1 MW.
Get this report
How do I get the full report?
Request a quote; we reply by email within one business day.
How and when will I receive the report?
By email, within 24-48 business hours of payment.
How can I pay?
Once you accept the quote, we email you a secure payment link.
Can I see a sample first?
Yes. Request a free sample and we will email it to you.
Can the report be tailored to my needs?
Yes. We can add countries, segments or data cuts. Talk to an analyst about the scope you need.
Can I get an invoice or pay against a purchase order?
Write to sales@dcmarketinsights.com and our team will help.