
Data Center Construction Market Size, Share & Forecast to 2035
Market at a glance
The Data Center Construction market was worth USD 65.60 billion in 2025 and is forecast to reach USD 219.14 billion by 2035, growing at a 12.82% CAGR. North America accounts for 66.7% of the market.
 By Satyabrat Rajawat, Senior Research Analyst, Strategic Advisory
 Reviewed by Deepti Agrawal
Last updated 6 Oct 2026
Base year 2025 PDF + Excel
Reviewed by Deepti Agrawal
Last updated 6 Oct 2026
Base year 2025 PDF + Excel
Source: DC Market Insights analysis
Key findings
More Than 23 GW Under Construction Lifts Work Put in Place to 9.79 GW-Equivalent
Campuses Over 100 MW Take 58.7% of Construction Value by 2035
Development Costs Rose 21% per MW Since Late 2024
GPU and Neocloud Campuses Grow to USD 27.83 Billion by 2035
What is inside the report
- 01Introduction
- 02Research Methodology
- 03Executive Summary
- 04Market Dynamics
- 05Pricing and Cost Analysis
- 06Standards and Regulation
- 07Supply Chain and Value Chain Analysis
- 08Global Data Center Construction Market Size and Forecast
- 09Market by Construction Type
- 10Market by Data Center Type
- 20chapters
- 2020-2024Historical period
- 2026-2035Forecast period
- 17Companies profiled
Regional insights
- North America66.7%
- Europe14.5%
- Asia Pacific12.5%
- Middle East and Africa3.4%
- Latin America2.9%
Segmentation
Companies profiled
- Turner Construction
- Holder Construction
- DPR Construction
- Clayco
- HITT Contracting
- Hensel Phelps
- Skanska
- AECOM
- Jacobs
- EMCOR
- Comfort Systems USA
- Quanta Services
- Sterling Infrastructure
- Exyte
- Mercury Engineering
- Kirby Group Engineering
- Larsen & Toubro
Recent developments
OpenAI, Oracle and SoftBank announced five new Stargate data center sites in the United States, bringing planned capacity to nearly 7 GW (Source: OpenAI announcement).
Turner Construction reported data center revenue of USD 6.4 billion in the first nine months of 2025, compared with USD 3.6 billion for all of 2024 (Source: Data Center Dynamics news report).
Exyte secured three AI data center projects in the Greater Frankfurt region worth about EUR 750 million (Source: Exyte press release).
Meta expanded its economic investment in the Hyperion campus in Louisiana to USD 50 billion for 5 GW of computing capacity (Source: Bisnow news report).
EMCOR reported record remaining performance obligations of USD 17.14 billion, with growth including network and communications (Source: EMCOR earnings release).
Cushman & Wakefield reported that data center construction costs had risen an average of 21% per MW since the fourth quarter of 2024 (Source: Cushman & Wakefield press release).
Full analysis
The Data Center Construction Market covers the general, electrical, mechanical and site works that contractors put in place to build, expand and retrofit data center buildings and campuses. DC Market Insights values the global Data Center Construction Market at USD 65.60 billion in 2025 and forecasts USD 219.14 billion by 2035, a CAGR of 12.82%. The 2025 value is built from the work itself: about 9.79 GW-equivalent of data center capacity put in place during the year at a weighted contractor value of USD 6.70 million per MW, excluding land, IT equipment, owner-furnished long-lead equipment and design fees. Graphics processing unit (GPU) and neocloud providers are the fastest-growing segment at 17.30% a year because they build dense, liquid-cooled halls on short schedules, and the Middle East and Africa is the fastest-growing region at 17.48% a year as large AI campuses are added from a small base.
Executive Summary
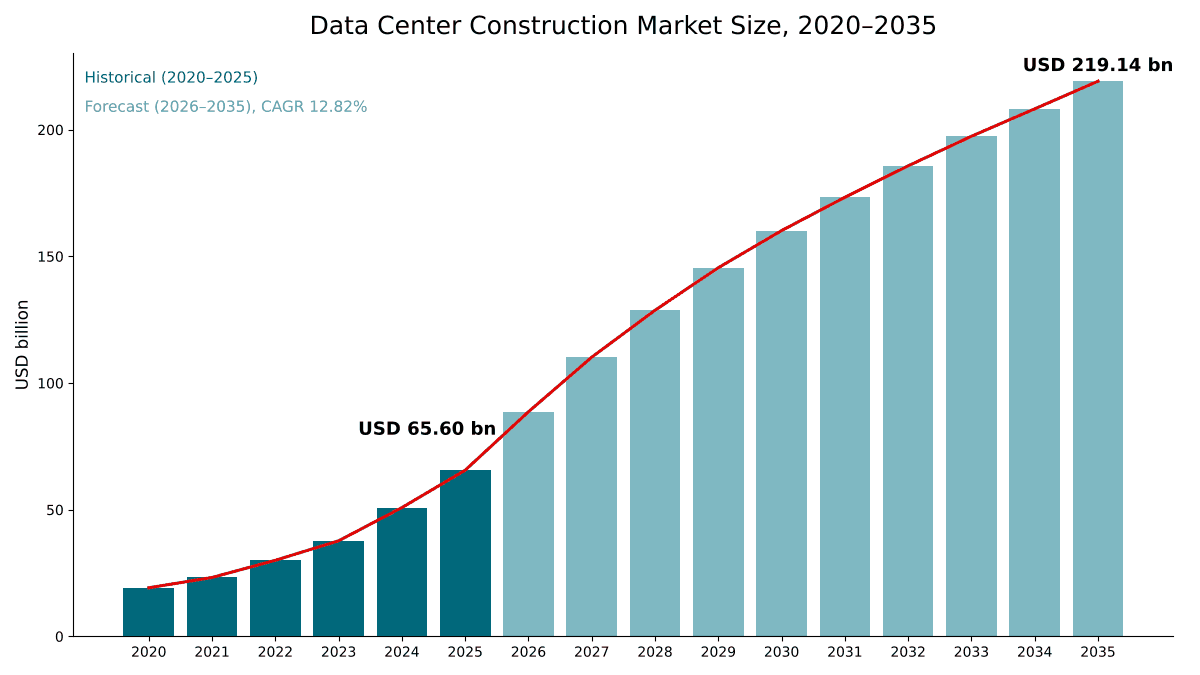
The Global Data Center Construction Market size was valued at USD 19.19 billion in 2020, reached USD 65.60 billion in 2025, and is anticipated to reach USD 219.14 billion by 2035, at a CAGR of 12.82% during the forecast period.
| Report attribute | Details |
|---|---|
| Historical Period | 2020-2024 |
| Base Year | 2025 |
| Forecast Period | 2026-2035 |
| Data Center Construction Market Size 2025 | USD 65.60 Billion |
| Data Center Construction Market, CAGR | 12.82% |
| Data Center Construction Market Size 2035 | USD 219.14 Billion |
The market grew at 27.87% a year between 2020 and 2025, and 2025 alone added 29.0% over 2024 as hyperscale and AI campuses moved from land deals into full construction. The United States sets the pace: US Census Bureau data, as reported by Wolf Street, put US data center construction spending for 2025 at USD 41 billion, up 32% from 2024 and 344% from 2020. The DC Market Insights US estimate for 2025, USD 41.62 billion, is within 2% of that figure.
Growth slows to 12.82% a year from 2025 to 2035 because the steepest part of the volume ramp falls in 2026 to 2028 and contractor value per MW rises only about 3% a year after 2027. Work put in place rises from 9.79 GW-equivalent in 2025 to 23.43 GW-equivalent in 2035. DC Market Insights forecasts 2026 at USD 88.67 billion, a 35.2% jump.
Market Scope: What Does the Data Center Construction Market Cover?
The Data Center Construction Market covers the value of construction work put in place each year on data center buildings and campuses, measured in current US dollars at contractor value, with 2025 as the base year and forecasts to 2035. DC Market Insights sizes it at USD 65.60 billion in 2025.
Included. General construction (foundations, structure, shell, roofing, architectural finishes and the fit-out of data halls and support space), electrical construction (medium- and low-voltage distribution, switchboards, busway, grounding, lighting, controls wiring and the installation of power equipment), mechanical construction (chilled-water and condenser-water piping, air handling, liquid-cooling distribution, plumbing and fire protection), and site and civil works (earthworks, roads, drainage, underground utilities and on-campus duct banks).
Excluded. Land, servers, storage and network equipment, long-lead power and cooling equipment that the owner buys directly and hands to the contractor to install (such as generators, uninterruptible power supply systems and chillers bought under owner frame agreements), utility substations and transmission lines outside the fence, design and engineering fees, and financing costs.
How the segments fit together. The construction-type split divides the USD 65.60 billion by trade. The data center type, tier, project type and facility size splits re-cut the same total by owner, resilience level, build route and campus scale, so each split sums to the market total.
Market Drivers: What Drives the Data Center Construction Market?
Three drivers explain most of the growth in the Data Center Construction Market: a construction pipeline of more than 23 GW worldwide, capital budgets of the largest operators expected to rise by about USD 300 billion in a year, and AI halls that need more electrical and mechanical work per MW than cloud halls.
More Than 23 GW Under Construction Lifts Work Put in Place to 9.79 GW-Equivalent
BloombergNEF counted more than 23 GW of data center capacity under construction worldwide at the end of September 2025, with 17 GW across 311 locations in the Americas, 3.2 GW across 283 sites in Asia Pacific and 2.9 GW across 258 sites in Europe, the Middle East and Africa. The United States alone hosted 15.9 GW. DC Market Insights converts that pipeline into annual work put in place by assuming an average build period of about 2.4 years, which gives 9.79 GW-equivalent of work in 2025 and, at USD 6.70 million per MW, the USD 65.60 billion market value. EMCOR reported record remaining performance obligations of USD 17.14 billion at June 30, 2026, with the most significant growth coming from network and communications, water and wastewater, institutional and healthcare (Source: EMCOR earnings release filed with the US Securities and Exchange Commission).
Capital Spending of the Largest Operators Rises Toward USD 750 Billion
BloombergNEF expects the capital expenditure of the 14 largest publicly owned data center operators to come close to USD 750 billion in 2026, against a little less than USD 450 billion in 2025. DC Market Insights estimates that hyperscale data centers took USD 33.91 billion (51.7%) of construction value in 2025. Meta has expanded its economic investment in the Hyperion campus in Richland Parish, Louisiana, from USD 10 billion to USD 50 billion for 5 GW of computing capacity, with 2 GW expected by 2030 and more than 7,500 jobs at peak construction.
AI Halls Carry a 7% to 10% Construction Cost Premium
Turner & Townsend identified a 7% to 10% construction cost premium between traditional and AI data centers in the United States in its Data Centre Construction Cost Index 2025-2026. DC Market Insights estimates that electrical and mechanical construction together took 68.9% of the market in 2025 and will take 74.5% by 2035, as campuses add higher-voltage distribution, larger cooling plants and liquid-cooling piping to every hall. See the Data Center Liquid Cooling Market report for the cooling side.
Market Trends: How Is Data Center Construction Changing?
The Data Center Construction Market is moving toward larger campuses, denser multi-story halls and contractors that self-perform electrical and mechanical work, with campuses over 100 MW growing from 46.7% of value in 2025 to 58.7% by 2035.
Campuses Over 100 MW Take 58.7% of Construction Value by 2035
Data center construction value is concentrating in very large campuses. DC Market Insights estimates that facilities over 100 MW accounted for USD 30.63 billion in 2025 and will reach USD 128.64 billion by 2035, growing 15.43% a year. OpenAI, Oracle and SoftBank have announced five new Stargate sites that bring planned capacity to nearly 7 GW, with over USD 400 billion of investment over the following three years and over 25,000 onsite jobs.
Multi-Story Liquid-Cooled Halls Raise Mechanical Scope
Builders are stacking data halls to shorten cable runs between accelerators. Microsoft’s Fairwater 2 site in Atlanta uses a two-story layout to increase chip density and a closed-loop liquid cooling system. DC Market Insights forecasts mechanical construction to grow at 13.74% a year, the fastest of the four trades, from USD 17.91 billion in 2025 to USD 64.87 billion in 2035.
Specialty Contractors Take a Larger Share of Each Project
Electrical and mechanical contractors are capturing a rising share of each project. Comfort Systems USA reported a record backlog of USD 14.1 billion at mid-2026, and technology customers generated 58% of its first-half 2026 revenue, up from 40% a year earlier. Sterling Infrastructure reported that revenue in its E-Infrastructure Solutions segment rose 192% in the second quarter of 2026, with mission-critical projects, including data centers, at 92% of that segment’s backlog. Factory-built capacity is covered in the Modular Data Center Market report.
Market Challenges: What Holds the Data Center Construction Market Back?
Skilled labor and cost inflation are the two constraints that DC Market Insights expects to slow the Data Center Construction Market most in 2026 and 2027, with development costs up 21% per MW in under two years.
Development Costs Rose 21% per MW Since Late 2024
Cushman & Wakefield’s latest data center development cost guide reported that data center construction costs had risen an average of 21% per MW since the fourth quarter of 2024, and that all-in greenfield development costs in the United States and Canada average USD 17.6 million per MW for the most modern facilities, excluding chips and GPUs. Powered land in primary US markets reached an average of USD 584,000 per MW in 2026 year-to-date, 51% higher than a year earlier. Turner & Townsend measured cost inflation for traditional data centers averaging 5.5% across 52 markets in 2025. DC Market Insights builds a 7.6% rise in US contractor value per MW into 2026 and 4.3% into 2027, falling to 3.0% a year from 2028.
The Construction Workforce Must Add 349,000 Workers in 2026
Associated Builders and Contractors has estimated that the US construction industry needs to attract about 349,000 net new workers in 2026 and 456,000 in 2027, and said demand for electricians capable of precision wiring has surged because of the rapid increase in data center construction. Electrical construction, worth USD 27.29 billion for 2025, is the largest trade, so a shortage of licensed electricians limits how fast campuses can energize. In the Turner & Townsend survey, 83% of respondents said local supply chains are not well prepared for advanced cooling.
Market Opportunities: Where Are the New Revenue Pools?
The two largest new revenue pools in the Data Center Construction Market are GPU and neocloud campuses, growing at 17.30% a year, and the retrofit of operating halls for higher densities, growing at 15.28% a year.
GPU and Neocloud Campuses Grow to USD 27.83 Billion by 2035
Specialist GPU cloud operators spent USD 5.64 billion on data center construction in 2025, and DC Market Insights expects their spending to reach USD 27.83 billion in 2035, almost five times the 2025 level. Their mechanical share of 31.8% in 2025 is the highest of any owner type.
Retrofit and Renovation Grows to USD 22.57 Billion by 2035
Many operating halls were designed for lower rack densities than AI clusters need, so hosting them requires new power distribution and liquid cooling. DC Market Insights models retrofit and renovation work at USD 5.44 billion in 2025 and USD 22.57 billion by 2035, rising from 8.3% to 10.3% of the market.
Pricing: How Much Does Data Center Construction Cost per MW?
Contractor construction value averaged USD 6.70 million per MW worldwide in 2025 and USD 6.55 million per MW in the United States, according to DC Market Insights estimates that exclude land, IT equipment, owner-furnished long-lead equipment and design fees.
| Contractor value per MW (USD million) | 2020 | 2025 | 2030 | 2035 |
|---|---|---|---|---|
| United States | 5.00 | 6.55 | 8.04 | 9.32 |
| Europe | 6.60 | 8.42 | 10.08 | 11.58 |
| Asia Pacific | 4.90 | 6.05 | 7.17 | 8.19 |
| Latin America | 4.50 | 5.82 | 6.99 | 8.07 |
| Middle East and Africa | 5.60 | 7.11 | 8.54 | 9.85 |
| Global weighted average | 5.26 | 6.70 | 8.11 | 9.35 |
Europe carries the highest contractor value per MW in the model, reflecting DC Market Insights assumptions on labor rates and planning requirements. Third-party cost surveys show the same spread between cities: Turner & Townsend ranked Tokyo and Singapore as the two most expensive markets at USD 15.2 and USD 14.5 per watt, with Zurich third at USD 14.2 per watt, on Turner & Townsend’s own cost basis, which differs from the contractor value used here.
Standards and Regulation: Which Rules Shape Data Center Construction?
Three sets of rules shape what contractors build: the TIA-942 infrastructure standard of the Telecommunications Industry Association (TIA), the Uptime Institute Tier classification, and the energy-reporting rules of the European Union (EU).
ANSI/TIA-942-C (May 2024). The ANSI/TIA-942-C Telecommunications Infrastructure Standard for Data Centers specifies infrastructure requirements for data centers and computer rooms, including single-tenant enterprise and multi-tenant facilities. Revision C changes requirements for telecommunications, power, cooling, architecture, fire protection, safety and physical security, so it reaches every construction trade covered here.
Uptime Institute Tiers. Tier II facilities include redundant critical power and cooling components. A Tier III data center requires no shutdowns for equipment replacement and maintenance, and Tier IV adds fault tolerance, so that equipment failures or distribution path interruptions stop short of the IT operations. DC Market Insights estimates that Tier III and Tier IV designs took 90.6% of construction value in 2025.
EU data center rating scheme. Commission Delegated Regulation (EU) 2024/1364 of 14 March 2024 sets up the first phase of a common EU rating scheme for data centers. Operators of data centers with an installed information technology power demand of at least 500 kW must report 24 performance indicators, first by 15 September 2024, then by 15 May 2025 and annually after that. Reporting on energy and sustainability indicators pushes new European builds toward metering, heat-reuse connections and efficient cooling plants at the design stage.
Market Segmentation: Which Segment Leads the Data Center Construction Market?
Electrical construction leads the Data Center Construction Market with 41.6% of 2025 value, hyperscale data centers lead owners with 51.7%, and Tier III designs take 71.8%. Among owner types, GPU and neocloud providers are the fastest-growing segment at 17.30% a year, against 13.27% for hyperscale and 6.85% for enterprise, because their AI halls are built in compressed schedules with the highest electrical and mechanical content per MW.
By Construction Type: Electrical Construction Leads with 41.6%
| Construction type | 2025 (USD billion) | Share 2025 | 2035 (USD billion) | CAGR 2025-2035 |
|---|---|---|---|---|
| Electrical Construction | 27.29 | 41.6% | 98.39 | 13.68% |
| Mechanical Construction | 17.91 | 27.3% | 64.87 | 13.74% |
| General Construction | 15.22 | 23.2% | 41.86 | 10.65% |
| Site and Civil Works | 5.18 | 7.9% | 14.03 | 10.47% |
Electrical and mechanical work gain 5.6 points of share by 2035 because rack density rises faster than building area: a hall of the same floor area now carries more power, cooling and distribution than it did in 2020.
By Data Center Type: Hyperscale Data Centers Lead with 51.7%
| Data center type | 2025 (USD billion) | Share 2025 | 2035 (USD billion) | CAGR 2025-2035 |
|---|---|---|---|---|
| Hyperscale Data Centers | 33.91 | 51.7% | 117.90 | 13.27% |
| Colocation Data Centers | 17.97 | 27.4% | 54.57 | 11.74% |
| Enterprise Data Centers | 6.10 | 9.3% | 11.83 | 6.85% |
| GPU and Neocloud Providers | 5.64 | 8.6% | 27.83 | 17.30% |
| Edge and Modular Data Centers | 1.97 | 3.0% | 7.01 | 13.55% |
Enterprise construction grows slowest as companies move workloads into cloud and colocation.
By Tier Standard: Tier III Leads with 71.8%
Tier III designs account for USD 47.10 billion in 2025 and USD 159.10 billion by 2035, growing 12.94% a year. Tier IV designs are worth USD 12.33 billion (18.8%) and grow fastest at 14.24% a year. Tier I and II designs hold USD 6.17 billion (9.4%) and grow 8.04% a year.
By Project Type: Greenfield New Build Leads with 72.4%
Greenfield new builds are worth USD 47.49 billion in 2025 and USD 149.45 billion by 2035, a CAGR of 12.15%. Brownfield expansion on existing campuses is worth USD 12.66 billion (19.3%) and grows 14.04% a year. Retrofit and renovation grows fastest at 15.28% a year, from USD 5.44 billion to USD 22.57 billion.
By Facility Size: Campuses Over 100 MW Lead with 46.7%
Campuses over 100 MW account for USD 30.63 billion in 2025 and grow 15.43% a year to USD 128.64 billion by 2035. Facilities of 20 to 100 MW hold USD 25.39 billion (38.7%) and grow 10.52% a year, while sites under 20 MW hold USD 9.58 billion (14.6%) and grow 8.41% a year.
DC Exclusive: The Construction Value per MW Model and Trade × Owner Matrix
At USD 14.64 billion in 2025, electrical construction for hyperscale data centers is the single largest cell of the matrix and 22.3% of all data center construction value. The matrix below cross-tabulates the two splits that contractors and owners ask about most: which trade does the work, and for whom.
| 2025, USD billion | Electrical | Mechanical | General | Site and Civil | Total |
|---|---|---|---|---|---|
| Hyperscale Data Centers | 14.64 | 9.23 | 7.56 | 2.49 | 33.91 |
| Colocation Data Centers | 7.28 | 4.82 | 4.39 | 1.49 | 17.97 |
| Enterprise Data Centers | 2.17 | 1.60 | 1.71 | 0.62 | 6.10 |
| GPU and Neocloud Providers | 2.55 | 1.79 | 0.99 | 0.30 | 5.64 |
| Edge and Modular Data Centers | 0.65 | 0.47 | 0.57 | 0.28 | 1.97 |
| Total | 27.29 | 17.91 | 15.22 | 5.18 | 65.60 |
GPU and neocloud providers spend 77.0% of their construction budget on electrical and mechanical work, against 61.7% for enterprise data centers, where general construction still takes 28.1%.
The matrix is a DC Market Insights model, not a count of contracts. It is built from 30 inputs: 5 owner-type totals, 4 trade totals, 20 trade-mix shares (one per owner type and trade) and the 2025 market total, and it sums to the USD 65.60 billion market. The construction value per MW model behind it has two inputs that any reader can check: work put in place each year (9.79 GW-equivalent in 2025) and contractor value per MW (USD 6.70 million in 2025). The model and its assumptions are explained on our research methodology page.
Regional Insights: Which Region Leads the Data Center Construction Market?
North America leads the Data Center Construction Market with 66.7% of 2025 value, and the Middle East and Africa is the fastest-growing region at 17.48% a year, because DC Market Insights expects campus-scale AI capacity to be added there from a small base.
North America Leads with 66.7% Share
North American construction was worth USD 43.74 billion in 2025 and is forecast to reach USD 144.39 billion in 2035, a CAGR of 12.69%. The United States accounted for 15.9 GW of the more than 23 GW under construction worldwide in late 2025, and US Census Bureau data compiled by the Associated General Contractors of America show data center construction spending up 57% between July 2025 and July 2026. North America holds its share almost unchanged to 2035, at 65.9%, in the DC Market Insights model, as new campuses move into secondary US markets rather than out of the region.
Europe Holds 14.5% Share
Europe is worth USD 9.51 billion in 2025 and USD 26.40 billion by 2035, a CAGR of 10.74%, the slowest of the five regions. Europe has the highest contractor value per MW in the model at USD 8.42 million in 2025, but DC Market Insights assumes that grid connection limits in the largest metro hubs cap volume. Exyte has announced three AI data center projects in the Greater Frankfurt region worth about EUR 750 million and about 80 MW of IT load, due for completion by 2028.
Asia Pacific Holds 12.5% Share
Asia Pacific is worth USD 8.22 billion in 2025 and USD 29.66 billion by 2035, growing 13.69% a year. BloombergNEF counted 3.2 GW under construction across 283 Asia Pacific sites in late 2025, slightly more than in Europe, the Middle East and Africa combined. Contractor value per MW is lower than in Europe on average, at USD 6.05 million, because the DC Market Insights cost model prices China and India below the regional average, even though Tokyo and Singapore rank as the two most expensive markets in the Turner & Townsend index.
Middle East and Africa Holds 3.4% Share
The Middle East and Africa is worth USD 2.20 billion in 2025 and USD 11.03 billion by 2035, growing fastest at 17.48% a year. Saudi Arabia accounts for 28.4% of the regional total, or USD 625.98 million for 2025, and grows 18.81% a year in the DC Market Insights allocation. Investors weighing new markets can read how we assess power, fiber routes and permitting in our data center site selection and feasibility work.
Latin America Holds 2.9% Share
Latin America is worth USD 1.92 billion in 2025 and USD 7.67 billion by 2035, a CAGR of 14.84%, led by Brazil at USD 868.53 million in 2025, or 45.2% of the regional total in the DC Market Insights allocation.
Country Analysis: Which Countries Spend the Most on Data Center Construction?
The United States leads country spending on data center construction with 63.5% of global value, or USD 41.62 billion for 2025, followed by China at USD 2.78 billion (4.2%) and Canada at USD 2.11 billion (3.2%).
| Rank | Country | Region | 2025 (USD billion) | Share 2025 | 2035 (USD billion) | CAGR 2025-2035 |
|---|---|---|---|---|---|---|
| 1 | United States | North America | 41.62 | 63.5% | 136.05 | 12.57% |
| 2 | China | Asia Pacific | 2.78 | 4.2% | 8.51 | 11.84% |
| 3 | Canada | North America | 2.11 | 3.2% | 8.33 | 14.71% |
| 4 | United Kingdom | Europe | 1.98 | 3.0% | 4.96 | 9.63% |
| 5 | Germany | Europe | 1.86 | 2.8% | 5.07 | 10.51% |
| 6 | Japan | Asia Pacific | 1.24 | 1.9% | 4.06 | 12.59% |
| 7 | France | Europe | 1.07 | 1.6% | 3.11 | 11.32% |
| 8 | India | Asia Pacific | 0.97 | 1.5% | 5.07 | 17.99% |
| 9 | Brazil | Latin America | 0.87 | 1.3% | 3.30 | 14.29% |
| 10 | Netherlands | Europe | 0.83 | 1.3% | 1.95 | 8.96% |
| 11 | Australia | Asia Pacific | 0.78 | 1.2% | 2.70 | 13.20% |
| 12 | Ireland | Europe | 0.77 | 1.2% | 1.69 | 8.16% |
India is the fastest-growing large country market at 17.99% a year, overtaking Japan and France by 2035, in the DC Market Insights allocation, as hyperscale and colocation operators add capacity from a small base. Ireland grows slowest in the top 12 at 8.16% a year. Outside the top 12, Malaysia is worth USD 583.81 million in 2025 and grows 15.48% a year. The country figures are a DC Market Insights allocation of the regional totals, weighted by each country’s estimated share of capacity under construction and its contractor value per MW; the United States and Canada are modeled directly from their own work-in-place and cost series.
Forecast Scenarios: How Could the 2035 Forecast Change?
The Data Center Construction Market reaches USD 219.14 billion by 2035 in the base case, with a range of USD 177.94 billion to USD 254.86 billion across the low and high scenarios.
| Scenario | Assumption from 2026 | 2035 (USD billion) | CAGR 2025-2035 |
|---|---|---|---|
| Low | Work put in place about 12% below base by 2035; contractor value per MW rises 2% a year after 2027 | 177.94 | 10.49% |
| Base | Work put in place rises to 23.43 GW-equivalent in 2035; value per MW rises 3% a year after 2027 | 219.14 | 12.82% |
| High | Work put in place about 12% above base by 2035; contractor value per MW rises 3.5% a year after 2027 | 254.86 | 14.54% |
The low case reflects a two-year pause in AI capital spending after 2027. The main swing factor is power: BloombergNEF reported that hyperscalers now take about 5.3 years to develop a data center, so delays in grid connections move construction value later rather than removing it.
Competitive Insights: Who Leads the Data Center Construction Market?
- Turner Construction
- Holder Construction
- DPR Construction
- Clayco
- HITT Contracting
- Hensel Phelps
- Skanska
- AECOM
- Jacobs
- EMCOR
- Comfort Systems USA
- Quanta Services
- Sterling Infrastructure
- Exyte
- Mercury Engineering
- Kirby Group Engineering
- Larsen & Toubro
Turner Construction holds about 13% of the Data Center Construction Market in 2025, the highest share DC Market Insights can derive from public contractor disclosures (DC Market Insights estimate: Turner’s reported data center revenue of USD 6.4 billion in the first nine months of 2025, annualized and set against the USD 65.60 billion market). DC Market Insights estimates that the five largest general contractors hold about 35% of construction value. Holder Construction states it has delivered more than 6.4 GW of data centers across the United States, and Jacobs states it has delivered or designed more than 5,000 MW for hyperscale and AI data centers over the past decade. Skanska booked a USD 1.2 billion contract for four data centers in the southeastern United States, totaling about 75,000 square meters, in its third-quarter 2026 order bookings. Quanta Services’ Cupertino Electric has installed electrical systems in more than 20 million square feet of data centers, Exyte is delivering three AI data center projects near Frankfurt, Kirby Group Engineering provides mechanical, electrical and high- and medium-voltage contracting for data centers, and Larsen & Toubro is building a 10 MW data center in Tashkent, Uzbekistan.
Recent Developments
- In September 2025, OpenAI, Oracle and SoftBank announced five new Stargate data center sites in the United States, bringing planned capacity to nearly 7 GW (Source: OpenAI announcement).
- In November 2025, Turner Construction reported data center revenue of USD 6.4 billion in the first nine months of 2025, compared with USD 3.6 billion for all of 2024 (Source: Data Center Dynamics news report).
- In June 2026, Exyte secured three AI data center projects in the Greater Frankfurt region worth about EUR 750 million (Source: Exyte press release).
- In July 2026, Meta expanded its economic investment in the Hyperion campus in Louisiana to USD 50 billion for 5 GW of computing capacity (Source: Bisnow news report).
- In July 2026, EMCOR reported record remaining performance obligations of USD 17.14 billion, with growth including network and communications (Source: EMCOR earnings release).
- In September 2026, Cushman & Wakefield reported that data center construction costs had risen an average of 21% per MW since the fourth quarter of 2024 (Source: Cushman & Wakefield press release).
We follow these contracts, campus announcements and cost updates as they happen in our data center industry updates.
Methodology: How We Built the Data Center Construction Market Model
DC Market Insights built this market bottom-up from 16 annual cohorts (2020 to 2035) of construction work put in place, measured in GW-equivalent for 6 geographies (the United States, Canada, Europe, Asia Pacific, Latin America, and the Middle East and Africa), and priced each cohort with a contractor value per MW for that geography and year: 96 volume inputs and 96 price inputs in all. The 2025 volumes were set from the capacity under construction at the end of September 2025 and an average build period of about 2.4 years. The total was split by 4 construction types, 5 data center types, 3 tier levels, 3 project types and 3 facility size bands, and every split sums to the market total. The result was checked top-down against US Census Bureau construction spending on data centers, which the US model matches within 2% for 2025 and within 1% for growth since 2020, and against the backlog and revenue disclosures of 4 listed contractors.
Table of contents
- 01Introduction
- 1.1Market Definition and Scope
- 1.2Construction Types, Owners and Regions Covered
- 1.3Currency, Base Year and Forecast Period
- 1.4Key Questions Answered
- 02Research Methodology
- 2.1Construction Value per MW Model
- 2.2Work Put in Place Cohorts by Geography
- 2.3Contractor Value per MW by Geography
- 2.4Top-Down Check Against US Census Bureau Data and Contractor Disclosures
- 2.5Assumptions and Limitations
- 03Executive Summary
- 3.1Market at a Glance, 2020-2035
- 3.2Key Findings
- 3.3Analyst Recommendations by Stakeholder
- 04Market Dynamics
- 4.1Drivers
- 4.2Challenges and Restraints
- 4.3Opportunities
- 4.4Trends
- 4.5Impact Analysis of Drivers and Challenges, 2025-2035
- 05Pricing and Cost Analysis
- 5.1Contractor Value per MW by Region, 2020-2035
- 5.2Construction Cost Inflation, 2024-2026
- 5.3AI Data Center Cost Premium
- 5.4Labor and Land Cost Trends
- 06Standards and Regulation
- 6.1ANSI/TIA-942-C
- 6.2Uptime Institute Tier Classification
- 6.3EU Delegated Regulation 2024/1364
- 07Supply Chain and Value Chain Analysis
- 7.1Owners and Developers
- 7.2General Contractors and Design-Build Firms
- 7.3Electrical and Mechanical Specialty Contractors
- 7.4Owner-Furnished Equipment and Long-Lead Procurement
- 08Global Data Center Construction Market Size and Forecast
- 8.1Market Size, 2020-2024
- 8.2Market Size, 2025
- 8.3Market Forecast, 2026-2035
- 8.4Work Put in Place, GW-Equivalent, 2020-2035
- 09Market by Construction Type
- 9.1Electrical Construction
- 9.2Mechanical Construction
- 9.3General Construction
- 9.4Site and Civil Works
- 10Market by Data Center Type
- 10.1Hyperscale Data Centers
- 10.2Colocation Data Centers
- 10.3Enterprise Data Centers
- 10.4GPU and Neocloud Providers
- 10.5Edge and Modular Data Centers
- 11Market by Tier Standard
- 11.1Tier I and II
- 11.2Tier III
- 11.3Tier IV
- 12Market by Project Type
- 12.1Greenfield New Build
- 12.2Brownfield Expansion
- 12.3Retrofit and Renovation
- 13Market by Facility Size
- 13.1Under 20 MW
- 13.220 to 100 MW
- 13.3Over 100 MW
- 14DC Exclusive: Construction Type × Data Center Type Matrix
- 14.1Construction Type × Data Center Type Matrix, 2025
- 14.2Trade Mix by Owner Type
- 14.3Implications for Contractors
- 15Market by Region
- 15.1North America (United States, Canada)
- 15.2Europe (United Kingdom, Germany, France, Netherlands, Ireland, Rest of Europe)
- 15.3Asia Pacific (China, Japan, India, Australia, Malaysia, Rest of Asia Pacific)
- 15.4Latin America (Brazil, Rest of Latin America)
- 15.5Middle East and Africa (Saudi Arabia, Rest of Middle East and Africa)
- 15.6Top 12 Countries, 2025 and 2035
- 16Regional Cross-Sections
- 16.1Region × Contractor Value per MW, 2020-2035
- 16.2Region × Work Put in Place, 2020-2035
- 17Forecast Scenarios
- 17.1Base, Low and High Cases to 2035
- 17.2Sensitivity to Work Put in Place
- 17.3Sensitivity to Contractor Value per MW
- 18Competitive Landscape
- 18.1Share of Leading General Contractors, 2025
- 18.2Specialty Contractor Backlogs and Revenue Trends
- 18.3Major Contracts and Campus Announcements, 2025-2026
- 19Company Profiles
- 19.1Turner Construction
- 19.2Holder Construction
- 19.3DPR Construction
- 19.4Clayco
- 19.5HITT Contracting
- 19.6Hensel Phelps
- 19.7Skanska
- 19.8AECOM
- 19.9Jacobs
- 19.10EMCOR
- 19.11Comfort Systems USA
- 19.12Quanta Services
- 19.13Sterling Infrastructure
- 19.14Exyte
- 19.15Mercury Engineering
- 19.16Kirby Group Engineering
- 19.17Larsen & Toubro
- 20Analyst Recommendations
- 20.1For General Contractors
- 20.2For Electrical and Mechanical Specialty Contractors
- 20.3For Data Center Owners and Developers
- 20.4For Investors
- Fig. 1Data Center Construction Market Size, 2020-2035
- Fig. 2Work Put in Place, GW-Equivalent, 2020-2035
- Fig. 3Contractor Value per MW by Region, 2020-2035
- Fig. 4Market Share by Construction Type, 2025 and 2035
- Fig. 5Market Share by Data Center Type, 2025 and 2035
- Fig. 6Construction Type × Data Center Type Matrix, 2025
- Fig. 7Market by Region, 2025 and 2035
- Fig. 8Top 12 Countries, 2025
- Fig. 9Forecast Scenarios, 2035
- Table 1Report Attributes
- Table 2Contractor Value per MW by Region, 2020-2035
- Table 3Market by Construction Type, 2025 and 2035
- Table 4Market by Data Center Type, 2025 and 2035
- Table 5Market by Tier Standard, 2025 and 2035
- Table 6Market by Project Type, 2025 and 2035
- Table 7Market by Facility Size, 2025 and 2035
- Table 8Construction Type × Data Center Type Matrix, 2025
- Table 9Market by Region, 2020-2035
- Table 10Top 12 Countries, 2025 and 2035
- Table 11Forecast Scenarios, 2035
- Table 12Major Contracts and Campus Announcements, 2025-2026
About this report
Written by Satyabrat Rajawat and reviewed by Deepti Agrawal, Senior Editor, Research. Figures are built top-down and bottom-up and reconciled before publication, with 2025 as the base year.
Read our methodologyHow we built this
- Historical period2020-2024
- Base year2025
- Forecast period2026-2035
- Sizing approachTop-down + bottom-up
Need more than the report?
Advisory on this market
Due diligence, site selection and market entry work, by the analysts who wrote this report.
See consulting servicesFrequently asked questions
USD 65.60 billion in 2025, rising to USD 219.14 billion by 2035. DC Market Insights estimates the market at USD 19.19 billion in 2020.
12.82% a year from 2025 to 2035. Growth was faster, at 27.87% a year, between 2020 and 2025 as hyperscale and AI campuses moved into full construction.
Electrical construction, with USD 27.29 billion or 41.6% of the market in 2025. Mechanical construction grows fastest at 13.74% a year as liquid cooling adds piping and cooling plant to each hall.
About USD 6.70 million per MW worldwide and USD 6.55 million per MW in the United States in 2025, according to DC Market Insights estimates of contractor value that exclude land, IT equipment, owner-furnished equipment and design fees.
North America, with USD 43.74 billion or 66.7% of 2025 value. The Middle East and Africa grows fastest at 17.48% a year.
Hyperscale data centers, with USD 33.91 billion or 51.7% of 2025 value. GPU and neocloud providers grow fastest at 17.30% a year, reaching USD 27.83 billion by 2035.
Turner Construction holds about 13% of the market in 2025 (DC Market Insights estimate). Holder Construction, DPR Construction, Clayco, HITT Contracting, Hensel Phelps, Skanska, AECOM, Jacobs, EMCOR, Comfort Systems USA, Quanta Services, Sterling Infrastructure, Exyte, Mercury Engineering, Kirby Group Engineering and Larsen & Toubro also compete.
USD 41.62 billion in the United States, or 63.5% of 2025 value, followed by China at USD 2.78 billion. India grows fastest among large country markets at 17.99% a year (DC Market Insights estimate).
Licences, delivery and payment
Which licence should I choose?
Single User is a view-only PDF for one person. Multi User adds a printable PDF and the Excel data for unlimited users at one location. Enterprise covers your whole company and includes 100 free analyst hours.
How and when will I receive the report?
By email, within 24–48 business hours of payment, in the formats of your licence.
How can I pay?
Securely through PayPal: with a PayPal account, a debit or credit card, or PayPal Pay Later where available. Prices are in US dollars.
Can I see a sample first?
Yes. Request a free sample and we will email it to you.
Can the report be tailored to my needs?
Yes. We can add countries, segments or data cuts. Talk to an analyst about the scope you need.
Can I get an invoice or pay against a purchase order?
Write to sales@dcmarketinsights.com and our team will help.