
Data Center Liquid Cooling Market Size, Share & Forecast to 2035
Market at a glance
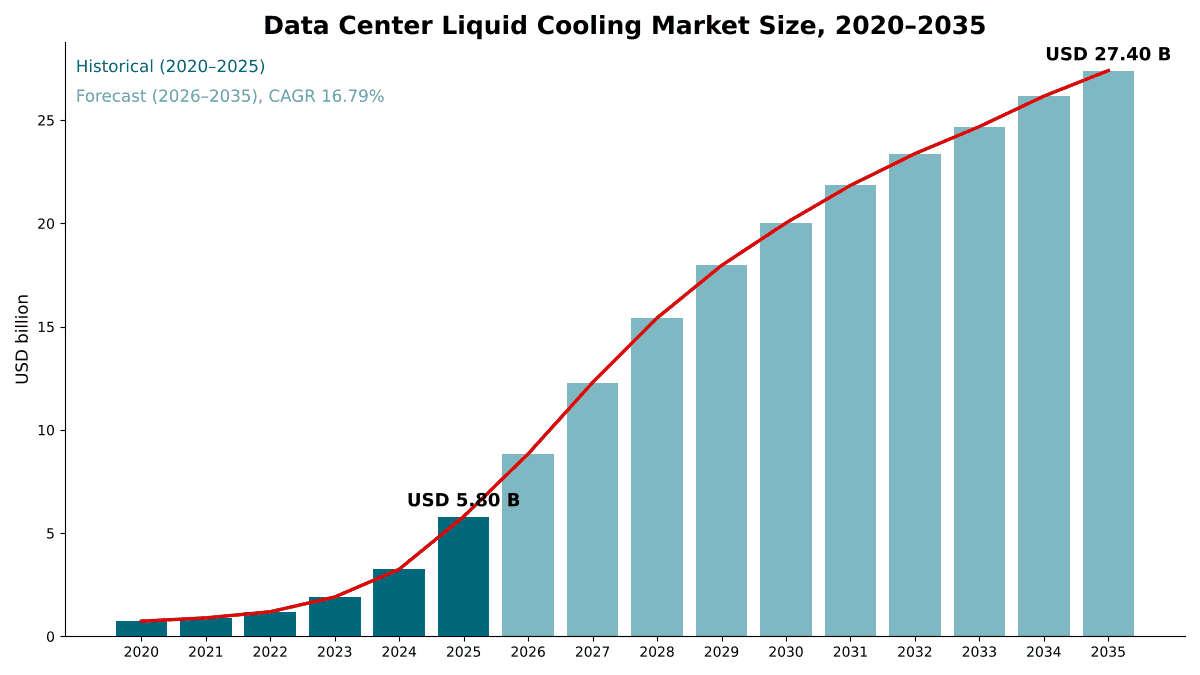
The Data Center Liquid Cooling market was worth USD 5,800.0 million in 2025 and is forecast to reach USD 27.40 billion by 2035, growing at a 16.79% CAGR. North America accounts for 44.8% of the market.
 By Satyabrat Rajawat, Senior Research Analyst, Strategic Advisory
 Reviewed by Deepti Agrawal
Last updated 6 Oct 2026
Base year 2025 PDF + Excel
Reviewed by Deepti Agrawal
Last updated 6 Oct 2026
Base year 2025 PDF + Excel
Source: DC Market Insights analysis
Key findings
Rack-Scale AI Systems Lift Liquid Cooling Spend to USD 1.58 Million per MW
Microfluidic Cooling Moves Coolant Into the Chip Package
More Than 80% of Operators Still Run No Racks Above 30 kW
Services Grow to USD 5.95 Billion by 2035
What is inside the report
- 01Introduction
- 02Research Methodology
- 03Executive Summary
- 04Market Dynamics
- 05Pricing and Cost Analysis
- 06Standards and Regulation
- 07Supply Chain and Value Chain Analysis
- 08Global Data Center Liquid Cooling Market Size and Forecast
- 09Market by Technology
- 10Market by Component
- 20chapters
- 2020-2024Historical period
- 2026-2035Forecast period
- 16Companies profiled
Regional insights
- North America44.8%
- Asia Pacific27.1%
- Europe19.2%
- Latin America4.4%
- Middle East and Africa4.5%
Segmentation
Companies profiled
- Vertiv
- Eaton (Boyd Thermal)
- Schneider Electric (Motivair)
- CoolIT Systems (Ecolab)
- nVent
- Trane Technologies (LiquidStack)
- Daikin Applied (Chilldyne)
- Delta Electronics
- Asia Vital Components (AVC)
- Auras Technology
- Supermicro
- Submer
- Iceotope
- Accelsius
- Green Revolution Cooling (GRC)
- Corintis
Recent developments
Schneider Electric completed its acquisition of a 75% controlling interest in Motivair, with the remaining 25% expected in 2028 (Source: Schneider Electric announcement).
Eaton agreed to acquire Boyd Thermal for USD 9.5 billion; Boyd Thermal forecast 2026 sales of USD 1.7 billion, of which USD 1.5 billion is liquid cooling (Source: Data Center Dynamics news report).
Vertiv completed its acquisition of PurgeRite, a provider of fluid management services for liquid cooling (Source: Vertiv press release).
Trane Technologies completed its acquisition of liquid cooling specialist LiquidStack (Source: Trane Technologies press release).
Ecolab completed its USD 4.75 billion acquisition of CoolIT Systems (Source: Ecolab quarterly filing).
Vertiv agreed to acquire King Environmental Services, an Irish fluid management firm, on undisclosed terms (Source: Data Center Dynamics news report).
Full analysis
The Data Center Liquid Cooling Market covers the equipment, fluids and services that remove heat from servers with liquid rather than air: direct-to-chip cold plates, coolant distribution units (CDUs), in-rack manifolds, rear-door heat exchangers, immersion tanks, coolants, and the installation and fluid management work that keeps them running. DC Market Insights values the global Data Center Liquid Cooling Market at USD 5.80 billion in 2025 and forecasts USD 27.40 billion by 2035, a CAGR of 16.79%. The 2025 value is built from the build itself: about 2.94 GW of new liquid-cooled AI capacity at roughly USD 1.58 million of liquid cooling equipment per MW gives USD 4.65 billion, about 0.98 GW of liquid-cooled conventional and high performance computing (HPC) capacity at USD 0.55 million per MW adds USD 538.20 million, and services and fluids on an installed liquid-cooled base of about 15.9 GW add USD 619.61 million. Two-phase cooling is the fastest-growing technology at 23.42% a year because it removes more heat per liter of flow as chip power rises, and the Middle East and Africa is the fastest-growing region at 19.79% a year as Saudi Arabia and the United Arab Emirates, modeled at 20.58% and 20.22% a year, build out AI capacity from a small base.
Executive Summary
The Global Data Center Liquid Cooling Market size was valued at USD 736.26 million in 2020, reached USD 5.80 billion in 2025, and is anticipated to reach USD 27.40 billion by 2035, at a CAGR of 16.79% during the forecast period.
| Report attribute | Details |
|---|---|
| Historical Period | 2020-2024 |
| Base Year | 2025 |
| Forecast Period | 2026-2035 |
| Data Center Liquid Cooling Market Size 2025 | USD 5.80 Billion |
| Data Center Liquid Cooling Market, CAGR | 16.79% |
| Data Center Liquid Cooling Market Size 2035 | USD 27.40 Billion |
The market grew at 51.12% a year between 2020 and 2025, and 2025 alone added 78.4% over 2024 as liquid-cooled rack-scale graphics processing unit (GPU) systems such as NVIDIA’s GB200 NVL72 moved into volume deployment. In the DC Market Insights model, liquid cooling was mainly a supercomputer, mainframe and rear-door retrofit business in 2020, and by 2025 70% of new AI hall capacity was built for liquid. Growth slows to 16.79% a year from 2025 to 2035 because liquid becomes the default for AI halls by 2030 (94% of new AI capacity), after which the market grows with capacity additions, falling cost per MW and a services business on an installed base that DC Market Insights expects to reach about 156 GW by 2035.
Market Scope: What Does the Data Center Liquid Cooling Market Cover?
The Data Center Liquid Cooling Market covers every product and service that carries heat away from IT equipment in a liquid loop inside the data hall, valued at first sale in current US dollars, with 2025 as the base year and forecasts to 2035. DC Market Insights sizes the market at USD 5.80 billion in 2025.
Included. Direct-to-chip cold plates and the in-rack hardware that feeds them (manifolds, hoses and quick disconnects), coolant distribution units of every type (in-rack, in-row and liquid-to-air sidecar units), rear-door heat exchangers, single-phase and two-phase immersion tanks, two-phase direct-to-chip evaporators, water-glycol and dielectric coolants, and services: design, installation, commissioning, flushing, filtration, fluid testing and maintenance of the technology cooling loop.
Excluded. Facility heat rejection outside the white space (chillers, cooling towers and dry coolers), computer room air handlers and other air cooling equipment, the servers and GPUs themselves, building pipework upstream of the CDU, and crypto-mining immersion farms that are not part of a data center operator’s estate. Facility-side cooling is covered in our Data Center Thermal Management Market report.
How the segments fit together. The technology, component, heat rejection, end-user and rack density splits each re-cut the same USD 5.80 billion. Rear-door heat exchangers sit inside both the technology split and the heat exchangers and tanks component, and liquid-to-air units are the CDUs and rear doors that reject heat into room air rather than a facility water loop.
Market Drivers: What Drives the Data Center Liquid Cooling Market?
AI racks lift liquid cooling spend to USD 1.58 million per MW in 2025. Three drivers explain most of the growth in the Data Center Liquid Cooling Market: AI racks that cannot be cooled by air, a doubling of data center electricity demand by 2030, and hyperscale operators that now deploy liquid cooling at scale for their own accelerators.
Rack-Scale AI Systems Lift Liquid Cooling Spend to USD 1.58 Million per MW
NVIDIA’s GB200 NVL72 connects 36 Grace CPUs and 72 Blackwell GPUs in a rack-scale, liquid-cooled design, and its GB300 NVL72 is a fully liquid-cooled rack-scale design that unifies 72 Blackwell Ultra GPUs. NVIDIA states that, compared with H100 air-cooled infrastructure, GB200 delivers 25 times more performance at the same power while reducing water consumption. DC Market Insights estimates the liquid cooling content of an AI hall at USD 1.58 million per MW in 2025, almost three times the USD 0.55 million per MW spent where liquid supplements air in conventional halls. NVIDIA plans full-scale production of 800 VDC data centers to coincide with its Kyber rack-scale systems in 2027, a step toward racks of 1 MW of IT load. The in-rack plumbing that links every cold plate to the CDU is sized in our Data Center Liquid Cooling Manifolds Market report.
Data Center Electricity Use Is Set to Double to About 945 TWh by 2030
The International Energy Agency (IEA) estimates that data centers used about 415 terawatt-hours (TWh) in 2024, around 1.5% of the world’s electricity, and expects consumption to more than double to around 945 TWh by 2030. In the United States, the Department of Energy reported that data centers used about 4.4% of total electricity in 2023 and could use 6.7% to 12% by 2028. DC Market Insights models liquid-cooled capacity added each year rising from 3.91 GW in 2025 to 13.78 GW in 2030 and 19.03 GW in 2035.
Hyperscalers Deploy Liquid Cooling at Gigawatt Scale
Google says it has deployed liquid cooling at gigawatt scale across more than 2,000 TPU Pods in the past seven years, with uptime of about 99.999%. Amazon Web Services (AWS) described Blackwell as the first liquid cooling hardware platform it has deployed at scale, cooled through its own In-Row Heat Exchanger (IRHX). Hyperscale data centers account for USD 2.74 billion, or 47.3%, of 2025 liquid cooling spending in the DC Market Insights model, and their share rises to 50.4% by 2035.
Market Trends: How Is Data Center Liquid Cooling Changing?
The Data Center Liquid Cooling Market is moving toward cooling inside the chip package, two-phase coolants and liquid-to-air units that let operators add liquid racks to air-cooled halls.
Microfluidic Cooling Moves Coolant Into the Chip Package
Microsoft reported in September 2025 that lab-scale tests of in-chip microfluidic cooling removed heat up to three times better than cold plates, depending on workload and configuration, and reduced the maximum temperature rise of the silicon inside a GPU by 65%. Swiss start-up Corintis raised USD 24 million in a Series A round to develop microfluidic cooling systems. DC Market Insights counts microfluidics inside the direct-to-chip segment, modeled at 17.77% annual growth.
Two-Phase Cooling Gains Investors as Chip Power Rises
Two-phase systems boil a low-pressure fluid at the chip and condense the vapor elsewhere, which carries more heat per unit of flow than single-phase water. Accelsius, a two-phase direct-to-chip supplier, counts Johnson Controls and Legrand among its investors. Two-phase cooling, across direct-to-chip and immersion, is worth USD 110.26 million in 2025 in the DC Market Insights model and is the fastest-growing technology at 23.42% a year.
Liquid-to-Air Units Bridge Air-Cooled Halls
Meta’s GB200-based Catalina design uses air-assisted liquid cooling sidecar racks to run 120 kW compute racks in 20 kW air-cooled halls, and AWS cools its Blackwell deployments through its own IRHX units. DC Market Insights estimates liquid-to-air units at USD 1.50 billion, or 25.8% of 2025 spending, but expects their share to fall to 13.1% by 2035 as new halls are designed with facility water loops from the start.
Market Challenges: What Holds the Data Center Liquid Cooling Market Back?
Low rack densities in most existing facilities and the phase-out of fluorinated fluids are the two constraints that DC Market Insights expects to slow the Data Center Liquid Cooling Market outside new AI halls.
More Than 80% of Operators Still Run No Racks Above 30 kW
The Uptime Institute’s 2025 survey found that the average of modal rack densities reached almost 9 kW, up slightly from 8.3 kW, and that more than 80% of operators have no racks above 30 kW. Uptime data reported by Data Center Dynamics show that 18% of operators currently use direct liquid cooling. Enterprise data centers therefore grow only 13.25% a year in the DC Market Insights model.
PFAS Exit Narrows the Choice of Two-Phase Fluids
3M has committed to exit per- and polyfluoroalkyl substance (PFAS) manufacturing and to discontinue the use of PFAS across its product portfolio. DC Market Insights estimates that the exit narrows the choice of fluorinated fluids used in some two-phase immersion systems, and expects single-phase immersion to keep 10.4% of the market in 2035 while two-phase immersion stays a small niche inside the two-phase cooling segment.
Market Opportunities: Where Are the New Revenue Pools?
Fluid management services, growing at 21.10% a year, are the largest new revenue pool. Racks above 150 kW are the second, growing at 38.75% a year in the DC Market Insights model.
Services Grow to USD 5.95 Billion by 2035
Every liquid loop needs flushing, filtration, fluid testing and leak response for its whole life. Vertiv agreed in November 2025 to buy PurgeRite, a fluid management services specialist, for about USD 1.0 billion in cash plus up to USD 250 million of additional consideration, and in September 2026 agreed to acquire King Environmental Services, an Irish fluid management firm. DC Market Insights estimates services at USD 876.25 million in 2025 and USD 5.95 billion in 2035, when they reach 21.7% of the market.
Racks Above 150 kW Reach 49.3% of Spending
Racks above 150 kW took 8.8% of liquid cooling spending in 2025 and are forecast to reach 49.3% by 2035, a CAGR of 38.75%. Pumps sized for these racks are covered in our Data Center Cooling CDU Pumps Market report. Heat reuse is a second opportunity: Germany requires new data centers to reuse a rising share of their energy, and DC Market Insights expects warm-water liquid loops to be the main source of that heat.
Pricing: How Much Does Data Center Liquid Cooling Cost per MW?
An AI hall spends about USD 1.58 million on liquid cooling per MW of IT load in 2025, and a conventional or HPC hall that adds liquid spends about USD 0.55 million per MW. These are DC Market Insights estimates covering cold plates, in-rack hardware, CDUs, rear doors, tanks and first fill of coolant, excluding facility heat rejection.
| Liquid cooling spend per MW (USD million) | 2020 | 2025 | 2030 | 2035 |
|---|---|---|---|---|
| AI hall, liquid-cooled | 1.35 | 1.58 | 1.36 | 1.17 |
| Conventional or HPC hall with liquid | 0.52 | 0.55 | 0.59 | 0.62 |
| Services and fluids per installed MW per year | 0.036 | 0.039 | 0.042 | 0.045 |
| Liquid-cooled share of new AI capacity | 40% | 70% | 94% | 97% |
AI hall spend per MW peaked in 2025 and falls about 3% a year as CDUs grow larger and rack density climbs faster than cold plate count: a denser rack shares one CDU and one set of facility connections across more compute.
Standards and Regulation: Which Rules Shape Data Center Liquid Cooling?
Four sets of rules shape data center liquid cooling: ASHRAE water temperature classes, Open Compute Project (OCP) hardware specifications, European energy reporting rules and national efficiency limits in Germany and Singapore.
ASHRAE liquid cooling classes. ASHRAE’s 2022 update moved to the facility water classes W17, W27, W32, W40, W45 and W+. Uptime reports that facility water temperatures in liquid-cooled systems are converging around 32°C.
Open Compute Project. Google said in April 2025 that it would contribute its fifth-generation Project Deschutes CDU design to OCP, which gives suppliers a common reference for high-capacity CDUs.
EU Energy Efficiency Directive. Article 12 requires data centers with an installed IT power demand of at least 500 kW to report their energy performance each year, and Commission Delegated Regulation (EU) 2024/1364 sets out the information and key performance indicators those operators must send to the European database.
Germany and Singapore. Germany’s Energy Efficiency Act (EnEfG) requires data centers that start operation from 1 July 2026 to reach a power usage effectiveness (PUE) of 1.2 or lower and to reuse at least 10% of their energy, rising to 15% for those starting from 1 July 2027 and 20% from 1 July 2028. Singapore’s Green Data Centre Roadmap aims for all data centers to operate at a PUE of 1.3 or lower. The Uptime Institute’s 2025 survey put the weighted average PUE at 1.54, so these limits favor liquid loops that cut fan and chiller energy.
Market Segmentation: Which Segment Leads the Data Center Liquid Cooling Market?
Direct-to-chip cooling leads the Data Center Liquid Cooling Market with 71.4% of 2025 value, hyperscale data centers lead buyers with 47.3%, and cold plates and in-rack hardware lead components with 34.6%. Two-phase cooling is the fastest-growing segment by technology at 23.42% a year, ahead of direct-to-chip at 17.77%, because rising chip power rewards fluids that absorb heat by boiling.
By Technology: Direct-to-Chip Cooling Leads with 71.4%
| Technology | 2025 (USD billion) | Share 2025 | 2035 (USD billion) | CAGR 2025-2035 |
|---|---|---|---|---|
| Direct-to-Chip Cooling | 4.14 | 71.4% | 21.26 | 17.77% |
| Rear-Door Heat Exchangers | 0.92 | 15.8% | 2.38 | 10.03% |
| Single-Phase Immersion Cooling | 0.63 | 10.9% | 2.85 | 16.24% |
| Two-Phase Cooling | 0.11 | 1.9% | 0.90 | 23.42% |
Direct-to-chip cooling gains 6.2 points of share by 2035 because NVIDIA’s rack-scale GB200 and GB300 systems are liquid-cooled at the chip. Rear-door heat exchangers lose share as they serve mainly lower-density enterprise and colocation rows.
By Component: Cold Plates and In-Rack Hardware Lead with 34.6%
| Component | 2025 (USD billion) | Share 2025 | 2035 (USD billion) | CAGR 2025-2035 |
|---|---|---|---|---|
| Cold Plates and In-Rack Hardware | 2.01 | 34.6% | 9.01 | 16.20% |
| Coolant Distribution Units | 1.58 | 27.3% | 7.23 | 16.40% |
| Heat Exchangers and Tanks | 1.00 | 17.2% | 3.37 | 12.94% |
| Services | 0.88 | 15.1% | 5.95 | 21.10% |
| Coolants and Fluids | 0.34 | 5.8% | 1.84 | 18.49% |
Coolant distribution units are worth USD 1.58 billion in 2025 and every direct-to-chip loop needs one. Services grow fastest because the installed base keeps growing after new builds slow.
By End-user: Hyperscale Data Centers Lead with 47.3%
| End-user | 2025 (USD billion) | Share 2025 | 2035 (USD billion) | CAGR 2025-2035 |
|---|---|---|---|---|
| Hyperscale Data Centers | 2.74 | 47.3% | 13.81 | 17.53% |
| Colocation Data Centers | 1.08 | 18.6% | 5.89 | 18.50% |
| GPU and Neocloud Providers | 0.82 | 14.2% | 4.19 | 17.67% |
| HPC and Research Centers | 0.59 | 10.1% | 1.53 | 10.10% |
| Enterprise Data Centers | 0.57 | 9.8% | 1.97 | 13.25% |
Colocation data centers grow fastest among buyers at 18.50% a year as operators build liquid-ready halls for AI tenants.
By Heat Rejection: Liquid-to-Liquid Systems Lead with 74.2%
Liquid-to-liquid systems, which pass heat from the technology cooling loop to a facility water loop, are worth USD 4.31 billion (74.2%) in 2025 and USD 23.81 billion by 2035, a CAGR of 18.65%. Liquid-to-air systems, which reject heat into room air through sidecar units or rear doors, are worth USD 1.50 billion (25.8%) and grow at 9.14% a year to USD 3.59 billion.
By Rack Density: Racks of 80 kW to 150 kW Lead with 52.6%
Racks of 80 kW to 150 kW account for USD 3.05 billion (52.6%) of 2025 spending. Racks of 30 kW to 80 kW hold 24.9%, racks below 30 kW hold 13.7%, and racks above 150 kW hold 8.8%. By 2035, racks above 150 kW reach USD 13.51 billion (49.3%) as 800 VDC power and denser GPU systems arrive, while racks below 30 kW grow only 7.71% a year.
DC Exclusive: The Liquid Cooling Spend per MW Model and Technology × Buyer Matrix
At USD 2.20 billion in 2025, hyperscale direct-to-chip cooling is the single largest cell of the matrix and 37.9% of all data center liquid cooling spending. The matrix below cross-tabulates what is bought and who buys it. It is a DC Market Insights model, not a shipment count: built from 53 inputs: 32 capacity cohorts (16 years of conventional and AI halls), 2 liquid penetration curves, 2 spend-per-MW curves, 1 services rate curve, 4 technology splits, 5 buyer splits, 5 regional splits and 2 supplier sales disclosures used as a cross-check.
| 2025, USD billion | Direct-to-Chip | Rear-Door | Single-Phase Immersion | Two-Phase | Total |
|---|---|---|---|---|---|
| Hyperscale Data Centers | 2.20 | 0.28 | 0.23 | 0.04 | 2.74 |
| Colocation Data Centers | 0.66 | 0.27 | 0.13 | 0.02 | 1.08 |
| GPU and Neocloud Providers | 0.68 | 0.04 | 0.09 | 0.02 | 0.82 |
| Enterprise Data Centers | 0.19 | 0.28 | 0.08 | 0.01 | 0.57 |
| HPC and Research Centers | 0.41 | 0.05 | 0.11 | 0.02 | 0.59 |
| Total | 4.14 | 0.92 | 0.63 | 0.11 | 5.80 |
GPU and neocloud providers spend 83% of their liquid cooling budget on direct-to-chip systems, the highest share of any buyer, while enterprise data centers still spend 50% on rear-door heat exchangers; a supplier strong in rear doors is selling into the slowest-growing technology. HPC and research centers carry the highest immersion share at 19%, a legacy of supercomputers built around tanks.
The liquid cooling spend per MW model behind these figures has three inputs that any reader can check: new capacity delivered each year (12.0 GW in 2025), the share built for AI (35% in 2025) and the share of AI capacity built for liquid (70% in 2025). Multiplying each liquid-cooled cohort by its spend per MW gives new-build spending; adding services on the installed base gives the market. The model and its assumptions are explained on our research methodology page.
Regional Insights: Which Region Leads the Data Center Liquid Cooling Market?
North America leads the Data Center Liquid Cooling Market with 44.8% of 2025 value. The Middle East and Africa is the fastest-growing region at 19.79% a year, because Saudi Arabia and the United Arab Emirates, which DC Market Insights models at 65.8% of the region’s 2035 spending, grow from a small base.
North America Leads with 44.8% Share
North American operators spent USD 2.60 billion on liquid cooling in 2025, and the region is forecast to reach USD 11.12 billion by 2035, a CAGR of 15.65%. Supplier capacity is expanding in the United States. In July 2026, nVent announced a 160,000 square foot liquid cooling plant in Blaine, Minnesota, its third data center liquid cooling capacity expansion in three years. North America loses 4.2 points of share by 2035 as Asia Pacific and the Gulf catch up.
Asia Pacific Holds 27.1% Share
Asia Pacific is worth USD 1.57 billion in 2025 and USD 8.33 billion by 2035, a CAGR of 18.14%. China is the largest market in the region at USD 621.19 million in 2025, and India grows fastest at 22.77% a year in the DC Market Insights country model.
Europe Holds 19.2% Share
Europe is worth USD 1.11 billion in 2025 and USD 4.90 billion by 2035, a CAGR of 15.97%. Germany’s PUE limit of 1.2 for new data centers and its energy reuse rules make warm-water liquid loops the easiest path to compliance for new halls, because DC Market Insights expects liquid loops to supply most of the reusable heat.
Latin America Holds 4.4% Share
Latin America is worth USD 255.33 million in 2025 and USD 1.45 billion by 2035, a CAGR of 18.98%, led by Brazil, Mexico and Chile.
Middle East and Africa Holds 4.5% Share
The Middle East and Africa is worth USD 261.14 million in 2025 and USD 1.59 billion by 2035, the fastest growth of any region at 19.79% a year. Saudi Arabia and the United Arab Emirates are the two largest country markets in the region, growing at 20.58% and 20.22% a year in the DC Market Insights model.
Country Analysis: Which Countries Spend the Most on Data Center Liquid Cooling?
The United States is the largest country market for data center liquid cooling at USD 2.32 billion in 2025, 40.0% of global value, followed by China at USD 621.19 million (10.7%) and Canada at USD 280.77 million (4.8%). The 12 largest countries account for 79.7% of 2025 spending.
| Rank | Country | Region | 2025 (USD billion) | Share 2025 | 2035 (USD billion) | CAGR 2025-2035 |
|---|---|---|---|---|---|---|
| 1 | United States | North America | 2.32 | 40.0% | 9.80 | 15.50% |
| 2 | China | Asia Pacific | 0.62 | 10.7% | 2.93 | 16.79% |
| 3 | Canada | North America | 0.28 | 4.8% | 1.32 | 16.77% |
| 4 | Germany | Europe | 0.22 | 3.8% | 0.98 | 16.15% |
| 5 | Japan | Asia Pacific | 0.22 | 3.7% | 0.99 | 16.40% |
| 6 | United Kingdom | Europe | 0.21 | 3.5% | 0.85 | 15.26% |
| 7 | India | Asia Pacific | 0.15 | 2.6% | 1.17 | 22.77% |
| 8 | France | Europe | 0.13 | 2.3% | 0.61 | 16.26% |
| 9 | Australia | Asia Pacific | 0.13 | 2.2% | 0.72 | 18.56% |
| 10 | Brazil | Latin America | 0.12 | 2.1% | 0.67 | 18.68% |
| 11 | South Korea | Asia Pacific | 0.12 | 2.0% | 0.58 | 17.49% |
| 12 | Singapore | Asia Pacific | 0.11 | 1.9% | 0.42 | 14.62% |
India is the fastest-growing large country market at 22.77% a year, as hyperscale and colocation operators add AI capacity from a small installed base. Outside the top 12, the Nordic countries together are worth USD 159.33 million in 2025 and grow 17.43% a year. The country figures are a DC Market Insights allocation of the regional totals, weighted by each country’s estimated share of installed and new AI data center capacity.
Forecast Scenarios: How Could the 2035 Forecast Change?
The Data Center Liquid Cooling Market reaches USD 27.40 billion by 2035 in the base case, with a range of USD 22.14 billion to USD 32.22 billion across the low and high scenarios.
| Scenario | Assumption from 2026 | 2035 (USD billion) | CAGR 2025-2035 |
|---|---|---|---|
| Low | Capacity additions 15% below base; liquid share of conventional halls held at 2025 level | 22.14 | 14.33% |
| Base | Additions rise to 27.0 GW a year; 97% of new AI capacity liquid-cooled by 2035 | 27.40 | 16.79% |
| High | Additions 15% above base; faster retrofit of colocation halls | 32.22 | 18.70% |
The low case is what a two-year pause in AI capital spending looks like: completions slip and fewer conventional halls add liquid.
Competitive Insights: Who Leads the Data Center Liquid Cooling Market?
- Vertiv
- Eaton (Boyd Thermal)
- Schneider Electric (Motivair)
- CoolIT Systems (Ecolab)
- nVent
- Trane Technologies (LiquidStack)
- Daikin Applied (Chilldyne)
- Delta Electronics
- Asia Vital Components (AVC)
- Auras Technology
- Supermicro
- Submer
- Iceotope
- Accelsius
- Green Revolution Cooling (GRC)
- Corintis
DC Market Insights estimates that the three largest suppliers, Boyd Thermal (now part of Eaton), Vertiv and CoolIT Systems (now part of Ecolab), together hold about 38% of the Data Center Liquid Cooling Market in 2026, with Vertiv’s share a DC Market Insights estimate because Vertiv does not report liquid cooling sales separately. The basis is two supplier disclosures: Boyd Thermal forecast 2026 sales of USD 1.7 billion, of which USD 1.5 billion is liquid cooling, equal to about 17.0% of the USD 8.84 billion DC Market Insights 2026 estimate, and CoolIT is expected to generate about USD 550 million of sales over the 12 months after March 2026, about 6.2%. Eaton closed the Boyd Thermal purchase on 12 March 2026 for USD 9.55 billion net of cash acquired, and Ecolab completed its USD 4.75 billion purchase of CoolIT on 2 July 2026 (Source: Ecolab quarterly report filed with the US Securities and Exchange Commission). nVent reported second-quarter 2026 sales of USD 1.5 billion, up 53%, with significant data center growth.
Recent Developments
- In February 2025, Schneider Electric completed its acquisition of a 75% controlling interest in Motivair, with the remaining 25% expected in 2028 (Source: Schneider Electric announcement).
- In November 2025, Eaton agreed to acquire Boyd Thermal for USD 9.5 billion; Boyd Thermal forecast 2026 sales of USD 1.7 billion, of which USD 1.5 billion is liquid cooling (Source: Data Center Dynamics news report).
- In December 2025, Vertiv completed its acquisition of PurgeRite, a provider of fluid management services for liquid cooling (Source: Vertiv press release).
- In March 2026, Trane Technologies completed its acquisition of liquid cooling specialist LiquidStack (Source: Trane Technologies press release).
- In July 2026, Ecolab completed its USD 4.75 billion acquisition of CoolIT Systems (Source: Ecolab quarterly filing).
- In September 2026, Vertiv agreed to acquire King Environmental Services, an Irish fluid management firm, on undisclosed terms (Source: Data Center Dynamics news report).
We follow these deals, launches and capacity announcements as they happen in our data center industry updates.
Methodology: How We Built the Data Center Liquid Cooling Market Model
DC Market Insights built this market bottom-up from 16 annual capacity cohorts (2020 to 2035), each split into conventional and AI halls. Each cohort was multiplied by the share built for liquid (40% of AI capacity in 2020, 70% in 2025 and 97% in 2035; 11.0% to 19.0% of conventional capacity) and by a liquid cooling spend per MW (USD 1.35 million to USD 1.58 million for AI halls before falling 3% a year; USD 0.52 million rising 1.2% a year for conventional halls). Services and fluids were added on the installed liquid-cooled base, which starts at about 9.5 GW of HPC, mainframe and rear-door capacity at the end of 2019, at USD 0.036 million per MW per year in 2020 rising to USD 0.045 million in 2035. The total was split by 4 technologies, 5 components, 2 heat rejection types, 5 buyer types, 4 rack density bands and 5 regions, and every split sums to the market total. The result was checked top-down against the disclosed liquid cooling sales of Boyd Thermal and CoolIT. Country values allocate each regional total by country weights for installed and new AI capacity. The analyst named on this page built the model, and the reviewer checked the arithmetic, the sources and the dates before publication.
Table of contents
- 01Introduction
- 1.1Market Definition and Scope
- 1.2Technologies, Components, Buyers and Regions Covered
- 1.3Currency, Base Year and Forecast Period
- 1.4Key Questions Answered
- 02Research Methodology
- 2.1Liquid Cooling Spend per MW Model
- 2.2Capacity Cohorts: Conventional and AI Halls
- 2.3Liquid Penetration Curves
- 2.4Services and Fluids on the Installed Base
- 2.5Top-Down Check Against Supplier Disclosures
- 2.6Assumptions and Limitations
- 03Executive Summary
- 3.1Market at a Glance, 2020-2035
- 3.2Key Findings
- 3.3Analyst Recommendations by Buyer Type
- 04Market Dynamics
- 4.1Drivers
- 4.2Challenges and Restraints
- 4.3Opportunities
- 4.4Trends
- 4.5Impact Analysis of Drivers and Challenges, 2025-2035
- 05Pricing and Cost Analysis
- 5.1Liquid Cooling Spend per MW: AI vs Conventional Halls, 2020-2035
- 5.2Services and Fluids Spend per Installed MW, 2020-2035
- 5.3Liquid-Cooled Share of New AI Capacity, 2020-2035
- 5.4Price Outlook by Technology, 2026-2030
- 06Standards and Regulation
- 6.1ASHRAE Liquid Cooling Classes (W17 to W+)
- 6.2Open Compute Project Cooling Specifications
- 6.3EU Energy Efficiency Directive and Delegated Regulation (EU) 2024/1364
- 6.4Germany Energy Efficiency Act (EnEfG)
- 6.5Singapore Green Data Centre Roadmap
- 6.6PFAS and Coolant Regulation
- 07Supply Chain and Value Chain Analysis
- 7.1Cold Plates and Server Integration
- 7.2CDU and Heat Exchanger Manufacturing
- 7.3Coolants and Fluid Management
- 7.4Installation, Commissioning and Service Providers
- 08Global Data Center Liquid Cooling Market Size and Forecast
- 8.1Market Size, 2020-2024
- 8.2Market Size, 2025
- 8.3Market Forecast, 2026-2035
- 8.4New-Build vs Services Spending
- 09Market by Technology
- 9.1Direct-to-Chip Cooling
- 9.2Rear-Door Heat Exchangers
- 9.3Single-Phase Immersion Cooling
- 9.4Two-Phase Cooling
- 10Market by Component
- 10.1Cold Plates and In-Rack Hardware
- 10.2Coolant Distribution Units
- 10.3Heat Exchangers and Tanks
- 10.4Coolants and Fluids
- 10.5Services
- 11Market by Heat Rejection
- 11.1Liquid-to-Liquid
- 11.2Liquid-to-Air
- 12Market by End-user
- 12.1Hyperscale Data Centers
- 12.2Colocation Data Centers
- 12.3GPU and Neocloud Providers
- 12.4HPC and Research Centers
- 12.5Enterprise Data Centers
- 13Market by Rack Density
- 13.1Below 30 kW
- 13.230 kW to 80 kW
- 13.380 kW to 150 kW
- 13.4Above 150 kW
- 14DC Exclusive: Technology × Buyer Matrix
- 14.1Technology × End-user Matrix, 2025
- 14.2Liquid Cooling Spend per MW Model Inputs
- 14.3Implications for Suppliers
- 15Market by Region
- 15.1North America (United States, Canada)
- 15.2Europe (Germany, United Kingdom, France, Netherlands, Ireland, Nordics, Rest of Europe)
- 15.3Asia Pacific (China, Japan, India, Australia, South Korea, Singapore, Malaysia, Rest of Asia Pacific)
- 15.4Latin America (Brazil, Mexico, Chile, Rest of Latin America)
- 15.5Middle East and Africa (Saudi Arabia, United Arab Emirates, Israel, South Africa, Rest of Middle East and Africa)
- 15.6Top 12 Countries, 2025 and 2035
- 16Regional Cross-Sections
- 16.1Region × Technology, 2025 and 2035
- 16.2Region × End-user, 2025 and 2035
- 17Forecast Scenarios
- 17.1Base, Low and High Cases to 2035
- 17.2Sensitivity to Capacity Additions
- 17.3Sensitivity to Liquid Penetration of Conventional Halls
- 17.4Microfluidic Cooling and the Cold Plate Boundary
- 18Competitive Landscape
- 18.1Top-Three Supplier Concentration, 2025
- 18.2Mergers, Acquisitions and Funding, 2025-2026
- 18.3Capacity Expansions
- 19Company Profiles
- 19.1Vertiv
- 19.2Eaton (Boyd Thermal)
- 19.3Schneider Electric (Motivair)
- 19.4CoolIT Systems (Ecolab)
- 19.5nVent
- 19.6Trane Technologies (LiquidStack)
- 19.7Daikin Applied (Chilldyne)
- 19.8Delta Electronics
- 19.9Asia Vital Components (AVC)
- 19.10Auras Technology
- 19.11Supermicro
- 19.12Submer
- 19.13Iceotope
- 19.14Accelsius
- 19.15Green Revolution Cooling (GRC)
- 19.16Corintis
- 20Analyst Recommendations
- 20.1For Liquid Cooling Suppliers
- 20.2For Hyperscale and Colocation Operators
- 20.3For Investors
- Fig. 1Data Center Liquid Cooling Market Size, 2020-2035
- Fig. 2Liquid-Cooled Capacity Added per Year, AI vs Conventional, 2020-2035
- Fig. 3Liquid Cooling Spend per MW, 2020-2035
- Fig. 4New-Build vs Services Spending, 2020-2035
- Fig. 5Market Share by Technology, 2025 and 2035
- Fig. 6Market Share by End-user, 2025 and 2035
- Fig. 7Technology × End-user Matrix, 2025
- Fig. 8Market by Region, 2025 and 2035
- Fig. 9Forecast Scenarios, 2025-2035
- Fig. 10Top 12 Countries, 2025
- Table 1Report Attributes
- Table 2Liquid Cooling Spend per MW, 2020-2035
- Table 3Market by Technology, 2025 and 2035
- Table 4Market by Component, 2025 and 2035
- Table 5Market by Heat Rejection, 2025 and 2035
- Table 6Market by End-user, 2025 and 2035
- Table 7Market by Rack Density, 2025 and 2035
- Table 8Technology × End-user Matrix, 2025
- Table 9Market by Region and Country, 2025 and 2035
- Table 10Forecast Scenarios, 2035
- Table 11Mergers, Acquisitions and Funding, 2025-2026
- Table 12Company Profiles: Products and Data Center Focus
- Table 13Top 12 Countries, 2025 and 2035
About this report
Written by Satyabrat Rajawat and reviewed by Deepti Agrawal, Senior Editor, Research. Figures are built top-down and bottom-up and reconciled before publication, with 2025 as the base year.
Read our methodologyHow we built this
- Historical period2020-2024
- Base year2025
- Forecast period2026-2035
- Sizing approachTop-down + bottom-up
Need more than the report?
Advisory on this market
Due diligence, site selection and market entry work, by the analysts who wrote this report.
See consulting servicesFrequently asked questions
USD 5.80 billion in 2025, rising to USD 27.40 billion by 2035. DC Market Insights estimates the market at USD 736.26 million in 2020.
16.79% a year from 2025 to 2035. Growth was faster, at 51.12% a year, between 2020 and 2025 as liquid-cooled rack-scale GPU systems moved into volume deployment.
Direct-to-chip cooling, with USD 4.14 billion or 71.4% of the market in 2025. Two-phase cooling is the fastest-growing technology at 23.42% a year.
USD 1.58 billion, or 27.3% of 2025 spending, according to DC Market Insights estimates. CDU spending grows at 16.40% a year to USD 7.23 billion by 2035.
About USD 1.58 million per MW for a liquid-cooled AI hall and USD 0.55 million per MW for a conventional or HPC hall in 2025, according to DC Market Insights estimates.
North America, with USD 2.60 billion or 44.8% of 2025 value. The Middle East and Africa grows fastest at 19.79% a year.
Boyd Thermal (Eaton), Vertiv and CoolIT Systems (Ecolab) together hold about 38% of the market in 2026 (DC Market Insights estimate). Schneider Electric, nVent, Trane Technologies, Daikin Applied, Submer, Iceotope and Accelsius also compete.
USD 2.32 billion in the United States, or 40.0% of 2025 spending, followed by China at USD 621.19 million. India grows fastest among large country markets at 22.77% a year (DC Market Insights estimate).
Licences, delivery and payment
Which licence should I choose?
Single User is a view-only PDF for one person. Multi User adds a printable PDF and the Excel data for unlimited users at one location. Enterprise covers your whole company and includes 100 free analyst hours.
How and when will I receive the report?
By email, within 24–48 business hours of payment, in the formats of your licence.
How can I pay?
Securely through PayPal: with a PayPal account, a debit or credit card, or PayPal Pay Later where available. Prices are in US dollars.
Can I see a sample first?
Yes. Request a free sample and we will email it to you.
Can the report be tailored to my needs?
Yes. We can add countries, segments or data cuts. Talk to an analyst about the scope you need.
Can I get an invoice or pay against a purchase order?
Write to sales@dcmarketinsights.com and our team will help.