
Submarine Power Cable Market Size, Share & Forecast to 2035
Market at a glance
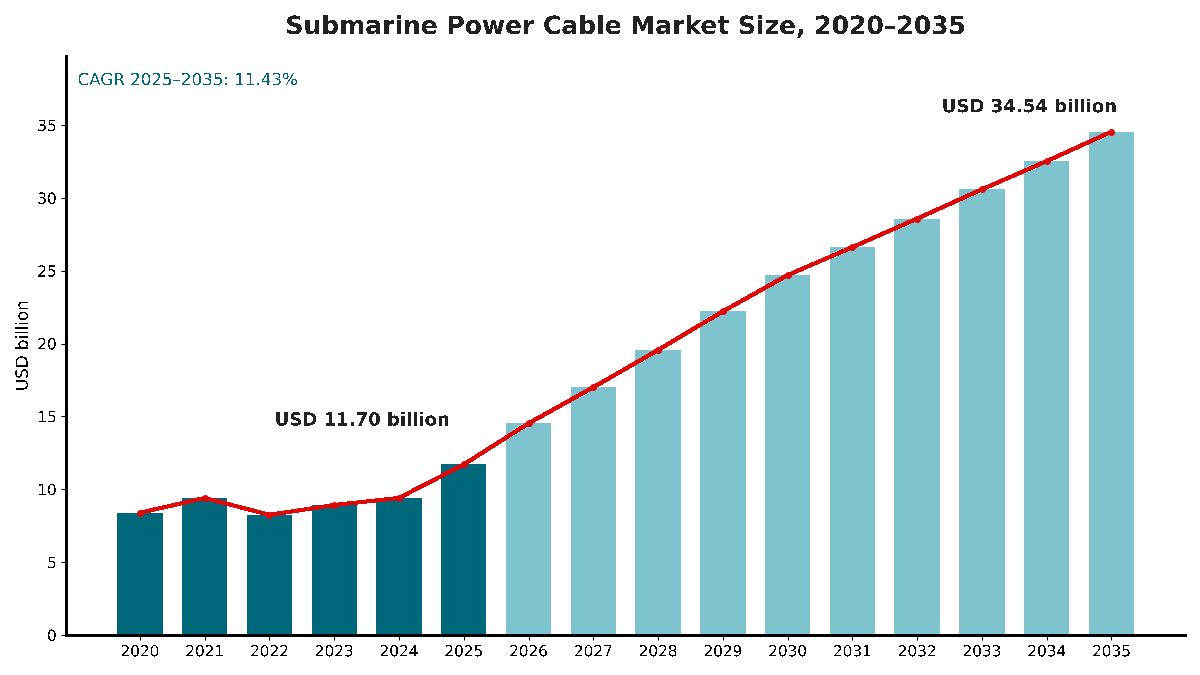
The Submarine Power Cable market was worth USD 11.70 billion in 2025 and is forecast to reach USD 34.54 billion by 2035, growing at a 11.43% CAGR. Europe accounts for 46.8% of the market.
 By Satyabrat Rajawat, Senior Research Analyst, Strategic Advisory
 Reviewed by Deepti Agrawal
Last updated 7 Oct 2026
Base year 2025 PDF + Excel
Reviewed by Deepti Agrawal
Last updated 7 Oct 2026
Base year 2025 PDF + Excel
Source: DC Market Insights analysis
Key findings
Offshore Wind Additions Rise from 9 GW in 2025 to 26 GW by 2030
525 kV HVDC Becomes the Standard for Long Links
US Policy Reversal Removes Near-Term Offshore Wind Demand
Offshore Wind Export Cables Reach USD 12.97 billion by 2035
What is inside the report
- 01Introduction
- 02Research Methodology
- 03Executive Summary
- 04Market Dynamics
- 05Pricing and Cost Analysis
- 06Standards and Regulation
- 07Supply Chain and Value Chain Analysis
- 08Global Submarine Power Cable Market Size and Forecast
- 09Market by Application
- 10Market by Current Type
- 21chapters
- 2020-2024Historical period
- 2026-2035Forecast period
- 11Companies profiled
Regional insights
- Europe46.8%
- Asia Pacific37.1%
- North America7.2%
- Middle East and Africa5.8%
- Latin America3.1%
Segmentation
Companies profiled
- Prysmian
- Nexans
- NKT
- Sumitomo Electric
- LS Cable & System
- Hellenic Cables
- Furukawa Electric
- Taihan
- ZTT
- JDR Cable Systems
- Van Oord
Recent developments
Nexans won the LanWin 2 project from TenneT, worth about EUR 1 billion, for 250 km of 525 kV HVDC export cable systems (Source: Nexans press release).
NKT signed a contract worth EUR 650 million with Energinet to deliver the HVDC power cable system linking Bornholm Energy Island to Zealand (Source: offshoreWIND.biz news report).
Prysmian signed the Eastern Green Link 4 contract, worth over EUR 2.3 billion, for a 2 GW HVDC link between Fife in Scotland and Norfolk in England (Source: Prysmian press release).
National Grid signed contracts worth nearly GBP 3 billion with Hitachi Energy and NKT for Eastern Green Link 3, a 690 km HVDC link with about 580 km offshore (Source: National Grid press release).
Greece's IPTO awarded Prysmian a EUR 910 million framework agreement for island interconnections with over 900 km of HVAC cable (Source: Baird Maritime news report).
SSEN Transmission signed a long-term framework agreement with Sumitomo Electric and Van Oord for HVDC cable projects, including 525 kV cable for the proposed Shetland 2 link (Source: TGS4C news report).
Full analysis
The Submarine Power Cable Market covers the high-voltage direct current (HVDC) and high-voltage alternating current (HVAC) power cables laid on or under the seabed, together with their joints, terminations and installation: offshore wind export and inter-array cables, interconnectors between countries and grid regions, island links and power-from-shore cables for offshore platforms. DC Market Insights values the global Submarine Power Cable Market at USD 11.70 billion in 2025 and forecasts USD 34.54 billion by 2035, a CAGR of 11.43%. The 2025 value is built from two volumes: about 11.5 GW of offshore wind capacity in execution at roughly USD 0.47 million of cable system spend per MW gives USD 5.38 billion, and about 1,560 route-km of interconnector and grid-link cable at roughly USD 3.05 million per route-km gives USD 4.75 billion; island links, power-from-shore and other uses add USD 1.57 billion. Offshore wind export cables are the fastest-growing segment at 14.36% a year because new wind farms sit further from shore and need longer, higher-voltage links, and Asia Pacific is the fastest-growing region at 12.77% a year as South Korea and Japan build new HVDC cable plants and China moves to 500 kV export cables.
Executive Summary
The Global Submarine Power Cable Market size was valued at USD 8.39 billion in 2020, reached USD 11.70 billion in 2025, and is anticipated to reach USD 34.54 billion by 2035, at a CAGR of 11.43% during the forecast period.
| Report attribute | Details |
|---|---|
| Historical Period | 2020-2024 |
| Base Year | 2025 |
| Forecast Period | 2026-2035 |
| Submarine Power Cable Market Size 2025 | USD 11.70 Billion |
| Submarine Power Cable Market, CAGR | 11.43% |
| Submarine Power Cable Market Size 2035 | USD 34.54 Billion |
The market grew at 6.89% a year between 2020 and 2025, but the path was uneven: spending peaked at USD 9.40 billion in 2021, a year in which DC Market Insights models an exceptional surge of Chinese offshore wind connections, fell to USD 8.25 billion in 2022, and then rose 24.4% in 2025 alone as European HVDC interconnectors and 525 kV offshore grid connections moved from contract award into manufacturing. DC Market Insights expects growth to accelerate to 11.43% a year from 2025 to 2035 because order books signed between 2023 and 2026 convert into revenue, and because offshore wind installations rise from 9 GW a year toward 36 GW a year by 2035 in the base case.
Data center operators buying offshore wind output add a new reason to build; firm low-carbon supply for data centers is covered in the Small Modular Reactor Market report.
Market Scope: What Does the Submarine Power Cable Market Cover?
The Submarine Power Cable Market covers submarine power cable systems sold to wind farm developers, transmission system operators (TSOs), utilities and offshore energy producers, valued at contract revenue in current US dollars, with 2025 as the base year and forecasts to 2035. DC Market Insights sizes it at USD 11.70 billion in 2025.
Included. Offshore wind export and inter-array cables, interconnectors and subsea HVDC grid links, island and coastal links, power-from-shore and dynamic cables for oil and gas platforms, and other subsea power uses such as underwater data centers, tidal energy and aquaculture. The value includes joints, terminations, monitoring and installation sold within the cable contract.
Excluded. Land cables beyond the landfall joint, HVDC converter stations, offshore substations, submarine telecommunications cables, and survey and repair work sold separately from a supply contract.
How the segments fit together. The application split is the driver of the model; the current-type, voltage, conductor, insulation and scope splits re-cut the same USD 11.70 billion by technology and by stage of the value chain. Inside-the-building cabling is covered in the Data Center Cables Market report.
Market Drivers: What Drives the Submarine Power Cable Market?
Three drivers explain most of the growth in the Submarine Power Cable Market: offshore wind installations that the Global Wind Energy Council (GWEC) expects to rise to 34 GW a year by 2030, a wave of HVDC interconnectors backed by European grid plans, and data center electricity demand that the International Energy Agency (IEA) expects to more than double by 2030.
Offshore Wind Additions Rise from 9 GW in 2025 to 26 GW by 2030
GWEC reported that 8 GW of new offshore wind capacity was grid-connected worldwide in 2024, bringing total installations to 83.2 GW, and that a record 56 GW of new capacity was awarded in government auctions that year. New installations rose 18% to 9 GW in 2025, according to GWEC data reported by Reuters. GWEC forecasts annual installations growing to 34 GW in 2030. DC Market Insights takes a more cautious base case of 26 GW in 2030 and 36 GW in 2035, which still lifts offshore wind cable spending from USD 5.38 billion in 2025 to USD 19.65 billion in 2035.
HVDC Interconnectors Add Hundreds of Route-Kilometers a Year
Europe plans far more cross-border capacity than it has today. The European Commission’s Action Plan for Grids put existing cross-border capacity at 93 GW, with 23 GW being added by 2025 and a further 64 GW needed by 2030, and estimated that EUR 584 billion of grid investment is needed this decade. The European Network of Transmission System Operators for Electricity (ENTSO-E) found that 108 GW of additional cross-border capacity would be beneficial by 2040. DC Market Insights models interconnector and grid-link cable rising from about 1,560 route-km in 2025 to about 3,250 route-km in 2035, worth USD 11.69 billion by 2035. Nexans reported a transmission backlog of EUR 7.7 billion at 30 June 2026 and describes it as subsea-driven (Source: Nexans half-year 2026 results).
Data Center Power Demand Pulls Offshore Wind into Grid Plans
The IEA estimates that data centers consumed about 415 terawatt-hours (TWh) in 2024, around 1.5% of world electricity consumption, and expects consumption to more than double to around 945 TWh by 2030. Data center operators already contract offshore wind output: Google signed power purchase agreements for 478 MW from two Dutch offshore wind farms to help its Dutch data centers and offices reach more than 90% carbon-free energy in 2024, and Amazon agreed to buy 159 MW from the East Anglia THREE offshore wind farm. Each contract depends on export cables to bring that power ashore.
Market Trends: How Is the Submarine Power Cable Market Changing?
The Submarine Power Cable Market is shifting to 525 kV HVDC links, to suppliers that own both factories and cable-laying vessels, and to aluminum conductors where cost matters more than cross-section.
525 kV HVDC Becomes the Standard for Long Links
The Eastern Green Link 1 project in the United Kingdom includes a GBP 750 million contract with Prysmian for what National Grid calls the UK’s first 525 kV HVDC transmission cable. TenneT’s 2 GW offshore grid program uses the same voltage: NKT’s contracts cover about 1,700 km of 525 kV HVDC cable, and Nexans won the LanWin 2 project for 250 km of 525 kV HVDC export cable systems. DC Market Insights estimates that HVDC rises from 39.4% of the Submarine Power Cable Market in 2025 to 46.6% in 2035, growing at 13.31% a year.
Suppliers Invest in Factories and Vessels Together
Suppliers are adding cable-laying vessels alongside new factories. NKT is investing about EUR 1.30 billion in a new cable-laying vessel and in what it calls the world’s largest high-voltage subsea cable factory, in Karlskrona, Sweden; its vessel NKT Eleonora will carry 23,000 tonnes of cable. Nexans put its third cable-laying vessel, Nexans Electra, into operation in the second quarter of 2026, and Prysmian contracted a third vessel worth about EUR 230 million with Fincantieri. Owning both lets a supplier sell a single engineering, procurement, construction and installation (EPCI) contract, as Nexans did for LanWin 2.
Aluminum Conductors Gain Ground as Copper Prices Rise
London Metal Exchange (LME) three-month copper touched a record USD 11,540 per tonne on 3 December 2025 before trading at USD 11,465, when aluminum traded at USD 2,897 per tonne. DC Market Insights expects designers to specify aluminum conductors more often where route length matters more than cable diameter, especially for inter-array and long HVDC links. DC Market Insights forecasts aluminum to grow from 28.8% of market value in 2025 to 35.7% in 2035, a CAGR of 13.85%.
Market Challenges: What Holds the Submarine Power Cable Market Back?
US offshore wind policy, cable failures and project delays are the three constraints that DC Market Insights expects to slow the Submarine Power Cable Market, and together they explain why the base case sits below industry installation forecasts.
US Policy Reversal Removes Near-Term Offshore Wind Demand
The US Bureau of Ocean Energy Management rescinded all designated Wind Energy Areas on the US Outer Continental Shelf in July 2025 (Source: Bureau of Ocean Energy Management notice). Projects already under construction were also stopped: Ørsted’s 704 MW Revolution Wind received a stop-work order in August 2025 when it was 80% complete, and Equinor’s Empire Wind was halted in April 2025 before the order was lifted in May 2025, after Equinor had invested about USD 2.70 billion. DC Market Insights therefore keeps North America at 7.2% of the market in 2025, rising only to 7.6% by 2035.
Cable Failures Drive Most Offshore Wind Insurance Losses
DNV reports that around 83% of offshore wind financial losses and insurance claims are attributed to power cable failures, with average combined losses of USD 1.20 million to USD 12.00 million per array cable failure and USD 10.00 million to USD 30.00 million per export cable failure.
Large Interconnectors Slip Beyond Their Original Dates
Long HVDC links carry political and financing risk. Completion of the Great Sea Interconnector, a 525 kV HVDC link between Greece and Cyprus, is now expected beyond its original late-2029 or early-2030 target. Delays move revenue to later years rather than removing it.
Market Opportunities: Where Are the New Revenue Pools?
The largest new revenue pools in the Submarine Power Cable Market are offshore wind export cables, growing at 14.36% a year, Asia Pacific supply chains and underwater data centers.
Offshore Wind Export Cables Reach USD 12.97 billion by 2035
Offshore wind export cables are worth USD 3.39 billion in 2025 and DC Market Insights forecasts USD 12.97 billion in 2035, when they overtake interconnectors as the largest application. TenneT’s offshore grid program uses 525 kV HVDC export systems, and Chinese projects are moving to 500 kV: ZTT won a contract for 94 km of 500 kV three-core HVAC submarine cable for the 500 MW Honghai Bay VI project.
Asia Pacific Cable Plants Open a Second Supply Base
New factories in Asia Pacific will add HVDC capacity outside Europe and China. Taihan approved about KRW 497.2 billion for its second submarine cable plant in Dangjin, South Korea, with nearly five times the capacity of its first plant. Furukawa Electric disclosed about JPY 100 billion of investment in 500 kV-class HVDC cable production in Futtsu, Japan.
Underwater Data Centers Create a Niche for Subsea Power
China’s HiCloud opened a 2.3 MW offshore wind-powered underwater data center demonstration off Shanghai and signed an agreement with partners to develop a 500 MW underwater data center. Other uses, including underwater data centers, tidal energy and aquaculture, are worth USD 138.70 million in 2025 and grow at 14.05% a year to USD 516.40 million by 2035, according to DC Market Insights estimates.
Pricing: How Much Does a Submarine Power Cable Cost per Kilometer?
Published HVDC cable contracts work out at about EUR 1.59 million to EUR 4.00 million per route-kilometer for euro contracts and GBP 3.13 million to GBP 3.83 million for UK contracts; DC Market Insights uses a blended USD 3.05 million per route-km for interconnector and grid-link cable in 2025, including installation.
| Project | Supplier | Cable contract | Route length | Contract value per route-km |
|---|---|---|---|---|
| Eastern Green Link 1 (UK) | Prysmian | GBP 750 million | 196 km | GBP 3.83 million |
| Eastern Green Link 4 (UK) | Prysmian | GBP 2.00 billion | about 640 km | GBP 3.13 million |
| LanWin 2 (Germany) | Nexans | about EUR 1.00 billion | 250 km (onshore and offshore) | EUR 4.00 million |
| Great Sea Interconnector (Greece-Cyprus) | Nexans | EUR 1.43 billion | about 900 km (bipole, 2 × 900 km of cable) | EUR 1.59 million |
The per-kilometer figures are DC Market Insights calculations from published contract values and route lengths. They vary because contract scopes differ: LanWin 2 includes onshore sections, and the Greece-Cyprus link has a long deep-water route. For offshore wind, DC Market Insights estimates USD 0.47 million per MW of cable system spend in 2025, rising to USD 0.53 million per MW by 2035.
Standards and Regulation: Which Rules Shape Submarine Power Cables?
Four sets of rules decide how submarine power cables are designed and tested: the International Electrotechnical Commission (IEC) cable standards, CIGRE test recommendations, the DNV offshore wind cable standard, and public rules that fund and permit the links.
IEC 63026. The IEC 63026:2019 standard covers submarine power cables with extruded insulation and their accessories for fixed installations at rated voltages from 6 kV up to 60 kV, in water depths up to 250 m. IEC 62067 covers extruded cable systems above 150 kV up to 500 kV for fixed installations, excluding submarine cables.
CIGRE Technical Brochure 490. CIGRE’s recommendations for testing long AC submarine cables with extruded insulation cover system voltages above 30 kV up to 500 kV.
DNV-ST-0359. DNV’s standard for subsea power cables in wind power plants covers inter-array and export cable systems, including components and interfaces, and its current edition dates from December 2025.
Public rules. In the United Kingdom, Ofgem’s cap-and-floor regime approved in principle three new interconnectors in its third application window, with 2.85 GW in total. In the European Union, the Net-Zero Industry Act sets a benchmark that 40% of the EU’s clean technology needs should be made in the EU by 2030, which supports local cable factories.
Market Segmentation: Which Segment Leads the Submarine Power Cable Market?
Interconnectors and grid links lead the Submarine Power Cable Market with 40.6% of 2025 value, HVAC cables lead by current type with 60.6%, and extra-high-voltage cables above 220 kV lead by voltage with 55.3%. Offshore wind export cables are the fastest-growing segment at 14.36% a year, against 9.41% for interconnectors, because new wind farms are larger and further from shore and each one needs its own export system.
By Application: Interconnectors and Grid Links Lead with 40.6%
| Application | 2025 (USD billion) | Share 2025 | 2035 (USD billion) | CAGR 2025-2035 |
|---|---|---|---|---|
| Offshore Wind Export Cables | 3.39 | 29.0% | 12.97 | 14.36% |
| Offshore Wind Inter-Array Cables | 1.99 | 17.0% | 6.68 | 12.87% |
| Interconnectors and Grid Links | 4.75 | 40.6% | 11.69 | 9.41% |
| Island and Coastal Power Links | 0.87 | 7.5% | 1.65 | 6.55% |
| Oil and Gas Power-from-Shore | 0.56 | 4.8% | 1.04 | 6.49% |
| Others | 0.14 | 1.2% | 0.52 | 14.05% |
Interconnectors grow steadily on European grid plans, but offshore wind export and inter-array cables together rise from 46.0% of the market in 2025 to 56.9% in 2035.
By Current Type: HVAC Leads with 60.6%
HVAC cables are worth USD 7.09 billion in 2025 and grow at 10.04% a year to USD 18.46 billion; they are used for every inter-array link and for export routes close to shore. HVDC grows faster, at 13.31% a year, and reaches 46.6% of value by 2035, because DC Market Insights expects most new routes longer than about 100 km to be built as HVDC links.
By Voltage: Extra-High Voltage Leads with 55.3%
Cables above 220 kV are worth USD 6.47 billion in 2025 and grow at 12.34% a year to 60.0% of value by 2035. Medium-voltage cables up to 66 kV, mostly inter-array, hold 22.8%, and high-voltage cables above 66 kV to 220 kV hold 21.9%.
By Conductor Material: Copper Leads with 71.2%
Copper conductors account for USD 8.33 billion (71.2%) in 2025 and grow at 10.30% a year. Aluminum conductors are worth USD 3.37 billion (28.8%) and grow faster, at 13.85% a year, as long HVDC and inter-array routes switch metal to save cost.
By Insulation: Extruded XLPE Leads with 83.4%
Extruded cross-linked polyethylene (XLPE) insulation is worth USD 9.76 billion (83.4%) in 2025 and reaches 90.3% of value by 2035, growing at 12.32% a year. Mass-impregnated (MI) paper insulation holds 13.7% and grows at 5.46%. Other insulation types, including ethylene propylene rubber (EPR) and legacy fluid-filled designs, hold 2.9%.
By Scope: Cable Supply Leads with 68.1%
Cable supply is worth USD 7.97 billion (68.1%) in 2025. Installation and protection, which covers laying, burial, rock placement and pull-in, is worth USD 2.97 billion (25.4%) and grows at 11.78% a year. Accessories and monitoring, including joints, terminations and distributed temperature sensing, is worth USD 760.79 million (6.5%) and grows fastest at 12.42% a year as buyers respond to cable failure losses.
DC Exclusive: The Route-Kilometer and Per-MW Model and Application × Current Type Matrix
At USD 3.42 billion in 2025, HVDC interconnectors and grid links are the single largest cell of the matrix and 29.2% of all submarine power cable spending.
| 2025, USD billion | HVDC | HVAC | Total |
|---|---|---|---|
| Offshore Wind Export Cables | 1.02 | 2.37 | 3.39 |
| Offshore Wind Inter-Array Cables | 0.00 | 1.99 | 1.99 |
| Interconnectors and Grid Links | 3.42 | 1.33 | 4.75 |
| Island and Coastal Power Links | 0.09 | 0.78 | 0.87 |
| Oil and Gas Power-from-Shore | 0.08 | 0.48 | 0.56 |
| Others | 0.00 | 0.14 | 0.14 |
| Total | 4.61 | 7.09 | 11.70 |
HVDC accounts for 72.0% of interconnector spending but only 30.0% of offshore wind export spending in 2025, which is why export cables have the most room to change: DC Market Insights expects the HVDC share of export cable value to reach 48% by 2035.
The matrix is a DC Market Insights model, not a shipment count. It is built from 65 inputs: 17 annual offshore wind capacity cohorts, 16 annual interconnector route-km cohorts, 4 anchors for cable spend per MW, 4 anchors for cost per route-km, 12 anchors for island, power-from-shore and other uses, and 12 HVDC-share anchors by application, checked against the disclosed transmission sales of listed suppliers. The model and its assumptions are explained on our research methodology page.
Regional Insights: Which Region Leads the Submarine Power Cable Market?
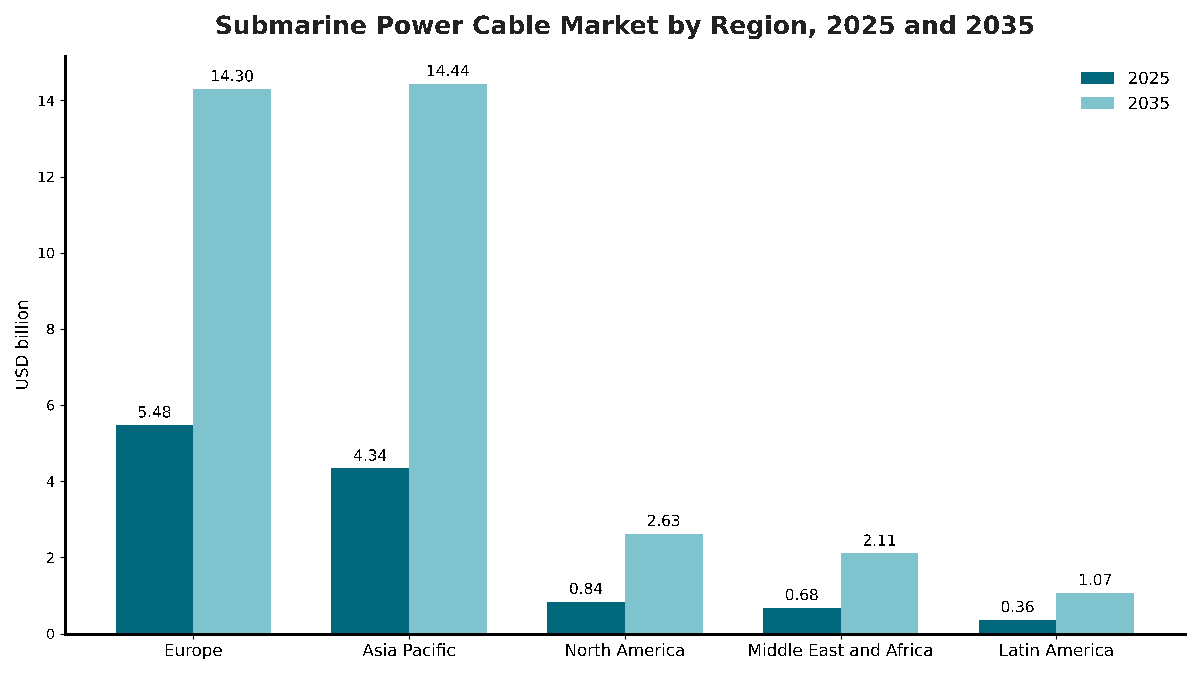
Europe leads the Submarine Power Cable Market with 46.8% of 2025 value, and Asia Pacific is the fastest-growing region at 12.77% a year, because South Korea and Japan are adding HVDC cable plants while Chinese projects move to 500 kV export cables.
Europe Leads with 46.8% Share
European buyers spent USD 5.48 billion on submarine power cables in 2025, and the region is forecast to reach USD 14.30 billion in 2035, a CAGR of 10.07%. In the United Kingdom, National Grid has placed cable contracts for Eastern Green Link 1, 3 and 4, and confirmed GBP 3 billion of supply-chain contracts for the 2 GW Eastern Green Link 4, including GBP 2 billion with Prysmian for the cables.
Asia Pacific Holds 37.1% Share and Grows Fastest
Asia Pacific is worth USD 4.34 billion in 2025 and USD 14.44 billion by 2035, a CAGR of 12.77%, and overtakes Europe as the largest region by 2035. China holds about half of global cumulative offshore wind capacity, according to GWEC, and Chinese suppliers have moved to 500 kV export cables.
North America Holds 7.2% Share
North America is worth USD 842.72 million in 2025 and USD 2.63 billion by 2035, a CAGR of 12.03%. LS GreenLink, a subsidiary of LS Cable & System, is investing USD 681.00 million in an HVDC submarine cable plant in Chesapeake, Virginia, but federal offshore wind policy caps the near-term outlook.
Middle East and Africa Holds 5.8% Share
The Middle East and Africa is worth USD 678.86 million in 2025 and USD 2.11 billion by 2035, a CAGR of 11.99%; DC Market Insights attributes most of that growth to power-from-shore for offshore oil and gas fields and to coastal grid links.
Latin America Holds 3.1% Share
Latin America is worth USD 362.84 million in 2025 and USD 1.07 billion by 2035, a CAGR of 11.43%; DC Market Insights attributes most of that spending to power-from-shore for offshore oil and gas platforms and to island links.
Country Analysis: Which Countries Buy the Most Submarine Power Cable?
China is the largest country market for submarine power cables at USD 3.07 billion in 2025, 26.2% of global value, followed by the United Kingdom at USD 1.66 billion (14.2%) and Germany at USD 948.06 million (8.1%). The 12 largest countries account for 81.9% of 2025 spending.
| Rank | Country | Region | 2025 (USD billion) | Share 2025 | 2035 (USD billion) | CAGR 2025-2035 |
|---|---|---|---|---|---|---|
| 1 | China | Asia Pacific | 3.07 | 26.2% | 8.57 | 10.82% |
| 2 | United Kingdom | Europe | 1.66 | 14.2% | 4.08 | 9.39% |
| 3 | Germany | Europe | 0.95 | 8.1% | 2.35 | 9.50% |
| 4 | Netherlands | Europe | 0.75 | 6.4% | 1.59 | 7.81% |
| 5 | United States | North America | 0.74 | 6.4% | 2.42 | 12.53% |
| 6 | Denmark | Europe | 0.48 | 4.1% | 1.24 | 9.99% |
| 7 | Taiwan | Asia Pacific | 0.41 | 3.5% | 1.14 | 10.78% |
| 8 | Greece | Europe | 0.39 | 3.3% | 1.04 | 10.37% |
| 9 | Italy | Europe | 0.35 | 3.0% | 1.00 | 11.05% |
| 10 | South Korea | Asia Pacific | 0.30 | 2.6% | 1.35 | 16.04% |
| 11 | Japan | Asia Pacific | 0.26 | 2.2% | 1.21 | 16.72% |
| 12 | Saudi Arabia | Middle East and Africa | 0.22 | 1.9% | 0.83 | 14.06% |
Japan is the fastest-growing large country market at 16.72% a year, ahead of South Korea at 16.04%, as both countries build domestic HVDC cable capacity at Taihan and Furukawa Electric. The country figures are a DC Market Insights allocation of the regional totals, weighted by each country’s offshore wind pipeline and planned interconnector route length.
Forecast Scenarios: How Could the 2035 Forecast Change?
The Submarine Power Cable Market reaches USD 34.54 billion by 2035 in the base case, with a range of USD 28.05 billion to USD 40.45 billion across the low and high scenarios.
| Scenario | Assumption from 2026 | 2035 (USD billion) | CAGR 2025-2035 |
|---|---|---|---|
| Low | Offshore wind additions 20% below base; two large interconnectors delayed beyond 2035 | 28.05 | 9.13% |
| Base | Offshore wind additions rise to 36 GW a year; interconnector cable rises to about 3,250 route-km a year | 34.54 | 11.43% |
| High | Offshore wind additions track industry forecasts; HVDC share of export cables reaches 60% | 40.45 | 13.20% |
The low case reflects a longer US pause and slower auctions in Europe. The high case assumes factory and vessel capacity keeps pace with announced programs.
Competitive Insights: Who Leads the Submarine Power Cable Market?
- Prysmian
- Nexans
- NKT
- Sumitomo Electric
- LS Cable & System
- Hellenic Cables
- Furukawa Electric
- Taihan
- ZTT
- JDR Cable Systems
- Van Oord
Prysmian is the market leader with about 24% of the Submarine Power Cable Market in 2025, and the three largest suppliers, Prysmian, Nexans and NKT, together hold about half (DC Market Insights estimate, based on the reported transmission sales of each company converted at about USD 1.13 per euro and adjusted for land cable work, set against the USD 11.70 billion market). Prysmian’s Transmission segment reported revenues of EUR 1.64 billion in the first half of 2026 at a 20.7% adjusted EBITDA margin, with a backlog of about EUR 17 billion. Nexans reported PWR-Transmission sales of EUR 1.66 billion in 2025, with organic growth of 29.8%. NKT’s Transmission order backlog reached EUR 13.0 billion at the end of the first half of 2026, about 70% of it in interconnectors and 30% in offshore wind. Hellenic Cables, part of Cenergy Holdings, reported cables segment revenue of EUR 1.46 billion in 2025 and a record backlog of EUR 3.4 billion at 30 June 2026. Sumitomo Electric is building a GBP 350 million HVDC subsea cable plant at the Port of Nigg in Scotland, and LS Cable & System reported a record order backlog of KRW 7.63 trillion at the end of 2025. ZTT won 500 kV export cable contracts for Chinese offshore wind farms, JDR Cable Systems won inter-array cable termination and commissioning work on the Coastal Virginia Offshore Wind project, and Van Oord installs HVDC cable for Sumitomo Electric in the United Kingdom.
Recent Developments
- In January 2025, Nexans won the LanWin 2 project from TenneT, worth about EUR 1 billion, for 250 km of 525 kV HVDC export cable systems (Source: Nexans press release).
- In September 2025, NKT signed a contract worth EUR 650 million with Energinet to deliver the HVDC power cable system linking Bornholm Energy Island to Zealand (Source: offshoreWIND.biz news report).
- In February 2026, Prysmian signed the Eastern Green Link 4 contract, worth over EUR 2.3 billion, for a 2 GW HVDC link between Fife in Scotland and Norfolk in England (Source: Prysmian press release).
- In March 2026, National Grid signed contracts worth nearly GBP 3 billion with Hitachi Energy and NKT for Eastern Green Link 3, a 690 km HVDC link with about 580 km offshore (Source: National Grid press release).
- In June 2026, Greece’s IPTO awarded Prysmian a EUR 910 million framework agreement for island interconnections with over 900 km of HVAC cable (Source: Baird Maritime news report).
- In July 2026, SSEN Transmission signed a long-term framework agreement with Sumitomo Electric and Van Oord for HVDC cable projects, including 525 kV cable for the proposed Shetland 2 link (Source: TGS4C news report).
We follow these contracts, factory investments and vessel launches as they happen in our data center industry updates.
Methodology: How We Built the Submarine Power Cable Market Model
DC Market Insights built this market bottom-up from two volume drivers. Offshore wind cable spending uses 17 annual cohorts of grid-connected capacity (2020 to 2036), averaged over the year of connection and the following year to reflect when cable revenue is recognized, and priced at USD 0.40 million per MW in 2020, USD 0.47 million in 2025 and USD 0.53 million in 2035. Interconnector and grid-link spending uses 16 annual cohorts of route-km in execution, priced at USD 2.40 million per route-km in 2020, USD 3.05 million in 2025 and USD 3.60 million in 2035. Island links, power-from-shore and other uses were added from anchors for 2020, 2025, 2030 and 2035. The total was split by 6 applications, 2 current types, 3 voltage classes, 2 conductor materials, 3 insulation types, 3 scope items and 5 regions, and every split sums to the market total. The result was checked top-down against the reported transmission sales and backlogs of Prysmian, Nexans, NKT and Cenergy Holdings, and against GWEC installation counts.
Table of contents
- 01Introduction
- 1.1Market Definition and Scope
- 1.2Applications, Technologies and Regions Covered
- 1.3Currency, Base Year and Forecast Period
- 1.4Key Questions Answered
- 02Research Methodology
- 2.1Offshore Wind Cable Spend per MW Model
- 2.2Interconnector Route-Kilometer Model
- 2.3Island, Power-from-Shore and Other Uses
- 2.4Top-Down Check Against Supplier Disclosures
- 2.5Assumptions and Limitations
- 03Executive Summary
- 3.1Market at a Glance, 2020-2035
- 3.2Key Findings
- 3.3Analyst Recommendations by Buyer Type
- 04Market Dynamics
- 4.1Drivers
- 4.2Challenges and Restraints
- 4.3Opportunities
- 4.4Trends
- 4.5Impact Analysis of Drivers and Challenges, 2025-2035
- 05Pricing and Cost Analysis
- 5.1Contract Value per Route-Kilometer, Selected HVDC Projects
- 5.2Offshore Wind Cable Spend per MW, 2020-2035
- 5.3Copper and Aluminum Price Pass-Through
- 06Standards and Regulation
- 6.1IEC 63026 and IEC 62067
- 6.2CIGRE Technical Brochure 490
- 6.3DNV-ST-0359
- 6.4Interconnector Regulation and Industrial Policy
- 07Supply Chain and Value Chain Analysis
- 7.1High-Voltage Cable Factory Capacity
- 7.2Cable-Laying Vessels
- 7.3Installation, Burial and Protection
- 7.4Framework Agreements with Transmission System Operators
- 08Global Submarine Power Cable Market Size and Forecast
- 8.1Market Size, 2020-2024
- 8.2Market Size, 2025
- 8.3Market Forecast, 2026-2035
- 09Market by Application
- 9.1Offshore Wind Export Cables
- 9.2Offshore Wind Inter-Array Cables
- 9.3Interconnectors and Grid Links
- 9.4Island and Coastal Power Links
- 9.5Oil and Gas Power-from-Shore
- 9.6Others
- 10Market by Current Type
- 10.1HVAC
- 10.2HVDC
- 11Market by Voltage
- 11.1Medium Voltage (up to 66 kV)
- 11.2High Voltage (above 66 kV to 220 kV)
- 11.3Extra-High Voltage (above 220 kV)
- 12Market by Conductor Material
- 12.1Copper
- 12.2Aluminum
- 13Market by Insulation
- 13.1Extruded (XLPE)
- 13.2Mass-Impregnated (MI)
- 13.3Others (EPR and Fluid-Filled)
- 14Market by Scope
- 14.1Cable Supply
- 14.2Installation and Protection
- 14.3Accessories and Monitoring
- 15DC Exclusive: Application × Current Type Matrix
- 15.1Application × Current Type Matrix, 2025
- 15.2HVDC Share by Application, 2025 and 2035
- 15.3Implications for Suppliers
- 16Market by Region
- 16.1Europe (United Kingdom, Germany, Netherlands, Denmark, Greece, Italy, Rest of Europe)
- 16.2Asia Pacific (China, Taiwan, South Korea, Japan, Rest of Asia Pacific)
- 16.3North America (United States, Canada)
- 16.4Middle East and Africa (Saudi Arabia, Rest of Middle East and Africa)
- 16.5Latin America (Brazil, Rest of Latin America)
- 16.6Top 12 Countries, 2025 and 2035
- 17Regional Cross-Sections
- 17.1Region × Application, 2025 and 2035
- 17.2Region × Current Type, 2025 and 2035
- 18Forecast Scenarios
- 18.1Base, Low and High Cases to 2035
- 18.2Sensitivity to Offshore Wind Additions
- 18.3Sensitivity to Interconnector Delays
- 19Competitive Landscape
- 19.1Market Share of Leading Suppliers, 2025
- 19.2Top-Three Concentration
- 19.3Contracts, Framework Agreements and Acquisitions, 2025-2026
- 19.4Factory and Vessel Investments
- 20Company Profiles
- 20.1Prysmian
- 20.2Nexans
- 20.3NKT
- 20.4Sumitomo Electric
- 20.5LS Cable & System
- 20.6Hellenic Cables
- 20.7Furukawa Electric
- 20.8Taihan
- 20.9ZTT
- 20.10JDR Cable Systems
- 20.11Van Oord
- 21Analyst Recommendations
- 21.1For Cable Manufacturers and Installers
- 21.2For Transmission System Operators and Wind Developers
- 21.3For Data Center Operators and Investors
- Fig. 1Submarine Power Cable Market Size, 2020-2035
- Fig. 2Offshore Wind Capacity in Execution, 2020-2035
- Fig. 3Interconnector Route-Kilometers in Execution, 2020-2035
- Fig. 4Market Share by Application, 2025 and 2035
- Fig. 5Market Share by Current Type, 2025 and 2035
- Fig. 6Application × Current Type Matrix, 2025
- Fig. 7Market by Region, 2025 and 2035
- Fig. 8Top 12 Countries, 2025
- Fig. 9Forecast Scenarios, 2025-2035
- Fig. 10Top-Three Supplier Concentration, 2025
- Table 1Report Attributes
- Table 2Contract Value per Route-Kilometer, Selected HVDC Projects
- Table 3Market by Application, 2025 and 2035
- Table 4Market by Current Type, 2025 and 2035
- Table 5Market by Voltage, 2025 and 2035
- Table 6Market by Conductor Material, 2025 and 2035
- Table 7Market by Insulation, 2025 and 2035
- Table 8Market by Scope, 2025 and 2035
- Table 9Application × Current Type Matrix, 2025
- Table 10Market by Region, 2025 and 2035
- Table 11Top 12 Countries, 2025 and 2035
- Table 12Forecast Scenarios, 2035
- Table 13Contracts and Framework Agreements, 2025-2026
- Table 14Company Profiles: Products, Factories and Vessels
About this report
Written by Satyabrat Rajawat and reviewed by Deepti Agrawal, Senior Editor, Research. Figures are built top-down and bottom-up and reconciled before publication, with 2025 as the base year.
Read our methodologyHow we built this
- Historical period2020-2024
- Base year2025
- Forecast period2026-2035
- Sizing approachTop-down + bottom-up
Need more than the report?
Advisory on this market
Due diligence, site selection and market entry work, by the analysts who wrote this report.
See consulting servicesFrequently asked questions
USD 11.70 billion in 2025, rising to USD 34.54 billion by 2035. DC Market Insights estimates the market at USD 8.39 billion in 2020.
11.43% a year from 2025 to 2035, faster than the 6.89% a year recorded between 2020 and 2025, as HVDC interconnector and offshore wind orders turn into revenue.
Interconnectors and grid links, with USD 4.75 billion or 40.6% of the market in 2025. Offshore wind export cables are the fastest-growing segment at 14.36% a year.
About EUR 1.59 million to EUR 4.00 million per route-kilometer on recent euro HVDC contracts, by DC Market Insights calculation. The model uses USD 3.05 million per route-km for interconnector cable in 2025.
Europe, with USD 5.48 billion or 46.8% of 2025 value. Asia Pacific grows fastest at 12.77% a year and overtakes Europe by 2035.
Prysmian leads with about 24% of the market, and Prysmian, Nexans and NKT together hold about half (DC Market Insights estimate). Sumitomo Electric, LS Cable & System, Hellenic Cables, Furukawa Electric, Taihan, ZTT and JDR Cable Systems also compete.
945 TWh of data center electricity use is expected by 2030, according to the IEA, more than double 2024. Data center operators such as Google and Amazon buy offshore wind output that reaches shore through export cables.
China, with USD 3.07 billion or 26.2% of 2025 spending, followed by the United Kingdom at USD 1.66 billion. Japan grows fastest at 16.72% a year (DC Market Insights estimate).
Licences, delivery and payment
Which licence should I choose?
Single User is a view-only PDF for one person. Multi User adds a printable PDF and the Excel data for unlimited users at one location. Enterprise covers your whole company and includes 100 free analyst hours.
How and when will I receive the report?
By email, within 24–48 business hours of payment, in the formats of your licence.
How can I pay?
Securely through PayPal: with a PayPal account, a debit or credit card, or PayPal Pay Later where available. Prices are in US dollars.
Can I see a sample first?
Yes. Request a free sample and we will email it to you.
Can the report be tailored to my needs?
Yes. We can add countries, segments or data cuts. Talk to an analyst about the scope you need.
Can I get an invoice or pay against a purchase order?
Write to sales@dcmarketinsights.com and our team will help.