
Green Data Center Market Size, Share & Forecast to 2035
Market at a glance
The Green Data Center market was worth USD 26.71 billion in 2025 and is forecast to reach USD 90.38 billion by 2035, growing at a 12.96% CAGR. North America accounts for 41.4% of the market.
 By Satyabrat Rajawat, Senior Research Analyst, Strategic Advisory
 Reviewed by Deepti Agrawal
Last updated 7 Oct 2026
Base year 2025 PDF + Excel
Reviewed by Deepti Agrawal
Last updated 7 Oct 2026
Base year 2025 PDF + Excel
Source: DC Market Insights analysis
Key findings
AI Halls Carry USD 3.09 Million of Green Power and Cooling per MW
Direct-to-Chip Liquid Cooling Grows from USD 2.41 Billion to USD 17.33 Billion
Grid Capacity Lags Data Center Demand
Retrofit Spending Grows from USD 5.21 Billion to USD 18.41 Billion
What is inside the report
- 01Introduction
- 02Research Methodology
- 03Executive Summary
- 04Market Dynamics
- 05Pricing and Cost Analysis
- 06Standards and Regulation
- 07Supply Chain and Value Chain Analysis
- 08Global Green Data Center Market Size and Forecast
- 09Market by Component
- 10Market by Cooling Technology
- 21chapters
- 2020-2024Historical period
- 2026-2035Forecast period
- 15Companies profiled
Regional insights
- North America41.4%
- Asia Pacific28.4%
- Europe21.3%
- Latin America4.7%
- Middle East and Africa4.2%
Segmentation
Companies profiled
- Schneider Electric
- Vertiv
- Eaton
- ABB
- Siemens
- Johnson Controls
- Trane Technologies
- Carrier
- Daikin
- STULZ
- Rittal
- Delta Electronics
- Huawei Digital Power
- Legrand
- Mitsubishi Electric
Recent developments
Microsoft said that a data center design it launched in August 2024 consumes zero water for cooling and will avoid the need for more than 125 million liters of water per year per data center, with the first sites coming online in late 2027 (Source: Microsoft company blog).
NextEra Energy and Google announced a 25-year agreement under which Google will buy power from the 615 MW Duane Arnold nuclear plant in Iowa once it restarts, which NextEra expects by the first quarter of 2029, pending regulatory approvals (Source: NextEra Energy press release).
Eaton agreed to acquire Boyd Thermal for USD 9.5 billion and completed the deal in March 2026 (Source: Eaton press release and quarterly filing).
Vertiv completed its approximately USD 1.0 billion acquisition of PurgeRite, a provider of mechanical flushing, purging and filtration services for data centers, to expand its liquid cooling services (Source: Vertiv press release).
Meta announced nuclear energy agreements with Vistra, TerraPower and Oklo supporting up to 6.6 GW of new and existing clean energy by 2035 (Source: Meta newsroom announcement).
Full analysis
The Green Data Center Market covers the energy-efficient power systems, efficient and liquid cooling, energy monitoring and management software, and design, retrofit and integration services that let a data center run at a low power usage effectiveness (PUE) and on low-carbon electricity. DC Market Insights values the global Green Data Center Market at USD 26.71 billion in 2025 and forecasts USD 90.38 billion by 2035, a CAGR of 12.96%. The 2025 value is built from the build itself: DC Market Insights estimates that about 12.0 GW of new IT capacity was completed in 2025, of which it counts 6.86 GW as green-qualified; at about USD 2.18 million of power, cooling and management systems per MW in conventional halls and USD 3.09 million per MW in AI halls, that gives USD 17.92 billion of new-build spend, efficiency retrofits on an estimated installed base of about 102 GW add USD 5.21 billion, and services add USD 3.58 billion. Cooling solutions are the fastest-growing component at 14.58% a year because AI halls move from air to direct-to-chip liquid cooling, and the Middle East and Africa is the fastest-growing region at 15.18% a year as DC Market Insights expects AI campus capacity in Saudi Arabia and the United Arab Emirates to grow from a small installed base.
Executive Summary
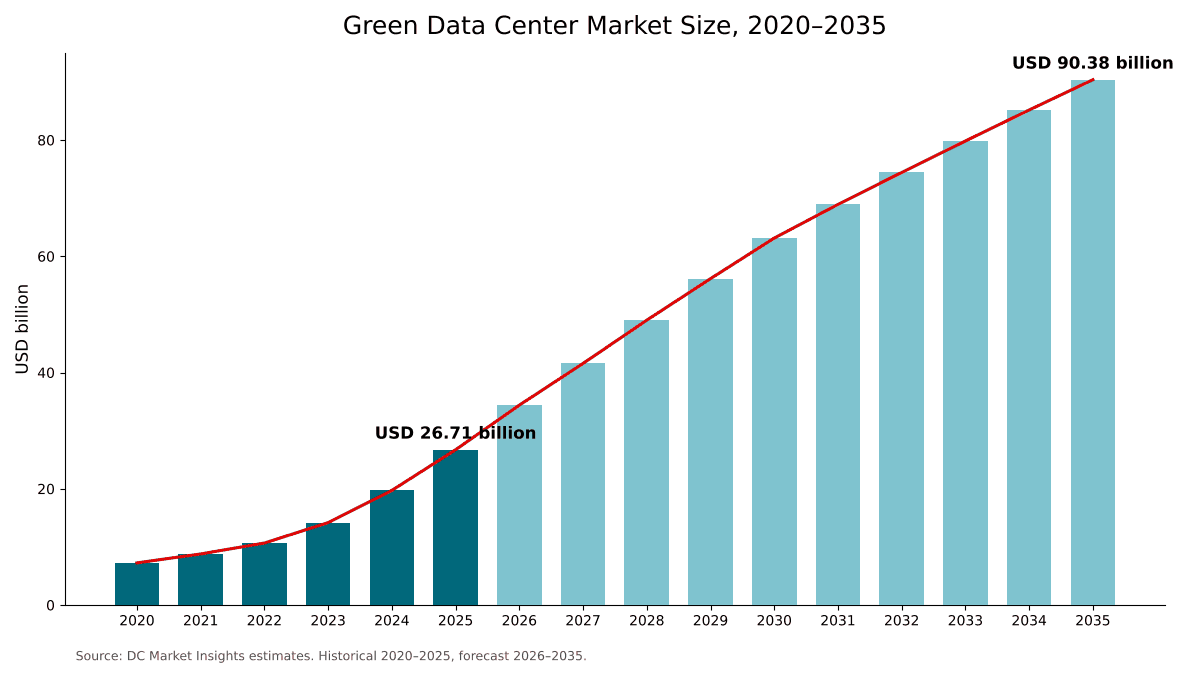
The Global Green Data Center Market size was valued at USD 7.25 billion in 2020, reached USD 26.71 billion in 2025, and is anticipated to reach USD 90.38 billion by 2035, at a CAGR of 12.96% during the forecast period.
| Report attribute | Details |
|---|---|
| Historical Period | 2020-2024 |
| Base Year | 2025 |
| Forecast Period | 2026-2035 |
| Green Data Center Market Size 2025 | USD 26.71 Billion |
| Green Data Center Market, CAGR | 12.96% |
| Green Data Center Market Size 2035 | USD 90.38 Billion |
The Green Data Center Market grew at 29.80% a year between 2020 and 2025, and 2025 alone added 35.4% over 2024, when the market stood at USD 19.72 billion. AI halls explain the jump: DC Market Insights estimates they took 35% of new capacity in 2025 against 3% in 2020, and they carry more green power and cooling equipment per MW than conventional halls. Growth slows to 12.96% a year from 2025 to 2035 because spend per MW in AI halls falls as rack density rises, even as annual capacity completions more than double to 27.0 GW by 2035 and the green-qualified share of new capacity rises from 57.2% to 87.9%.
Electricity demand sets the stakes. The International Energy Agency (IEA) estimates that data centers used about 415 TWh of electricity in 2024, around 1.5% of global consumption, and projects demand to more than double to around 945 TWh by 2030 (Source: IEA Energy and AI report). Every point of PUE removed from that load is worth more each year.
Market Scope: What Does the Green Data Center Market Cover?
The Green Data Center Market covers the power, cooling, monitoring and service spending that makes a data center measurably efficient and low-carbon, valued at first sale in current US dollars, with 2025 as the base year and forecasts to 2035. DC Market Insights sizes it at USD 26.71 billion in 2025.
Included. Power systems in green-qualified facilities, such as high-efficiency uninterruptible power supplies (UPS), lithium-ion batteries, switchgear and intelligent power distribution; cooling systems such as economizers, high-temperature chillers, direct-to-chip and immersion liquid cooling, rear-door and in-row heat exchangers and heat reuse equipment; data center infrastructure management (DCIM) and energy management software; and consulting, design, energy audit, retrofit integration and maintenance services. A facility counts as green-qualified when it is designed to a PUE of 1.3 or lower or holds an equivalent efficiency certification. Efficiency retrofits in older facilities count whatever their starting PUE.
Excluded. Electricity purchases and power purchase agreements, on-site generation assets such as solar farms or reactors, servers, storage and network equipment, the building shell and land, and power and cooling systems installed in new facilities that do not meet the green design threshold.
How the segments fit together. The component split covers the full USD 26.71 billion. The cooling technology split re-cuts the cooling solutions component alone, worth USD 9.92 billion in 2025. The data center type, vertical and regional splits each re-cut the full market total.
Market Drivers: What Drives the Green Data Center Market?
Three drivers explain most of the growth in the Green Data Center Market: AI halls that need USD 3.09 million of power and cooling systems per MW, binding efficiency rules in Europe and Asia, and operator commitments to carbon-free electricity that only work if the load itself is efficient.
AI Halls Carry USD 3.09 Million of Green Power and Cooling per MW
A graphics processing unit (GPU) training hall concentrates heat that air cannot remove efficiently, so new AI halls use liquid cooling and dense power distribution. DC Market Insights estimates the power, cooling and management content of a green-qualified AI hall at USD 3.09 million per MW in 2025, against USD 2.18 million per MW for a conventional hall, and counts 78% of new AI capacity as green-qualified against 46% of new conventional capacity. Supplier results show the shift: Vertiv’s fourth-quarter 2025 organic orders rose about 252% on a year earlier, and Schneider Electric reported triple-digit year-over-year demand growth in its pure data center segment in the fourth quarter of 2025. Prefabricated power and cooling skids for AI halls are covered in the Modular Data Center Market report.
Efficiency Rules Turn PUE Targets into Design Requirements
Regulation now writes PUE into law. Germany’s Energy Efficiency Act (EnEfG) requires data centers that start operating from 1 July 2026 to reach a PUE of 1.2 or lower, and data centers that began operating before 1 July 2026 must hold a PUE of 1.5 or lower from 1 July 2027 and 1.3 or lower from 1 July 2030. China’s special action plan for green and low-carbon data centers set an end-2025 goal of an average PUE below 1.5, with new large and hyperscale sites at 1.25 or lower, and Singapore’s Infocomm Media Development Authority (IMDA) aims for all data centers in the country to operate at a PUE of 1.3 or lower. Against the weighted-average PUE of 1.54 reported by respondents to the Uptime Institute 2025 global survey, a move to 1.2 cuts total facility energy for the same IT load by 22.1%, which is the equipment and retrofit spending this market measures.
Carbon-Free Power Commitments Raise the Value of Every Saved Megawatt
Operators now contract clean power years ahead and at nuclear scale. Meta announced agreements with Vistra, TerraPower and Oklo in January 2026 that support up to 6.6 GW of new and existing clean energy by 2035, and Google agreed in October 2025 to buy power from NextEra’s 615 MW Duane Arnold nuclear plant in Iowa, which NextEra expects to restart by the first quarter of 2029, pending regulatory approvals. Every MW of overhead removed by efficient power and cooling frees scarce carbon-free supply for IT load. DC Market Insights forecasts the green-qualified share of new capacity to rise from 57.2% in 2025 to 87.9% in 2035.
Market Trends: How Is Green Data Center Design Changing?
Green data center design is moving from efficient air cooling to liquid cooling, from reporting energy to reusing heat, and from water-intensive evaporative cooling to closed-loop systems, with direct-to-chip liquid cooling growing at 21.81% a year to 2035.
Direct-to-Chip Liquid Cooling Grows from USD 2.41 Billion to USD 17.33 Billion
Direct-to-chip liquid cooling takes heat off processors with a coolant loop instead of room air, which cuts fan energy and allows warmer facility water and more hours of free cooling. DC Market Insights values green direct-to-chip systems at USD 2.41 billion in 2025, 24.3% of green cooling spend, rising to USD 17.33 billion and 44.8% by 2035. Suppliers have bought their way into the segment: Eaton completed its purchase of Boyd Thermal on 12 March 2026 for USD 9.55 billion net of cash acquired, and Boyd Thermal had forecast 2026 sales of USD 1.7 billion, of which USD 1.5 billion is liquid cooling. The coolant distribution hardware behind these loops is sized in the Data Center Liquid Cooling Manifolds Market report.
Heat Reuse Moves from Pilot Projects to Legal Obligation
Germany’s EnEfG requires a reused-energy share of at least 10% for data centers starting operation from 1 July 2026, and a planned share of at least 15% for those starting from 1 July 2027 and 20% for those starting from 1 July 2028. Heat reuse systems, which export low-grade heat to district heating networks, are the fastest-growing cooling technology in the Green Data Center Market at 22.45% a year, from USD 347.28 million in 2025 to USD 2.63 billion in 2035.
Closed-Loop Cooling Cuts Water Use
In December 2024, Microsoft said that a data center design it launched in August 2024 consumes zero water for cooling by recycling water through a closed loop. DC Market Insights counts the dry coolers, chillers and heat exchangers of closed-loop designs in green cooling solutions.
Market Challenges: What Holds the Green Data Center Market Back?
Grid capacity and the cost premium of green equipment for smaller operators are the two constraints that DC Market Insights expects to slow the Green Data Center Market, keeping enterprise data center spending growth at 7.69% a year against 14.04% for hyperscale.
Grid Capacity Lags Data Center Demand
The power to run new halls arrives more slowly than the halls themselves. A Lawrence Berkeley National Laboratory report for the US Department of Energy found that US data centers used about 176 TWh of electricity in 2023, 4.4% of US consumption, and could use 6.7% to 12% by 2028 (Source: US Department of Energy announcement).
Enterprise and Edge Operators Face a Higher Cost Premium
Smaller operators pay more per MW for efficiency because engineering and controls costs do not scale down with load. DC Market Insights estimates that services take 16.8% of enterprise green spending in 2025, against 12.4% for hyperscale sites, and that enterprise data centers fall from 17.1% of the Green Data Center Market in 2025 to 10.6% by 2035 as their workloads move to cloud and colocation.
Market Opportunities: Where Are the New Revenue Pools?
The two largest new revenue pools in the Green Data Center Market are efficiency retrofits of an installed base that nearly triples by 2035, worth USD 18.41 billion that year, and liquid cooling services, where suppliers are buying capability ahead of demand.
Retrofit Spending Grows from USD 5.21 Billion to USD 18.41 Billion
DC Market Insights models efficiency retrofit spending at USD 5.21 billion in 2025 on an installed base that DC Market Insights estimates at about 102 GW, rising to USD 18.41 billion in 2035 on about 293 GW.
Liquid Cooling Services Become a Separate Revenue Line
In December 2025, Vertiv completed its approximately USD 1.0 billion acquisition of PurgeRite, a provider of mechanical flushing, purging and filtration services for data centers, to expand its liquid cooling services. DC Market Insights forecasts services to grow at 14.15% a year, from USD 3.58 billion in 2025 to USD 13.46 billion in 2035, faster than power solutions at 10.96%.
Pricing: How Much Does Green Data Center Infrastructure Cost per MW?
A green-qualified conventional data center hall needs about USD 2.18 million of power, cooling and management systems per MW of IT load in 2025, and a green-qualified AI hall about USD 3.09 million per MW. These are DC Market Insights estimates covering equipment and software inside the facility, excluding services, IT equipment and the building shell.
| Green infrastructure spend per MW | 2020 | 2025 | 2030 | 2035 |
|---|---|---|---|---|
| Conventional hall (USD million) | 2.05 | 2.18 | 2.31 | 2.45 |
| AI hall (USD million) | 3.45 | 3.09 | 2.76 | 2.47 |
| Green-qualified share, conventional | 30.0% | 46.0% | 62.0% | 78.0% |
| Green-qualified share, AI | 60.0% | 78.0% | 85.5% | 93.0% |
The two cost lines converge. Conventional spend per MW rises about 1.2% a year as economizers, metering and higher-efficiency UPS become standard. AI spend per MW falls about 2.2% a year because each rack generation puts more compute behind the same cooling loop and power train.
Standards and Regulation: Which Rules Shape Green Data Centers?
Five sets of rules define what a green data center must measure and achieve: the ISO/IEC 30134 metrics, ASHRAE Standard 90.4, the EU data center rating scheme, Germany’s EnEfG and national PUE targets in China and Singapore.
ISO/IEC 30134-2:2026. The international standard defines PUE as the key performance indicator for data center energy efficiency; the second edition was published in January 2026 and replaces the 2016 edition.
ASHRAE Standard 90.4-2022. The American Society of Heating, Refrigerating and Air-Conditioning Engineers (ASHRAE) standard sets minimum energy efficiency requirements for the design and operation of data centers.
EU data center rating scheme. Under the Energy Efficiency Directive and Commission Delegated Regulation (EU) 2024/1364, operators of data centers with an installed IT power demand of at least 500 kW report energy and sustainability data to a European database, first by 15 September 2024, then by 15 May 2025 and every year after that.
Germany EnEfG. The act in force sets a PUE limit of 1.2 for data centers starting operation from 1 July 2026, reused-energy shares of 10% to 20% and a renewable electricity requirement of 50% from 1 January 2024 and 100% from 1 January 2027. The federal government approved a draft amendment on 24 June 2026 that would relax the limits for existing sites to 1.6 from July 2027 and 1.4 from July 2030 and move the 100% renewable deadline to 1 January 2030; until parliament adopts it, the current figures apply.
China and Singapore. China’s national action plan targets an average PUE below 1.5 by the end of 2025 and 1.25 or lower for new large and hyperscale sites. Singapore’s Green Data Centre Roadmap aims to provide at least 300 MW of additional data center capacity in the near term, and IMDA aims for all data centers to operate at a PUE of 1.3 or lower.
Market Segmentation: Which Segment Leads the Green Data Center Market?
Power solutions lead the Green Data Center Market with USD 10.82 billion, or 40.5% of 2025 value, hyperscale data centers lead buyers with 46.3%, and IT and telecom lead verticals with 41.8%. Cooling solutions are the fastest-growing segment by component at 14.58% a year, against 10.96% for power solutions, because AI halls replace room air with liquid cooling loops that carry more equipment value per MW.
By Component: Power Solutions Lead with 40.5%
| Component | 2025 (USD billion) | Share 2025 | 2035 (USD billion) | CAGR 2025-2035 |
|---|---|---|---|---|
| Power Solutions | 10.82 | 40.5% | 30.61 | 10.96% |
| Cooling Solutions | 9.92 | 37.1% | 38.69 | 14.58% |
| Monitoring and Management Software | 2.38 | 8.9% | 7.62 | 12.32% |
| Services | 3.58 | 13.4% | 13.46 | 14.15% |
On the forecast growth paths, cooling solutions overtake power solutions before 2030 and reach 42.8% of the Green Data Center Market by 2035.
By Cooling Technology: Air Cooling with Economizers Leads with 58.4%
| Cooling technology | 2025 (USD billion) | Share 2025 | 2035 (USD billion) | CAGR 2025-2035 |
|---|---|---|---|---|
| Air Cooling with Economizers | 5.79 | 58.4% | 12.07 | 7.62% |
| Direct-to-Chip Liquid Cooling | 2.41 | 24.3% | 17.33 | 21.81% |
| Immersion Cooling | 0.57 | 5.7% | 3.79 | 20.96% |
| Rear-Door and In-Row Heat Exchangers | 0.80 | 8.1% | 2.86 | 13.55% |
| Heat Reuse Systems | 0.35 | 3.5% | 2.63 | 22.45% |
Shares are of the cooling solutions component. On the forecast growth paths, direct-to-chip liquid cooling overtakes air cooling with economizers around 2032, and immersion cooling, worth USD 565.56 million in 2025, grows almost as fast.
By Data Center Type: Hyperscale Data Centers Lead with 46.3%
| Data center type | 2025 (USD billion) | Share 2025 | 2035 (USD billion) | CAGR 2025-2035 |
|---|---|---|---|---|
| Hyperscale Data Centers | 12.37 | 46.3% | 46.00 | 14.04% |
| Colocation Data Centers | 7.67 | 28.7% | 25.40 | 12.72% |
| Enterprise Data Centers | 4.57 | 17.1% | 9.58 | 7.69% |
| Edge and Modular Data Centers | 2.11 | 7.9% | 9.40 | 16.11% |
Edge and modular data centers grow fastest at 16.11% a year because DC Market Insights models nearly all new factory-built capacity as green-qualified. Colocation providers buy green infrastructure to meet tenant commitments: Equinix reported that renewable energy covered 96% of its global electricity use in 2024, and Digital Realty reported 93% global renewable coverage in 2025.
By Vertical: IT and Telecom Lead with 41.8%
IT and telecom operators account for USD 11.17 billion (41.8%) of 2025 demand and grow at 13.85% a year to USD 40.85 billion by 2035. Banking, financial services and insurance (BFSI) follows with USD 4.35 billion (16.3%), then retail and e-commerce with USD 2.91 billion (10.9%), government and defense with USD 2.83 billion (10.6%), healthcare with USD 1.92 billion (7.2%), others with USD 1.82 billion (6.8%) and energy and utilities with USD 1.71 billion (6.4%). Healthcare grows fastest at 14.02% a year in the DC Market Insights model, as clinical AI workloads move into new efficient halls.
DC Exclusive: The Green Spend per MW Model and Component × Buyer Matrix
At USD 5.18 billion in 2025, hyperscale cooling is the single largest cell of the matrix and 19.4% of all green data center spending. It is a DC Market Insights model, not a shipment count, built from 65 inputs: 32 capacity cohorts (16 years of conventional and AI halls), 2 spend-per-MW curves, 2 green-qualified share curves, 1 retrofit rate, 1 services ratio, 4 component splits, 5 cooling technology splits, 4 data center type splits, 7 vertical splits, 5 regional splits and 2 supplier disclosures used as a cross-check.
| 2025, USD billion | Power | Cooling | Software | Services | Total |
|---|---|---|---|---|---|
| Hyperscale Data Centers | 4.73 | 5.18 | 0.93 | 1.53 | 12.37 |
| Colocation Data Centers | 3.30 | 2.69 | 0.72 | 0.96 | 7.67 |
| Enterprise Data Centers | 1.91 | 1.38 | 0.51 | 0.77 | 4.57 |
| Edge and Modular Data Centers | 0.89 | 0.67 | 0.22 | 0.33 | 2.11 |
| Total | 10.82 | 9.92 | 2.38 | 3.58 | 26.71 |
Hyperscale buyers spend 41.9% of their green budget on cooling, the only buyer group where cooling outweighs power, because most AI halls sit in hyperscale campuses. Colocation spend tilts to power at 43.0%, reflecting multi-tenant UPS and distribution built for many customers. Enterprise sites spend 30.3% on cooling but 16.8% on services, the highest services share of any buyer, so suppliers with strong audit and retrofit teams win there.
The green spend per MW model behind these figures rests on three DC Market Insights inputs: new capacity delivered each year (12.0 GW in 2025), the share built for AI (35% in 2025) and the share designed to a PUE of 1.3 or lower. Multiplying green-qualified capacity by its equipment content per MW gives new-build spend; adding retrofits on the installed base and services gives the market. The model and its assumptions are explained on our research methodology page.
Regional Insights: Which Region Leads the Green Data Center Market?
North America leads the Green Data Center Market with 41.4% of 2025 value, and the Middle East and Africa is the fastest-growing region at 15.18% a year, because DC Market Insights expects new AI campus capacity in the Gulf states to grow fastest from a small base.
North America Leads with 41.4% Share
North American operators spent USD 11.06 billion on green data center infrastructure and services in 2025, and the region is forecast to reach USD 33.53 billion in 2035, a CAGR of 11.73%. Large clean power contracts of 2025 and 2026, including the Meta and Google nuclear agreements, support US hyperscale AI campuses. North America falls to 37.1% of the market by 2035 as Asia Pacific catches up, not because its volume slows.
Asia Pacific Holds 28.4% Share
Asia Pacific is worth USD 7.59 billion in 2025 and USD 30.10 billion by 2035, a CAGR of 14.77%, the largest share gain of any region. National PUE targets in China and Singapore push new sites toward green designs, and in the DC Market Insights model India, Japan and Australia follow China in green spending.
Europe Holds 21.3% Share
Europe is worth USD 5.69 billion in 2025 and USD 17.71 billion by 2035, a CAGR of 12.03%. Europe combines EU-wide energy reporting for every site of 500 kW or more with binding PUE, heat reuse and renewable power rules in Germany.
Latin America Holds 4.7% Share
Latin America is worth USD 1.26 billion in 2025 and USD 4.43 billion by 2035, a CAGR of 13.43%. DC Market Insights allocates most of it to Brazil, Mexico and Chile.
Middle East and Africa Holds 4.2% Share
The Middle East and Africa is worth USD 1.12 billion in 2025 and USD 4.61 billion by 2035, growing fastest at 15.18% a year. Hot climates make cooling the largest lever on PUE, so DC Market Insights models a higher cooling share of green spending in the region’s new AI campuses than in its older colocation sites.
Country Analysis: Which Countries Spend the Most on Green Data Centers?
The United States is the largest country market for green data center infrastructure at USD 9.88 billion in 2025, 37.0% of global value, followed by China at USD 2.82 billion (10.6%) and Germany at USD 1.22 billion (4.6%). The 12 largest countries account for 78.1% of 2025 spending.
| Rank | Country | Region | 2025 (USD billion) | Share 2025 | 2035 (USD billion) | CAGR 2025-2035 |
|---|---|---|---|---|---|---|
| 1 | United States | North America | 9.88 | 37.0% | 29.54 | 11.58% |
| 2 | China | Asia Pacific | 2.82 | 10.6% | 10.11 | 13.61% |
| 3 | Germany | Europe | 1.22 | 4.6% | 3.68 | 11.71% |
| 4 | Canada | North America | 1.18 | 4.4% | 3.99 | 12.92% |
| 5 | Japan | Asia Pacific | 1.08 | 4.0% | 3.52 | 12.57% |
| 6 | United Kingdom | Europe | 1.06 | 4.0% | 3.03 | 11.03% |
| 7 | India | Asia Pacific | 0.74 | 2.8% | 4.54 | 19.85% |
| 8 | France | Europe | 0.67 | 2.5% | 2.05 | 11.84% |
| 9 | Australia | Asia Pacific | 0.64 | 2.4% | 2.47 | 14.50% |
| 10 | Brazil | Latin America | 0.57 | 2.1% | 1.95 | 13.16% |
| 11 | Netherlands | Europe | 0.55 | 2.0% | 1.56 | 11.06% |
| 12 | Singapore | Asia Pacific | 0.46 | 1.7% | 1.53 | 12.74% |
India is the fastest-growing country market at 19.85% a year, because DC Market Insights models India’s new capacity growing fastest among large markets and nearly all of it is built to current efficiency designs. Germany ranks third in the DC Market Insights allocation because EnEfG requirements raise the green share of its new and existing sites. The country figures are a DC Market Insights allocation of the regional totals, weighted by each country’s estimated share of installed and new data center capacity and by the strictness of its efficiency rules.
Forecast Scenarios: How Could the 2035 Forecast Change?
The Green Data Center Market reaches USD 90.38 billion by 2035 in the base case, with a range of USD 72.48 billion to USD 107.46 billion across the low and high scenarios.
| Scenario | Assumption from 2026 | 2035 (USD billion) | CAGR 2025-2035 |
|---|---|---|---|
| Low | Capacity additions 15% below base; green-qualified share 8 points lower by 2030 | 72.48 | 10.50% |
| Base | Additions rise to 27.0 GW a year; green-qualified share reaches 87.9% of new capacity | 90.38 | 12.96% |
| High | Additions 15% above base; green-qualified share 5 points higher by 2030 | 107.46 | 14.93% |
The low case is what slower grid connections and a pause in AI capital spending look like: completions slip and more new capacity is built to older designs. The high case assumes that more countries copy binding PUE limits and that clean power contracts keep pace with announced hyperscale plans.
Competitive Insights: Who Leads the Green Data Center Market?
- Schneider Electric
- Vertiv
- Eaton
- ABB
- Siemens
- Johnson Controls
- Trane Technologies
- Carrier
- Daikin
- STULZ
- Rittal
- Delta Electronics
- Huawei Digital Power
- Legrand
- Mitsubishi Electric
Schneider Electric and Vertiv lead the Green Data Center Market, and DC Market Insights estimates that the three largest suppliers, Schneider Electric, Vertiv and Eaton, together hold about 31% of the market in 2025 (DC Market Insights estimate: the green-qualified share of each supplier’s data center power, cooling and software sales set against the USD 26.71 billion market). Vertiv’s 2025 net sales were USD 10.23 billion, and it ended 2025 with a backlog of USD 15.0 billion, up 109% year over year. Schneider Electric’s 2025 revenue crossed EUR 40 billion for the first time, with 9% organic growth, and the company paid EUR 0.8 billion in the first half of 2025 for a 75% controlling interest in liquid cooling specialist Motivair. The other suppliers listed compete across efficient power distribution, chillers and air handling, liquid cooling and integrated rack power and cooling systems.
Recent Developments
- In December 2024, Microsoft said that a data center design it launched in August 2024 consumes zero water for cooling and will avoid the need for more than 125 million liters of water per year per data center, with the first sites coming online in late 2027 (Source: Microsoft company blog).
- In October 2025, NextEra Energy and Google announced a 25-year agreement under which Google will buy power from the 615 MW Duane Arnold nuclear plant in Iowa once it restarts, which NextEra expects by the first quarter of 2029, pending regulatory approvals (Source: NextEra Energy press release).
- In November 2025, Eaton agreed to acquire Boyd Thermal for USD 9.5 billion and completed the deal in March 2026 (Source: Eaton press release and quarterly filing).
- In December 2025, Vertiv completed its approximately USD 1.0 billion acquisition of PurgeRite, a provider of mechanical flushing, purging and filtration services for data centers, to expand its liquid cooling services (Source: Vertiv press release).
- In January 2026, Meta announced nuclear energy agreements with Vistra, TerraPower and Oklo supporting up to 6.6 GW of new and existing clean energy by 2035 (Source: Meta newsroom announcement).
We follow these deals, launches and capacity announcements as they happen in our data center industry updates.
Methodology: How We Built the Green Data Center Market Model
DC Market Insights built the Green Data Center Market bottom-up from 16 annual capacity cohorts (2020 to 2035), each split into conventional and AI halls. Each cohort was multiplied by a green-qualified share (30% of conventional and 60% of AI capacity in 2020, rising to 78% and 93% by 2035) and by a power, cooling and management cost per MW (USD 2.18 million and USD 3.09 million in 2025). Efficiency retrofits were added on the installed base, which grows from about 66 GW in 2020 to about 293 GW in 2035 after 1.5% annual retirements, at USD 0.05 million per MW per year in 2025. Services were added at 15.5% of equipment and software value in 2025, rising to 17.5% by 2035, which makes services 13.4% of the market in 2025. Every split sums to its parent total. The result was checked top-down against the disclosed 2025 results of Vertiv and Schneider Electric and against IEA and US Department of Energy electricity data. Country values allocate each regional total by country weights for installed and new capacity. The named analyst built the model, and a reviewer checked the arithmetic, sources and dates before publication.
Table of contents
- 01Introduction
- 1.1Market Definition and Scope
- 1.2Green-Qualified Facility Criteria
- 1.3Components, Buyers and Regions Covered
- 1.4Currency, Base Year and Forecast Period
- 02Research Methodology
- 2.1Green Spend per MW Model
- 2.2Capacity Cohorts: Conventional and AI Halls
- 2.3Green-Qualified Share of New Capacity
- 2.4Retrofit and Services Model
- 2.5Top-Down Check Against Supplier Disclosures
- 2.6Assumptions and Limitations
- 03Executive Summary
- 3.1Market at a Glance, 2020-2035
- 3.2Key Findings
- 3.3Analyst Recommendations by Buyer Type
- 04Market Dynamics
- 4.1Drivers
- 4.2Challenges and Restraints
- 4.3Opportunities
- 4.4Trends
- 4.5Data Center Electricity Demand and PUE Benchmarks
- 05Pricing and Cost Analysis
- 5.1Green Infrastructure Spend per MW: Conventional vs AI Halls, 2020-2035
- 5.2Green-Qualified Share of New Capacity, 2020-2035
- 5.3Retrofit Spend per Installed MW
- 06Standards and Regulation
- 6.1ISO/IEC 30134-2:2026
- 6.2ASHRAE Standard 90.4-2022
- 6.3EU Energy Efficiency Directive and Delegated Regulation (EU) 2024/1364
- 6.4Germany Energy Efficiency Act (EnEfG)
- 6.5China and Singapore PUE Targets
- 07Supply Chain and Value Chain Analysis
- 7.1Power Equipment Suppliers
- 7.2Cooling and Liquid Cooling Suppliers
- 7.3Software, Integrators and Service Providers
- 7.4Mergers and Acquisitions, 2024-2026
- 08Global Green Data Center Market Size and Forecast
- 8.1Market Size, 2020-2024
- 8.2Market Size, 2025
- 8.3Market Forecast, 2026-2035
- 8.4New-Build vs Retrofit vs Services Spending
- 09Market by Component
- 9.1Power Solutions
- 9.2Cooling Solutions
- 9.3Monitoring and Management Software
- 9.4Services
- 10Market by Cooling Technology
- 10.1Air Cooling with Economizers
- 10.2Direct-to-Chip Liquid Cooling
- 10.3Immersion Cooling
- 10.4Rear-Door and In-Row Heat Exchangers
- 10.5Heat Reuse Systems
- 11Market by Data Center Type
- 11.1Hyperscale Data Centers
- 11.2Colocation Data Centers
- 11.3Enterprise Data Centers
- 11.4Edge and Modular Data Centers
- 12Market by Vertical
- 12.1IT and Telecom
- 12.2BFSI
- 12.3Government and Defense
- 12.4Healthcare
- 12.5Retail and E-commerce
- 12.6Energy and Utilities
- 12.7Others
- 13DC Exclusive: Component × Buyer Matrix
- 13.1Component × Data Center Type Matrix, 2025
- 13.2Spend Mix by Buyer Group
- 13.3Implications for Suppliers
- 14Market by Region
- 14.1North America (United States, Canada)
- 14.2Europe (Germany, United Kingdom, France, Netherlands, Rest of Europe)
- 14.3Asia Pacific (China, Japan, India, Australia, Singapore, Rest of Asia Pacific)
- 14.4Latin America (Brazil, Rest of Latin America)
- 14.5Middle East and Africa
- 14.6Top 12 Countries, 2025 and 2035
- 15Regional Cross-Sections
- 15.1Regional Shares, 2025 and 2035
- 15.2Regional Growth Rates, 2025-2035
- 16Retrofit and Upgrade Market
- 16.1Installed Base, 2020-2035
- 16.2Retrofit Spending, 2020-2035
- 17Forecast Scenarios
- 17.1Base, Low and High Cases to 2035
- 17.2Sensitivity to Capacity Additions
- 17.3Sensitivity to Green-Qualified Share
- 18Competitive Landscape
- 18.1Top-Three Supplier Concentration, 2025
- 18.2Acquisitions in Liquid Cooling, 2024-2026
- 18.3Clean Energy Agreements by Data Center Operators
- 19Company Profiles
- 19.1Schneider Electric
- 19.2Vertiv
- 19.3Eaton
- 19.4ABB
- 19.5Siemens
- 19.6Johnson Controls
- 19.7Trane Technologies
- 19.8Carrier
- 19.9Daikin
- 19.10STULZ
- 19.11Rittal
- 19.12Delta Electronics
- 19.13Huawei Digital Power
- 19.14Legrand
- 19.15Mitsubishi Electric
- 20Recent Developments
- 20.1Acquisitions and Completions
- 20.2Clean Power Agreements
- 20.3Design Launches
- 21Analyst Recommendations
- 21.1For Power and Cooling Suppliers
- 21.2For Hyperscale and Colocation Operators
- 21.3For Investors
- Fig. 1Green Data Center Market Size, 2020-2035
- Fig. 2New Data Center Capacity Added per Year, Conventional vs AI, 2020-2035
- Fig. 3Green Infrastructure Spend per MW, 2020-2035
- Fig. 4New-Build vs Retrofit vs Services Spending, 2020-2035
- Fig. 5Market by Component, 2025 and 2035
- Fig. 6Market by Cooling Technology, 2025 and 2035
- Fig. 7Component × Data Center Type Matrix, 2025
- Fig. 8Market by Region, 2025 and 2035
- Fig. 9Forecast Scenarios, 2035
- Fig. 10Top 12 Countries, 2025
- Table 1Report Attributes
- Table 2Green Infrastructure Spend per MW, 2020-2035
- Table 3Market Size, 2020-2035
- Table 4Market by Component, 2025 and 2035
- Table 5Market by Cooling Technology, 2025 and 2035
- Table 6Market by Data Center Type, 2025 and 2035
- Table 7Market by Vertical, 2025 and 2035
- Table 8Component × Data Center Type Matrix, 2025
- Table 9Market by Region, 2025 and 2035
- Table 10Top 12 Countries, 2025 and 2035
- Table 11Forecast Scenarios, 2035
- Table 12Acquisitions and Clean Power Agreements, 2024-2026
About this report
Written by Satyabrat Rajawat and reviewed by Deepti Agrawal, Senior Editor, Research. Figures are built top-down and bottom-up and reconciled before publication, with 2025 as the base year.
Read our methodologyHow we built this
- Historical period2020-2024
- Base year2025
- Forecast period2026-2035
- Sizing approachTop-down + bottom-up
Need more than the report?
Advisory on this market
Due diligence, site selection and market entry work, by the analysts who wrote this report.
See consulting servicesFrequently asked questions
USD 26.71 billion in 2025, rising to USD 90.38 billion by 2035. DC Market Insights estimates the market at USD 7.25 billion in 2020.
12.96% a year from 2025 to 2035. Growth was faster, at 29.80% a year, between 2020 and 2025 as AI halls scaled up.
Power solutions, with USD 10.82 billion or 40.5% of the market in 2025. Cooling solutions are the fastest-growing component at 14.58% a year.
About USD 2.18 million per MW for a green-qualified conventional hall and USD 3.09 million per MW for an AI hall in 2025, according to DC Market Insights estimates covering power, cooling and management systems.
North America, with USD 11.06 billion or 41.4% of 2025 value. The Middle East and Africa grows fastest at 15.18% a year.
Schneider Electric and Vertiv lead, and Schneider Electric, Vertiv and Eaton together hold about 31% of the market (DC Market Insights estimate). ABB, Siemens, Johnson Controls, Trane Technologies, Carrier, Daikin, STULZ, Rittal, Delta Electronics, Huawei Digital Power, Legrand and Mitsubishi Electric also compete.
Heat reuse systems, at 22.45% a year, followed by direct-to-chip liquid cooling at 21.81%, which grows from USD 2.41 billion in 2025 to USD 17.33 billion by 2035.
USD 9.88 billion in the United States, or 37.0% of 2025 spending, followed by China at USD 2.82 billion. India grows fastest at 19.85% a year (DC Market Insights estimate).
Licences, delivery and payment
Which licence should I choose?
Single User is a view-only PDF for one person. Multi User adds a printable PDF and the Excel data for unlimited users at one location. Enterprise covers your whole company and includes 100 free analyst hours.
How and when will I receive the report?
By email, within 24–48 business hours of payment, in the formats of your licence.
How can I pay?
Securely through PayPal: with a PayPal account, a debit or credit card, or PayPal Pay Later where available. Prices are in US dollars.
Can I see a sample first?
Yes. Request a free sample and we will email it to you.
Can the report be tailored to my needs?
Yes. We can add countries, segments or data cuts. Talk to an analyst about the scope you need.
Can I get an invoice or pay against a purchase order?
Write to sales@dcmarketinsights.com and our team will help.