
Small Modular Reactor Market Size, Share & Forecast to 2035
Market at a glance
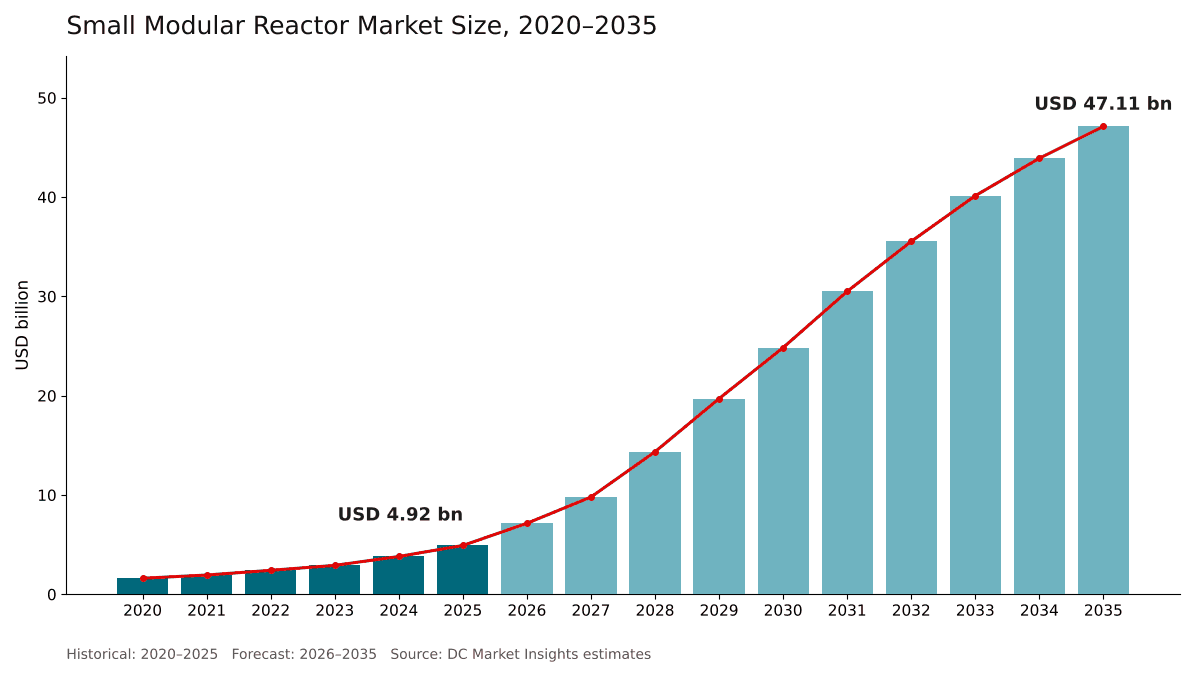
The Small Modular Reactor market was worth USD 4,920.0 million in 2025 and is forecast to reach USD 47.11 billion by 2035, growing at a 25.36% CAGR. North America accounts for 40.5% of the market.
 By Satyabrat Rajawat, Senior Research Analyst, Strategic Advisory
 Reviewed by Deepti Agrawal
Last updated 6 Oct 2026
Base year 2025 PDF + Excel
Reviewed by Deepti Agrawal
Last updated 6 Oct 2026
Base year 2025 PDF + Excel
Source: DC Market Insights analysis
Key findings
Data Center Offtake Deals Push Data Center SMR Spending Up 36.34% a Year
Larger Modules Grow Fastest by Power Rating at 28.92%
First Units Cost CAD 20,333 per kW at Darlington
Nuclear Island Equipment Becomes a USD 17.63 Billion Supply Chain
What is inside the report
- 01Introduction
- 02Research Methodology
- 03Executive Summary
- 04Market Dynamics
- 05Pricing and Cost Analysis
- 06Standards and Regulation
- 07Supply Chain and Value Chain Analysis
- 08Global Small Modular Reactor Market Size and Forecast
- 09Market by Reactor Type
- 10Market by Power Rating
- 20chapters
- 2020-2024Historical period
- 2026-2035Forecast period
- 14Companies profiled
Regional insights
- North America40.5%
- Europe30%
- Asia Pacific24%
- Latin America2.6%
- Middle East and Africa2.9%
Segmentation
Companies profiled
- GE Vernova Hitachi Nuclear Energy
- China National Nuclear Corporation (CNNC)
- Rosatom
- NuScale Power
- Rolls-Royce SMR
- Holtec International
- TerraPower
- X-energy
- Kairos Power
- Oklo
- Westinghouse Electric Company
- BWX Technologies
- Korea Hydro & Nuclear Power
- Doosan Enerbility
Recent developments
Ontario announced its final investment decision for the four-unit Darlington SMR project, with a total cost of CAD 20.90 billion and the first unit in service in 2030 (Source: World Nuclear News article).
the US Department of Energy selected TVA and Holtec for up to USD 800.00 million in federal cost-shared funding for SMR projects in Tennessee and Michigan (Source: US Department of Energy announcement).
Meta announced nuclear agreements with Vistra, TerraPower and Oklo that could provide up to 6.6 GW of nuclear power (Source: Data Center Dynamics article).
the NRC issued the construction permit for the first Natrium plant, a 345 MWe sodium-cooled fast reactor at Kemmerer, Wyoming (Source: World Nuclear News article).
Rolls-Royce SMR and Great British Energy – Nuclear signed a contract to start work on three 470 MWe units at Wylfa in North Wales (Source: World Nuclear News article).
the NRC issued the first US construction permit for a BWRX-300 to TVA for the Clinch River site (Source: GE Vernova press release).
Full analysis
The Small Modular Reactor Market covers spending on small modular reactor (SMR) projects and programs worldwide: reactor development, design and licensing, nuclear island equipment, site construction and balance of plant, and first-core and reload fuel. DC Market Insights values the global Small Modular Reactor Market at USD 4.92 billion in 2025 and forecasts USD 47.11 billion by 2035, a CAGR of 25.36%. The 2025 value is built from the projects themselves: about 1.27 GW of SMR capacity under construction, priced at a blended cost per kW and spread over a six-year build profile, gives USD 2.08 billion of construction and equipment spending; development, design and licensing work adds USD 2.65 billion, and fuel adds USD 183.75 million. Data centers and AI campuses are the fastest-growing application at 36.34% a year because hyperscalers have signed multi-gigawatt offtake deals with SMR developers, and the Middle East and Africa is the fastest-growing region at 28.79% a year, which DC Market Insights attributes to Gulf states adding SMR programs from a small base.
Executive Summary
The Global Small Modular Reactor Market size was valued at USD 1.61 billion in 2020, reached USD 4.92 billion in 2025, and is anticipated to reach USD 47.11 billion by 2035, at a CAGR of 25.36% during the forecast period.
| Report attribute | Details |
|---|---|
| Historical Period | 2020-2024 |
| Base Year | 2025 |
| Forecast Period | 2026-2035 |
| Small Modular Reactor Market Size 2025 | USD 4.92 Billion |
| Small Modular Reactor Market, CAGR | 25.36% |
| Small Modular Reactor Market Size 2035 | USD 47.11 Billion |
The market grew at 24.95% a year between 2020 and 2025, and 2025 alone added 29.1% over 2024, when construction of the first SMR in the G7 was approved in Ontario and development budgets at reactor vendors kept climbing. Until 2025 most of the money went into design and licensing rather than concrete: development, design and licensing work made up 53.9% of 2025 spending. That balance flips in the forecast. DC Market Insights models 30.7 GW of SMR construction starts between 2026 and 2035, rising from 0.9 GW in 2026 to 4.9 GW in 2035, so construction and equipment spending grows from USD 2.08 billion in 2025 to USD 38.32 billion in 2035.
Growth slows after 2030 because blended construction cost per kW falls as designs repeat, from USD 12,500 for 2025 starts to USD 8,584 for 2035 starts. The market passes USD 24.84 billion in 2030, and operating SMR capacity reaches about 8.3 GW by 2035.
Market Scope: What Does the Small Modular Reactor Market Cover?
The Small Modular Reactor Market covers money spent to develop, license, build and fuel small modular reactors, valued in current US dollars in the year it is spent, with 2025 as the base year and forecasts to 2035. DC Market Insights sizes it at USD 4.92 billion in 2025. The International Atomic Energy Agency (IAEA) defines small modular reactors as advanced reactors that produce electricity of up to 300 MW(e) per module.
Included. Reactor vendor development, design certification and licensing work; regulator review fees and public development programs; nuclear island equipment such as reactor pressure vessels, steam generators, reactor internals, control rod drives and instrumentation; civil works, turbine island and balance of plant on SMR sites; first-core fuel, reload fuel and fuel qualification. Light-water, gas-cooled, sodium- and lead-cooled, salt-cooled and micro designs are all in scope, as are floating power units. Designs above 300 MWe that are sold as small modular units, such as the 345 MWe Natrium reactor and the 470 MWe Rolls-Royce SMR, are tracked separately in the Above 300 MWe segment.
Excluded. Large reactors above 500 MWe, power purchase agreements from existing nuclear plants, electricity sales from operating SMRs, naval and icebreaker propulsion reactors, decommissioning and waste disposal.
How the segments fit together. Every segment dimension re-cuts the same USD 4.92 billion. The component split comes straight from the model, while the other dimensions allocate the total by project pipeline. Spending is booked to the country where the reactor is built or, for development work, where the vendor carries it out.
Market Drivers: What Drives the Small Modular Reactor Market?
Three drivers explain most of the growth in the Small Modular Reactor Market: data center operators that have signed for gigawatts of SMR output, the first SMR construction approvals in North America, and public money that shares first-of-a-kind risk. Together they lift construction starts from 0.3 GW in 2025 to 4.9 GW a year by 2035 in the DC Market Insights base case.
Data Center Offtake Deals Push Data Center SMR Spending Up 36.34% a Year
Meta’s January 2026 nuclear agreements could provide up to 6.6 GW of nuclear power from new SMRs and existing large reactors, including Natrium units from TerraPower able to deliver up to 690 MW as early as 2032 and an advanced technology campus of up to 1.2 GW with Oklo in Pike County, Ohio. Amazon’s Climate Pledge Fund anchored a USD 500.00 million financing round for X-energy, and the two target up to 5 GW of SMRs in the United States by 2039. Google’s agreement with Kairos Power will enable up to 500 MW, with the first reactor targeted online by 2030. The International Energy Agency expects data center electricity demand to more than double from about 415 TWh in 2024 to around 945 TWh by 2030. DC Market Insights estimates that data centers and AI campuses accounted for USD 467.11 million (9.5%) of SMR spending in 2025 and forecasts USD 10.36 billion (22.0%) by 2035, the fastest growth of any application. The Nuclear-Powered Data Centers Market report covers the data center side of these agreements.
First Construction Approvals Turn Designs into Projects
Ontario Power Generation received a Licence to Construct from the Canadian Nuclear Safety Commission in April 2025, and Ontario announced its final investment decision for the Darlington project on 8 May 2025: four GE Vernova Hitachi BWRX-300 units of 300 MW each at a total cost of CAD 20.90 billion. In the United States, the Nuclear Regulatory Commission (NRC) issued the Natrium construction permit for Kemmerer Unit 1 in March 2026 and, in September 2026, the first US construction permit for a BWRX-300, at the Tennessee Valley Authority (TVA) Clinch River site, completing that review in 14 months, four months earlier than scheduled (Source: GE Vernova press release). DC Market Insights models 0.9 GW of new starts in 2026.
Public Cost-Sharing Underwrites First-of-a-Kind Risk
The US Department of Energy (DOE) selected TVA and Holtec for up to USD 800.00 million in federal cost-shared funding for initial SMR projects in Tennessee and Michigan (Source: US Department of Energy announcement). The UK government pledged over GBP 2.50 billion for its SMR program in the current Spending Review period, and the National Wealth Fund is committing up to GBP 599 million to Rolls-Royce SMR. A May 2025 US executive order set a goal of expanding US nuclear capacity from around 100 GW to 400 GW by 2050. DC Market Insights estimates government and research programs at USD 688.37 million (14.0%) of 2025 spending.
Market Trends: How Is the Small Modular Reactor Market Changing?
The Small Modular Reactor Market is shifting toward larger modules and advanced non-water-cooled designs, with units above 300 MWe growing at 28.92% a year to 2035.
Larger Modules Grow Fastest by Power Rating at 28.92%
Vendors are pushing unit size up to spread fixed costs. The Rolls-Royce SMR is a 470 MWe design, the Natrium reactor is rated at 345 MWe with output boostable to 500 MWe, and NuScale’s NRC-approved reactor design is rated at 77 MWe. DC Market Insights forecasts the Above 300 MWe segment to grow at 28.92% a year, from USD 835.88 million in 2025 to USD 10.60 billion in 2035, the fastest of the three power ratings.
Advanced Designs Move from Paper to Site Work
Non-light-water designs now have hardware in the ground. Kairos Power began building its Hermes demonstration reactor in Oak Ridge, Tennessee, in 2024, broke ground on Hermes 2 in April 2026 and raised the planned Hermes 2 output from 28 MWe to 50 MWe. Oklo broke ground on its Aurora-INL sodium-cooled fast reactor, with a maximum power of 75 MWe, at Idaho National Laboratory in September 2025. Molten salt and salt-cooled reactors are the fastest-growing reactor type in the DC Market Insights model at 29.01% a year.
Market Challenges: What Holds the Small Modular Reactor Market Back?
First-of-a-kind cost and the long road from design to revenue are the two constraints that DC Market Insights expects to cap the Small Modular Reactor Market before 2030, when construction spending is still below USD 20.00 billion a year.
First Units Cost CAD 20,333 per kW at Darlington
The first Darlington SMR is forecast to cost CAD 6.10 billion for 300 MW, about CAD 20,333 per kW, against about CAD 17,417 per kW for the four-unit total of CAD 20.90 billion; the higher first-unit figure reflects first-of-a-kind engineering. Cost and schedule risk is real: in Argentina, construction of the 25 MWe net CAREM25 prototype, initially estimated at ARS 3.50 billion (USD 446.00 million), was halted in November 2019 and the remaining work was halted in September 2024 amid budget cuts. DC Market Insights builds a blended cost of USD 12,500 per kW into 2025 starts and assumes a 4% annual decline only from 2028, once second and later units repeat a design.
Vendors Spend Years Before Revenue Arrives
Reactor vendors carry large losses until plants are ordered. NuScale reported revenue of USD 31.5 million for 2025 and a net loss attributable to Class A shareholders of about USD 355.79 million, while ending the year with USD 1.3 billion in cash and investments (Source: NuScale results filed with the US Securities and Exchange Commission). Oklo’s total operating expenses rose to USD 139.30 million in 2025 from USD 52.80 million in 2024. Spending of this kind makes development, design and licensing the largest component today; DC Market Insights expects it to grow only 7.48% a year to 2035 as vendors consolidate.
Market Opportunities: Where Are the New Revenue Pools?
The two largest new revenue pools in the Small Modular Reactor Market are nuclear island equipment, which grows at 33.80% a year to USD 17.63 billion by 2035, and industrial heat and remote power, which together reach USD 9.42 billion by 2035.
Nuclear Island Equipment Becomes a USD 17.63 Billion Supply Chain
Every construction start creates orders for vessels, steam generators, pumps, valves and instrumentation, which DC Market Insights puts at 46% of construction and equipment spending. Nuclear island equipment is worth USD 958.27 million in 2025 and USD 17.63 billion in 2035. Factory-built modules favor suppliers with qualified heavy forging and nuclear-grade welding capacity, the same factory model covered in our Modular Data Center Market report.
Industrial Heat, Remote Power and Floating Plants
SMRs can supply steam as well as electricity. Long Mott Energy, a Dow subsidiary, filed a construction permit application for an X-energy Xe-100 project on 31 March 2025, and the NRC set an 18-month review schedule. Russia’s floating Akademik Lomonosov, with two 35 MWe reactors at Pevek, has been in commercial operation since May 2020, and Russia’s first land-based SMR in Yakutia, licensed in April 2023 with at least 55 MW, is planned for 2028. In the DC Market Insights model, industrial process heat and cogeneration accounts for USD 540.86 million of 2025 spending and USD 5.89 billion in 2035, and remote, off-grid and defense uses account for USD 442.53 million and USD 3.53 billion.
Pricing: How Much Does a Small Modular Reactor Cost per kW?
DC Market Insights uses a blended construction and equipment cost of USD 12,500 per kW for SMR projects started in 2025, falling to USD 10,528 per kW for 2030 starts and USD 8,584 per kW for 2035 starts. The figures cover the nuclear island, civil works and balance of plant, and exclude development, financing and fuel.
| Blended cost by construction start year | 2021 | 2025 | 2030 | 2035 |
|---|---|---|---|---|
| Construction and equipment (USD per kW) | 8,000 | 12,500 | 10,528 | 8,584 |
| Construction starts (MWe) | 425 | 300 | 2,900 | 4,900 |
The 2021 figure reflects projects in China and Russia, which DC Market Insights assumes were built at lower cost. The step up in 2025 reflects first-of-a-kind projects in Canada and the United States, benchmarked against the Darlington budget of about CAD 17,417 per kW across four units. From 2028, DC Market Insights assumes a 4% annual decline as fleets of the same design are built.
Standards and Regulation: Which Rules Shape the Small Modular Reactor Market?
Four sets of rules decide how fast SMR spending turns into construction: the IAEA definition of the technology, national construction licensing, the new risk-informed US licensing framework and US licensing deadlines.
IAEA definition. The IAEA defines small modular reactors as advanced reactors producing up to 300 MW(e) per module. DC Market Insights uses this threshold for the Up to 100 MWe and 101 to 300 MWe segments and tracks larger modular designs separately.
Construction licensing. The Canadian Nuclear Safety Commission issued Ontario Power Generation a Licence to Construct for Darlington in April 2025. Russia’s regulator Rostekhnadzor licensed the country’s first land-based SMR, in the Ust-Yansky district of Yakutia, in April 2023. In the United States, the NRC issued construction permits for Natrium in March 2026 and Clinch River in September 2026.
NRC Part 53. The NRC published its final rule for a risk-informed, technology-inclusive regulatory framework for advanced reactors on 30 March 2026, effective 29 April 2026. It offers an alternative technology-inclusive licensing path, open to advanced designs including non-light-water reactors.
US licensing deadlines. A May 2025 executive order set an 18-month deadline for NRC decisions on the construction and operation of new reactors, and the DOE Reactor Pilot Program selected 11 advanced reactor projects in August 2025 with the goal of at least three test reactors reaching criticality by 4 July 2026.
Market Segmentation: Which Segment Leads the Small Modular Reactor Market?
Light-water SMRs lead the Small Modular Reactor Market with 52.0% of 2025 value, utility power generation leads applications with 64.0%, and development, design and licensing is the largest component at 53.9%. Data centers and AI campuses are the fastest-growing segment at 36.34% a year, against 25.36% for the market, because hyperscaler offtake deals for SMR output were signed years before the plants that will serve them.
By Reactor Type: Light-Water SMRs Lead with 52.0%
| Reactor type | 2025 (USD billion) | Share 2025 | 2035 (USD billion) | CAGR 2025-2035 |
|---|---|---|---|---|
| Light-Water SMRs | 2.56 | 52.0% | 27.56 | 26.84% |
| Sodium- and Lead-Cooled Fast Reactors | 1.03 | 21.0% | 6.83 | 20.80% |
| High-Temperature Gas-Cooled Reactors | 0.76 | 15.5% | 6.12 | 23.17% |
| Microreactors | 0.34 | 7.0% | 3.77 | 27.04% |
| Molten Salt and Salt-Cooled Reactors | 0.22 | 4.5% | 2.83 | 29.01% |
Light-water designs gain 6.5 points of share by 2035 because water-cooled designs such as the BWRX-300 and the Rolls-Royce SMR, a small pressurized water reactor, dominate the 2026 to 2030 construction starts in the DC Market Insights model. Fast reactors lose share as construction starts shift toward water-cooled designs.
By Power Rating: Units of 101 to 300 MWe Lead with 57.0%
Units of 101 to 300 MWe are worth USD 2.80 billion (57.0%) in 2025 and USD 26.38 billion by 2035, a CAGR of 25.13%. Units up to 100 MWe are worth USD 1.28 billion (26.0%) and grow at 23.00% a year, while units above 300 MWe grow fastest at 28.92% a year, from USD 835.88 million to USD 10.60 billion.
By Component: Development, Design and Licensing Leads with 53.9%
| Component | 2025 (USD billion) | Share 2025 | 2035 (USD billion) | CAGR 2025-2035 |
|---|---|---|---|---|
| Development, Design and Licensing | 2.65 | 53.9% | 5.45 | 7.48% |
| Nuclear Island Equipment | 0.96 | 19.5% | 17.63 | 33.80% |
| Construction and Balance of Plant | 1.12 | 22.9% | 20.69 | 33.80% |
| Fuel and Fuel Services | 0.18 | 3.7% | 3.34 | 33.65% |
Construction and balance of plant becomes the largest component by 2035 at 43.9% of value. Fuel and fuel services grow from USD 183.75 million to USD 3.34 billion as first cores are loaded and an operating fleet of about 8.3 GW needs reloads.
By Application: Utility Power Generation Leads with 64.0%
| Application | 2025 (USD billion) | Share 2025 | 2035 (USD billion) | CAGR 2025-2035 |
|---|---|---|---|---|
| Utility Power Generation | 3.15 | 64.0% | 24.97 | 23.01% |
| Data Centers and AI Campuses | 0.47 | 9.5% | 10.36 | 36.34% |
| Industrial Process Heat and Cogeneration | 0.54 | 11.0% | 5.89 | 26.97% |
| Remote, Off-Grid and Defense | 0.44 | 9.0% | 3.53 | 23.09% |
| Marine and Floating Power | 0.32 | 6.5% | 2.36 | 22.11% |
Data centers and AI campuses overtake industrial heat before 2030 and reach 22.0% of value by 2035. Utility power generation remains the largest application because grid utilities such as Ontario Power Generation and TVA own the first BWRX-300 projects.
By Ownership Model: Utility-Owned Projects Lead with 62.0%
Utility-owned projects account for USD 3.05 billion (62.0%) of 2025 spending and grow at 22.69% a year to USD 23.56 billion. Developer-owned projects with offtake agreements, such as those planned with Meta, Amazon and Google, are worth USD 1.18 billion (24.0%) and grow fastest at 31.25% a year to USD 17.90 billion (38.0%). Government and research programs are worth USD 688.37 million (14.0%) and reach USD 5.65 billion by 2035.
DC Exclusive: The SMR Build-Out Model and Reactor Type × Application Matrix
At USD 1.81 billion in 2025, light-water SMRs for utility power generation are the single largest cell of the matrix and 36.7% of all SMR spending. The matrix below cross-tabulates what is being built and who it is built for. It is a DC Market Insights model, not a project count: it is built from 65 inputs: 21 annual construction-start cohorts (2015 to 2035), 21 blended cost-per-kW values, 6 spend-profile weights, 11 development-spending values, 3 fuel parameters and 3 public disclosures (the Darlington budget, NuScale’s 2025 results and Oklo’s 2025 operating expenses) used as cross-checks.
| 2025, USD billion | Utility Power | Data Centers and AI | Industrial Heat | Remote and Defense | Marine and Floating | Total |
|---|---|---|---|---|---|---|
| Light-Water SMRs | 1.81 | 0.18 | 0.17 | 0.12 | 0.29 | 2.56 |
| Sodium- and Lead-Cooled Fast Reactors | 0.82 | 0.13 | 0.04 | 0.03 | 0.01 | 1.03 |
| High-Temperature Gas-Cooled Reactors | 0.39 | 0.06 | 0.27 | 0.03 | 0.01 | 0.76 |
| Microreactors | 0.02 | 0.03 | 0.03 | 0.25 | 0.01 | 0.34 |
| Molten Salt and Salt-Cooled Reactors | 0.11 | 0.07 | 0.03 | 0.01 | 0.01 | 0.22 |
| Total | 3.15 | 0.47 | 0.54 | 0.44 | 0.32 | 4.92 |
Three patterns stand out. Salt-cooled designs carry the highest data center share of any reactor type at 29.6% of their spending, reflecting the Google and Kairos Power program. High-temperature gas-cooled reactors put 35.6% of their spending into industrial heat, because their outlet temperatures suit process steam. Microreactors are mostly a remote and defense business today, with 72.3% of their spending in that application.
The SMR build-out model behind these figures multiplies construction starts by year (300 MWe in 2025, 4,900 MWe in 2035) by the blended cost per kW of each cohort and spreads the cost over six years; adding development, design and licensing work and fuel gives the market. The model and its assumptions are explained on our research methodology page.
Regional Insights: Which Region Leads the Small Modular Reactor Market?
North America leads the Small Modular Reactor Market with 40.5% of 2025 value, and the Middle East and Africa is the fastest-growing region at 28.79% a year, which DC Market Insights attributes to Gulf states adding SMR programs from a very small base.
North America Leads with 40.5% Share
North America accounted for USD 1.99 billion of SMR spending in 2025 and is forecast to reach USD 21.67 billion in 2035, a CAGR of 26.96%. The region holds the first BWRX-300 construction in Ontario, the Natrium and Clinch River construction permits, the Hermes reactors in Tennessee and most of the vendor development spending. North America gains 5.5 points of share by 2035, the largest gain of any region.
Europe Holds 30.0% Share
Europe is worth USD 1.48 billion in 2025 and USD 11.07 billion by 2035, a CAGR of 22.33%. Russia accounts for most of today’s European construction spending, including the Yakutia land-based SMR and the floating power units. The United Kingdom’s three-unit Rolls-Royce SMR project at Wylfa, with a final investment decision expected in 2029, and, in the DC Market Insights model, programs in Poland, Romania and the Czech Republic drive growth after 2030.
Asia Pacific Holds 24.0% Share
Asia Pacific is worth USD 1.18 billion in 2025 (24.0%) and USD 11.54 billion by 2035, a CAGR of 25.61%. China’s Linglong One, a 125 MWe pressurized water reactor at Changjiang whose construction started in July 2021, was undergoing pre-commissioning tests in August 2026.
Latin America Holds 2.6% Share
Latin America is worth USD 127.84 million in 2025 and USD 1.04 billion by 2035, a CAGR of 23.28%. Argentina’s CAREM25 program accounts for most of the region’s historical spending, and its September 2024 construction halt keeps the region’s growth below the global rate.
Middle East and Africa Holds 2.9% Share and Grows Fastest
The Middle East and Africa is worth USD 142.59 million in 2025 and USD 1.79 billion by 2035, a CAGR of 28.79%. DC Market Insights expects Saudi Arabia and the United Arab Emirates to account for most regional spending as nuclear programs and AI campus plans converge.
Country Analysis: Which Countries Spend the Most on Small Modular Reactors?
The United States is the largest country market for small modular reactors at USD 1.48 billion in 2025, 30.1% of global value, followed by China at USD 875.22 million (17.8%) and Russia at USD 747.38 million (15.2%). The 12 largest countries account for 91.1% of 2025 spending.
| Rank | Country | Region | 2025 (USD billion) | Share 2025 | 2035 (USD billion) | CAGR 2025-2035 |
|---|---|---|---|---|---|---|
| 1 | United States | North America | 1.48 | 30.1% | 17.81 | 28.24% |
| 2 | China | Asia Pacific | 0.88 | 17.8% | 7.54 | 24.03% |
| 3 | Russia | Europe | 0.75 | 15.2% | 4.48 | 19.60% |
| 4 | Canada | North America | 0.47 | 9.6% | 3.49 | 22.13% |
| 5 | United Kingdom | Europe | 0.31 | 6.4% | 3.25 | 26.30% |
| 6 | South Korea | Asia Pacific | 0.15 | 3.1% | 1.70 | 27.24% |
| 7 | Poland | Europe | 0.09 | 1.9% | 1.22 | 29.35% |
| 8 | Argentina | Latin America | 0.09 | 1.8% | 0.57 | 20.37% |
| 9 | Japan | Asia Pacific | 0.08 | 1.6% | 0.90 | 27.53% |
| 10 | Romania | Europe | 0.07 | 1.4% | 0.71 | 26.22% |
| 11 | Czech Republic | Europe | 0.06 | 1.2% | 0.66 | 27.30% |
| 12 | Saudi Arabia | Middle East and Africa | 0.05 | 1.0% | 0.75 | 31.39% |
Saudi Arabia is the fastest-growing country market at 31.39% a year, ahead of Poland at 29.35%, and the United States grows fastest among the large markets at 28.24% as data center offtake projects reach construction. The country figures are a DC Market Insights allocation of the regional totals, weighted by each country’s projects under construction, licensing pipeline and vendor development activity.
Forecast Scenarios: How Could the 2035 Forecast Change?
The Small Modular Reactor Market reaches USD 47.11 billion by 2035 in the base case, with a range of USD 39.14 billion to USD 57.48 billion across the low and high scenarios.
| Scenario | Assumption from 2026 | 2035 (USD billion) | CAGR 2025-2035 |
|---|---|---|---|
| Low | Construction starts 30% below base; cost per kW falls 1.5% a year instead of 4% | 39.14 | 23.05% |
| Base | Starts rise from 0.9 GW in 2026 to 4.9 GW in 2035; cost per kW falls 4% a year from 2028 | 47.11 | 25.36% |
| High | Construction starts 25% above base | 57.48 | 27.87% |
The low case reflects repeated first-of-a-kind overruns: fewer orders follow the first units and costs fall slowly. The high case assumes hyperscaler offtake agreements convert into construction starts on the schedules announced.
Competitive Insights: Who Leads the Small Modular Reactor Market?
- GE Vernova Hitachi Nuclear Energy
- China National Nuclear Corporation (CNNC)
- Rosatom
- NuScale Power
- Rolls-Royce SMR
- Holtec International
- TerraPower
- X-energy
- Kairos Power
- Oklo
- Westinghouse Electric Company
- BWX Technologies
- Korea Hydro & Nuclear Power
- Doosan Enerbility
China National Nuclear Corporation, Rosatom and GE Vernova Hitachi, the suppliers behind the SMR construction programs in China, Russia and Canada, together account for about 40% of 2025 spending (DC Market Insights estimate, based on the construction spending allocated to China, Russia and the Darlington project in Canada). CNNC owns and will operate the Linglong One. Rosatom’s SMR for the Yakutia plant is the water-cooled RITM-200N; Russia also operates the floating Akademik Lomonosov and had eight RITM-series reactor units in production in March 2025 for icebreakers and floating power units. GE Vernova Hitachi supplies the BWRX-300 for Darlington and Clinch River. NuScale holds an NRC-approved 77 MWe design, and its SMRs are specified in an agreement between TVA and ENTRA1 Energy to deploy six plants. Rolls-Royce SMR is the preferred bidder for Great British Energy – Nuclear, and Holtec plans two SMR-300 units at Palisades in Michigan. TerraPower closed a USD 650.00 million fundraise in June 2025 that included NVIDIA’s venture arm, X-energy counts Amazon’s Climate Pledge Fund as anchor investor, Kairos Power holds its agreement with Google, and Oklo signed a 12 GW master power agreement with Switch in December 2024.
Recent Developments
- In May 2025, Ontario announced its final investment decision for the four-unit Darlington SMR project, with a total cost of CAD 20.90 billion and the first unit in service in 2030 (Source: World Nuclear News article).
- In December 2025, the US Department of Energy selected TVA and Holtec for up to USD 800.00 million in federal cost-shared funding for SMR projects in Tennessee and Michigan (Source: US Department of Energy announcement).
- In January 2026, Meta announced nuclear agreements with Vistra, TerraPower and Oklo that could provide up to 6.6 GW of nuclear power (Source: Data Center Dynamics article).
- In March 2026, the NRC issued the construction permit for the first Natrium plant, a 345 MWe sodium-cooled fast reactor at Kemmerer, Wyoming (Source: World Nuclear News article).
- In April 2026, Rolls-Royce SMR and Great British Energy – Nuclear signed a contract to start work on three 470 MWe units at Wylfa in North Wales (Source: World Nuclear News article).
- In September 2026, the NRC issued the first US construction permit for a BWRX-300 to TVA for the Clinch River site (Source: GE Vernova press release).
We follow these licensing decisions, offtake agreements and project milestones as they happen in our data center industry updates.
Methodology: How We Built the Small Modular Reactor Market Model
DC Market Insights built this market bottom-up from 21 annual construction-start cohorts (2015 to 2035) measured in MWe, each priced at a blended construction and equipment cost per kW and spread over six years. Construction starts total 1.27 GW for projects active in 2025 and 30.7 GW from 2026 to 2035. Development, design and licensing spending was modeled separately, at USD 2.65 billion in 2025 growing 11.5% in 2026 and slowing to 4.5% by 2035. Fuel combines first cores, reloads and fuel qualification programs. The total was split by 5 reactor types, 3 power ratings, 4 components, 5 applications, 3 ownership models and 5 regions, and every split sums to the market total. The result was checked top-down against the Darlington budget of CAD 20.90 billion for 1,200 MW, the USD 800.00 million DOE cost-share program, NuScale’s 2025 revenue and losses and Oklo’s 2025 operating expenses.
Table of contents
- 01Introduction
- 1.1Market Definition and Scope
- 1.2Reactor Types, Applications and Regions Covered
- 1.3Currency, Base Year and Forecast Period
- 1.4Key Questions Answered
- 02Research Methodology
- 2.1SMR Build-Out Model
- 2.2Construction-Start Cohorts and Spend Profile
- 2.3Development, Design and Licensing Spending Model
- 2.4Fuel and Fuel Services Model
- 2.5Top-Down Check Against Project Budgets and Company Disclosures
- 2.6Assumptions and Limitations
- 03Executive Summary
- 3.1Market at a Glance, 2020-2035
- 3.2Key Findings
- 3.3Analyst Recommendations by Stakeholder
- 04Market Dynamics
- 4.1Drivers
- 4.2Challenges and Restraints
- 4.3Opportunities
- 4.4Trends
- 4.5Impact Analysis of Drivers and Challenges, 2025-2035
- 05Pricing and Cost Analysis
- 5.1Blended Construction Cost per kW by Start Year
- 5.2First-of-a-Kind vs Fleet Costs
- 5.3Darlington Budget Benchmark
- 5.4Cost Outlook, 2026-2035
- 06Standards and Regulation
- 6.1IAEA Definition of Small Modular Reactors
- 6.2Construction Licensing in Canada, Russia and the United States
- 6.3NRC Part 53 Risk-Informed Framework
- 6.4US Licensing Deadlines and the DOE Reactor Pilot Program
- 07Supply Chain and Value Chain Analysis
- 7.1Reactor Vendors and Licensing
- 7.2Nuclear Island Equipment and Heavy Components
- 7.3Construction and Balance of Plant
- 7.4Fuel Supply and Fabrication
- 7.5Offtake Agreements and Project Finance
- 08Global Small Modular Reactor Market Size and Forecast
- 8.1Market Size, 2020-2024
- 8.2Market Size, 2025
- 8.3Market Forecast, 2026-2035
- 8.4Construction Starts and Operating Capacity, 2020-2035
- 09Market by Reactor Type
- 9.1Light-Water SMRs
- 9.2Sodium- and Lead-Cooled Fast Reactors
- 9.3High-Temperature Gas-Cooled Reactors
- 9.4Microreactors
- 9.5Molten Salt and Salt-Cooled Reactors
- 10Market by Power Rating
- 10.1Up to 100 MWe
- 10.2101 to 300 MWe
- 10.3Above 300 MWe
- 11Market by Component
- 11.1Development, Design and Licensing
- 11.2Nuclear Island Equipment
- 11.3Construction and Balance of Plant
- 11.4Fuel and Fuel Services
- 12Market by Application
- 12.1Utility Power Generation
- 12.2Data Centers and AI Campuses
- 12.3Industrial Process Heat and Cogeneration
- 12.4Remote, Off-Grid and Defense
- 12.5Marine and Floating Power
- 13Market by Ownership Model
- 13.1Utility-Owned
- 13.2Developer-Owned with Offtake Agreements
- 13.3Government and Research Programs
- 14DC Exclusive: Reactor Type × Application Matrix
- 14.1Reactor Type × Application Matrix, 2025
- 14.2Data Center Share by Reactor Type
- 14.3Implications for Vendors and Offtakers
- 15Market by Region
- 15.1North America (United States, Canada)
- 15.2Europe (Russia, United Kingdom, Poland, Romania, Czech Republic, Rest of Europe)
- 15.3Asia Pacific (China, South Korea, Japan, Rest of Asia Pacific)
- 15.4Latin America (Argentina, Rest of Latin America)
- 15.5Middle East and Africa (Saudi Arabia, Rest of Middle East and Africa)
- 15.6Top 12 Countries, 2025 and 2035
- 16Regional Cross-Sections
- 16.1Region × Reactor Type, 2025 and 2035
- 16.2Region × Application, 2025 and 2035
- 17Forecast Scenarios
- 17.1Base, Low and High Cases to 2035
- 17.2Sensitivity to Construction Starts
- 17.3Sensitivity to Cost per kW
- 18Competitive Landscape
- 18.1Spending Concentration Among Leading Suppliers, 2025
- 18.2Offtake Agreements with Data Center Operators
- 18.3Licensing Milestones, 2025-2026
- 18.4Financing Rounds and Public Funding
- 19Company Profiles
- 19.1GE Vernova Hitachi Nuclear Energy
- 19.2China National Nuclear Corporation (CNNC)
- 19.3Rosatom
- 19.4NuScale Power
- 19.5Rolls-Royce SMR
- 19.6Holtec International
- 19.7TerraPower
- 19.8X-energy
- 19.9Kairos Power
- 19.10Oklo
- 19.11Westinghouse Electric Company
- 19.12BWX Technologies
- 19.13Korea Hydro & Nuclear Power
- 19.14Doosan Enerbility
- 20Analyst Recommendations
- 20.1For Reactor Vendors and Equipment Suppliers
- 20.2For Data Center Operators and Offtakers
- 20.3For Utilities and Investors
- Fig. 1Small Modular Reactor Market Size, 2020-2035
- Fig. 2Construction Starts by Year, 2015-2035
- Fig. 3Blended Construction Cost per kW by Start Year
- Fig. 4Market by Component, 2025 and 2035
- Fig. 5Market Share by Reactor Type, 2025 and 2035
- Fig. 6Market Share by Application, 2025 and 2035
- Fig. 7Reactor Type × Application Matrix, 2025
- Fig. 8Market by Region, 2025 and 2035
- Fig. 9Top 12 Countries, 2025
- Fig. 10Forecast Scenarios, 2025-2035
- Table 1Report Attributes
- Table 2Blended Construction Cost per kW and Construction Starts
- Table 3Market Size, 2020-2035
- Table 4Market by Reactor Type, 2025 and 2035
- Table 5Market by Power Rating, 2025 and 2035
- Table 6Market by Component, 2025 and 2035
- Table 7Market by Application, 2025 and 2035
- Table 8Market by Ownership Model, 2025 and 2035
- Table 9Reactor Type × Application Matrix, 2025
- Table 10Market by Region, 2025 and 2035
- Table 11Top 12 Countries, 2025 and 2035
- Table 12Forecast Scenarios, 2035
- Table 13Licensing Milestones and Offtake Agreements, 2024-2026
- Table 14Company Profiles: Designs and Projects
About this report
Written by Satyabrat Rajawat and reviewed by Deepti Agrawal, Senior Editor, Research. Figures are built top-down and bottom-up and reconciled before publication, with 2025 as the base year.
Read our methodologyHow we built this
- Historical period2020-2024
- Base year2025
- Forecast period2026-2035
- Sizing approachTop-down + bottom-up
Need more than the report?
Advisory on this market
Due diligence, site selection and market entry work, by the analysts who wrote this report.
See consulting servicesFrequently asked questions
USD 4.92 billion in 2025, rising to USD 47.11 billion by 2035. DC Market Insights estimates the market at USD 1.61 billion in 2020.
25.36% a year from 2025 to 2035, after 24.95% a year between 2020 and 2025, as construction spending overtakes design and licensing work (DC Market Insights estimate).
Light-water SMRs, with USD 2.56 billion or 52.0% of 2025 spending. Molten salt and salt-cooled reactors grow fastest among reactor types at 29.01% a year.
USD 467.11 million in 2025, or 9.5% of the market, rising to USD 10.36 billion by 2035. Data centers and AI campuses are the fastest-growing application at 36.34% a year.
About USD 12,500 per kW for projects started in 2025, falling to USD 8,584 per kW for 2035 starts, according to DC Market Insights estimates covering construction and equipment.
North America, with USD 1.99 billion or 40.5% of 2025 spending. The Middle East and Africa grows fastest at 28.79% a year.
USD 1.48 billion in the United States, or 30.1% of 2025 spending, followed by China at USD 875.22 million. Saudi Arabia grows fastest at 31.39% a year (DC Market Insights estimate).
CNNC, Rosatom and GE Vernova Hitachi together account for about 40% of 2025 spending (DC Market Insights estimate). NuScale, Rolls-Royce SMR, Holtec, TerraPower, X-energy, Kairos Power and Oklo also compete.
Licences, delivery and payment
Which licence should I choose?
Single User is a view-only PDF for one person. Multi User adds a printable PDF and the Excel data for unlimited users at one location. Enterprise covers your whole company and includes 100 free analyst hours.
How and when will I receive the report?
By email, within 24–48 business hours of payment, in the formats of your licence.
How can I pay?
Securely through PayPal: with a PayPal account, a debit or credit card, or PayPal Pay Later where available. Prices are in US dollars.
Can I see a sample first?
Yes. Request a free sample and we will email it to you.
Can the report be tailored to my needs?
Yes. We can add countries, segments or data cuts. Talk to an analyst about the scope you need.
Can I get an invoice or pay against a purchase order?
Write to sales@dcmarketinsights.com and our team will help.