
High-Frequency Trading Server Market Size, Share & Forecast to 2035
Market at a glance
The High-Frequency Trading Server market was worth USD 1,140.0 million in 2025 and is forecast to reach USD 2,540.0 million by 2035, growing at a 8.39% CAGR. North America accounts for 45.8% of the market.
 By Amit Jain, Senior Consultant, ICT & Emerging Technologies
 Reviewed by Deepti Agrawal
Last updated 10 Oct 2026
Base year 2025 PDF + Excel
Reviewed by Deepti Agrawal
Last updated 10 Oct 2026
Base year 2025 PDF + Excel
Source: DC Market Insights analysis
Key findings
Record Trading Revenues Fund a 3.5-Year Server Refresh Cycle
Overclocked Servers Move to Liquid Cooling as Clock Speeds Reach 5.0GHz
Trading Volumes Swing Spending by More Than 10% a Year
India Grows from USD 59.06 Million to USD 218.56 Million by 2035
What is inside the report
- 01Introduction
- 02Research Methodology
- 03Executive Summary
- 04Market Dynamics
- 05Pricing Analysis
- 06Standards and Regulation
- 07Supply Chain Analysis
- 08Market Size and Forecast
- 09Market by Product Type
- 10Market by Cooling Type
- 21chapters
- 2020-2024Historical period
- 2026-2035Forecast period
- 11Companies profiled
Regional insights
- North America45.8%
- Europe24.5%
- Asia Pacific24.2%
- Latin America3.1%
- Middle East and Africa2.4%
Segmentation
Companies profiled
- Hypertec
- Blackcore Technologies
- Dell Technologies
- Hewlett Packard Enterprise
- Supermicro
- AMD
- Intel
- Exegy
- Alpha Data
- Cisco
- Arista Networks
Recent developments
AMD set a STAC-T0 record of 13.9 nanoseconds tick-to-trade latency using the Alveo UL3524 in a Dell PowerEdge R7525 server (Source: AMD blog).
AMD launched the Alveo UL3422 accelerator for electronic trading, and Hypertec's HF X410R-G6 server was certified to support it (Source: AMD press release).
Exegy launched Nexus, a market data platform that lets trading strategies respond to aggregated market data in under 350 nanoseconds (Source: Exegy announcement).
AMD introduced the Solarflare X4 Ethernet adapters, with up to 40% lower latency than previous Solarflare generations (Source: AMD blog).
Exegy acquired NovaSparks (Source: Exegy announcement).
NSE issued its circular for Phase 15 of its colocation capacity expansion (Source: NSE circular).
Full analysis
The High-Frequency Trading Server Market covers the overclocked and frequency-optimized servers, FPGA-accelerated servers and trading appliances, and standard low-latency rack servers that electronic trading firms, banks, hedge funds and exchanges install in exchange colocation halls, financial data centers and their own server rooms. DC Market Insights values the global High-Frequency Trading Server Market at USD 1.14 billion in 2025 and forecasts USD 2.54 billion by 2035, a CAGR of 8.39%. The 2025 value is built from the installed base: about 15,000 trading racks worldwide at an average of 7.5 servers per rack give about 112,500 servers in service, and a 3.5-year refresh cycle plus servers for new racks add up to about 39,800 servers shipped in 2025 at a blended USD 28,564 per server. Liquid-cooled servers are the fastest-growing segment at 20.09% a year because overclocked processors now run past the heat limits of air cooling, and Asia Pacific is the fastest-growing region at 10.21% a year as India’s exchanges expand colocation capacity, with NSE targeting more than 4,000 full-rack-equivalent racks.
Executive Summary
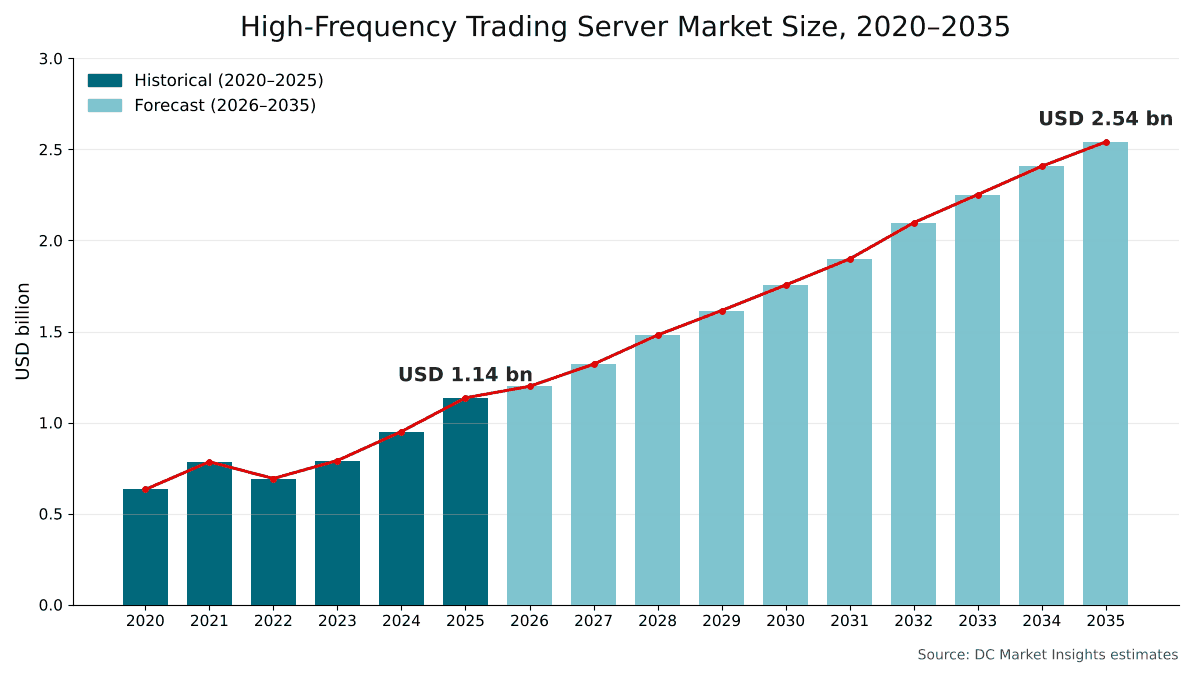
The Global High-Frequency Trading Server Market size was valued at USD 632.63 million in 2020, reached USD 1.14 billion in 2025, and is anticipated to reach USD 2.54 billion by 2035, at a CAGR of 8.39% during the forecast period.
| Report attribute | Details |
|---|---|
| Historical Period | 2020-2024 |
| Base Year | 2025 |
| Forecast Period | 2026-2035 |
| High-Frequency Trading Server Market Size 2025 | USD 1.14 Billion |
| High-Frequency Trading Server Market, CAGR | 8.39% |
| High-Frequency Trading Server Market Size 2035 | USD 2.54 Billion |
The market grew at 12.42% a year between 2020 and 2025, but not in a straight line. DC Market Insights estimates spending of USD 784.79 million in 2021, a fall to USD 692.77 million in 2022 as trading volumes cooled, and a recovery to USD 950.87 million in 2024. 2025 added 19.5% over 2024 as record trading revenues at the largest market makers funded faster hardware refreshes. Growth slows to 8.39% a year from 2025 to 2035 because the installed base is already large in the United States and Europe; most new demand comes from refresh cycles, from FPGA and liquid-cooled servers that cost more per unit, and from new colocation capacity in Asia.
Market Scope: What Does the High-Frequency Trading Server Market Cover?
The High-Frequency Trading Server Market covers server hardware bought to run latency-sensitive trading workloads, valued at first sale in current US dollars, with 2025 as the base year and forecasts to 2035. DC Market Insights sizes it at USD 1.14 billion in 2025.
Included. Overclocked and frequency-optimized servers built around high-clock processors, FPGA-accelerated servers and trading appliances, including the field-programmable gate array (FPGA) cards and low-latency network interface cards (NICs) shipped inside them, standard low-latency rack servers that run market-data handlers, order gateways and pre-trade risk checks inside the colocation cage, and the liquid-cooling hardware integrated into the server chassis.
Excluded. Network switches and Layer 1 switching devices sold as separate boxes, graphics processing unit (GPU) clusters used for research and model training away from the exchange, storage, software licenses, market-data fees, colocation and connectivity fees charged by exchanges, and installation services.
How the segments fit together. The product, cooling, end-user, asset-class and deployment splits each re-cut the same USD 1.14 billion. FPGA cards and low-latency NICs are counted inside the server they ship in, so the FPGA-accelerated segment carries the card value.
Market Drivers: What Drives the High-Frequency Trading Server Market?
Three drivers explain most of the growth in the High-Frequency Trading Server Market: trading revenues that fund refresh cycles of about 3.5 years, new exchange colocation capacity, and competition measured in nanoseconds.
Record Trading Revenues Fund a 3.5-Year Server Refresh Cycle
Trading revenues at several large market makers reached records in 2025. Bloomberg reported that Citadel Securities posted a record USD 12.2 billion in trading revenue in 2025, and Hedgeweek, citing Reuters, reported USD 39.6 billion of net trading revenue for Jane Street and about USD 12.3 billion for Hudson River Trading over the same period. IMC reported net trading revenue of USD 3.12 billion, up 40%. Listed firms show how that revenue turns into hardware: Virtu Financial, which reported total revenues of USD 3.63 billion for 2025, depreciates furniture, fixtures and equipment over three to seven years and booked USD 64.42 million of depreciation and amortization in 2025. DC Market Insights models a refresh cycle of 3.5 years for servers on the latency path in 2025, shortening to 3.3 years by 2035, which generates about 30,900 replacement servers in 2025.
Exchange Colocation Capacity Grows from 15,000 to About 24,400 Trading Racks
New racks in exchange data centers are filled with trading servers. The National Stock Exchange of India (NSE) said in February 2025 that its expansion brings total colocation capacity to more than 1,200 racks, with over 200 members subscribing, and that it intends to add approximately 2,000 additional racks over the next two years toward more than 4,000. NSE issued its Phase 15 colocation expansion circular in April 2026. BSE, with 300 colocation racks in mid-2025, planned to add 200 more. DC Market Insights estimates about 15,000 racks used for electronic trading worldwide in 2025 and forecasts about 24,400 by 2035, with servers per rack rising from 7.5 to 8.5 as cabinets get more power.
Nanosecond Competition Pushes Spend per Server to USD 28,564
Trading firms compete on latency. A Financial Conduct Authority (FCA) occasional paper on latency arbitrage found that the top 3 firms win about 55% of races. That concentration rewards any hardware that saves time: AMD reported a STAC-T0 tick-to-trade latency record of 13.9 nanoseconds in June 2024, using its Alveo UL3524 card in a Dell PowerEdge R7525 server. DC Market Insights estimates the blended price of a trading server at USD 28,564 in 2025, up from USD 24,065 in 2020, because FPGA-accelerated units rise from 9.0% to 13.0% of shipments and overclocked servers move to liquid cooling.
Market Trends: How Are Trading Servers Changing?
The High-Frequency Trading Server Market is moving toward liquid-cooled overclocked processors and FPGA cards that fit standard servers. AMD’s Solarflare X4 adapters, introduced in October 2025, claim up to 40% lower latency than previous Solarflare generations.
Overclocked Servers Move to Liquid Cooling as Clock Speeds Reach 5.0GHz
Overclocking is now a product, not a workshop trick. Hypertec’s ORION HF X410R-G6 1U trading server runs a Xeon W-2475X at up to 5.0GHz on 20 cores, and its 2U ORION HFX420R-G6 is liquid-cooled and overclocked up to 4.8GHz. Hypertec’s next generation, the ORION HFX410R-G7, offers closed-loop and external open-loop liquid cooling with Intel Xeon 600 processors of up to 86 cores. Blackcore Technologies showed an overclocked Xeon w7-2595X running at 4.7GHz on all 26 cores in a presentation published by STAC in October 2024. DC Market Insights forecasts liquid-cooled servers to grow from USD 155.61 million in 2025 to USD 970.81 million in 2035.
FPGA Cards Shrink to Fit Standard 1U Servers
FPGA accelerators that once needed custom appliances now fit ordinary servers. AMD launched the Alveo UL3524 in September 2023 with less than 3 nanoseconds of FPGA transceiver latency, and in October 2024 launched the Alveo UL3422, which AMD describes as half the size of the UL3524 with equivalent performance, in a slim full-height, half-length form factor. Hypertec’s HF X410R-G6 server is certified to support the UL3422. DC Market Insights forecasts FPGA-accelerated servers and appliances to grow at 9.43% a year to USD 1.09 billion by 2035.
Market Challenges: What Holds the High-Frequency Trading Server Market Back?
Trading-cycle volatility and the cost and power of the fastest hardware are the two constraints that DC Market Insights expects to slow the High-Frequency Trading Server Market.
Trading Volumes Swing Spending by More Than 10% a Year
Server budgets follow trading profits. DC Market Insights estimates that market spending fell 11.7% in 2022, from USD 784.79 million to USD 692.77 million, before recovering in 2023 and 2024.
An FPGA Card Can Cost More Than the Server It Sits In
CDW lists the AMD Alveo UL3422 accelerator card at USD 69,191.99, against USD 3,703 per processor at AMD’s 1,000-unit price for its 16-core EPYC 9175F. DC Market Insights therefore caps the FPGA share of shipments at 20.0% of units by 2035. Power is a second limit: CME Group offers colocation cabinets in three tiers of 4.25kW, 8.5kW or 17kW, and DC Market Insights judges that an overclocked server uses much of a low-tier cabinet’s power budget.
Market Opportunities: Where Are the New Revenue Pools?
The two largest new revenue pools in the High-Frequency Trading Server Market are India’s colocation build-out, growing at 13.98% a year, and the move of overclocked fleets to liquid cooling.
India Grows from USD 59.06 Million to USD 218.56 Million by 2035
India is the fastest-growing large country market. NSE plans to scale to more than 4,000 full-rack-equivalent racks, and NSE offers a standard 42U rack with 6KVA of power in its earlier phases and a two-rack high-density option with 15KVA in total. The Securities and Exchange Board of India (SEBI) now requires every algo order to be tagged with a unique identifier provided by the exchange, which brings more algorithmic brokers into regulated, exchange-hosted infrastructure. DC Market Insights expects Indian spending to reach USD 218.56 million in 2035.
Liquid Cooling Opens a USD 970.81 Million Segment by 2035
Liquid-cooled servers require cabinet plumbing that colocation providers must approve, which favors vendors that ship complete, tested systems. Cooling is part of a wider shift in server design toward purpose-built hardware, covered in our White Box Server Market report.
Pricing: How Much Does a High-Frequency Trading Server Cost?
A trading server sold for a blended average of USD 28,564 in 2025, ranging from USD 13,533 for a standard low-latency rack server to USD 86,022 for an FPGA-accelerated server or appliance. These are DC Market Insights estimates of the average selling price per complete server, including any FPGA card and NIC shipped inside it.
| Average selling price per server (USD) | 2020 | 2025 | 2030 | 2035 |
|---|---|---|---|---|
| Overclocked and frequency-optimized server | 21,000 | 23,414 | 26,105 | 29,106 |
| FPGA-accelerated server or appliance | 90,000 | 86,022 | 82,220 | 78,586 |
| Standard low-latency rack server | 12,500 | 13,533 | 14,650 | 15,860 |
| Blended average, all servers | 24,065 | 28,564 | 32,953 | 36,485 |
Component prices explain the gap. CDW lists the Alveo UL3422 at USD 69,191.99 and the Alveo X3522PV NIC at USD 3,447.99, and AMD lists the EPYC 9175F, with 16 cores, up to 5GHz boost and 512MB of L3 cache, at USD 3,703 per unit in 1,000-unit quantities. DC Market Insights assumes that volume buyers pay less than reseller prices, and models the FPGA-accelerated average falling about 0.9% a year as cards shrink, while overclocked server prices rise about 2.2% a year with liquid cooling.
Standards and Regulation: Which Rules Shape Trading Server Design?
Four sets of rules shape what a trading server must do: clock synchronization rules, algorithmic-trading controls, market-access risk checks and operational-resilience law.
Clock synchronization. Under the European Union’s MiFID II, Commission Delegated Regulation (EU) 2017/574 (RTS 25) set a maximum divergence from Coordinated Universal Time (UTC) of 100 microseconds for activity using high-frequency algorithmic trading techniques, with timestamp granularity of 1 microsecond or better. EUR-Lex lists the 2017 text as no longer in force from 1 March 2026, and the European Securities and Markets Authority (ESMA) notes that MiFIR Article 22c will apply when a revised RTS 25 starts applying. In the United States, FINRA Rule 6820 requires clocks within a 50-millisecond tolerance of the atomic clock. Servers meet these limits with the IEEE 1588-2019 Precision Time Protocol (PTP), which supports synchronization accuracy in the sub-microsecond range.
Algorithmic trading controls. Commission Delegated Regulation (EU) 2017/589 (RTS 6) requires firms to run high messaging volume tests based on the highest number of messages received and sent, and sets order-record duties for firms that use high-frequency techniques. These tests size servers for peak load, not average load.
Market access. The US Securities and Exchange Commission (SEC) Rule 15c3-5 requires broker-dealers to keep direct and exclusive control of their financial and regulatory risk management controls, which puts pre-trade risk checks inside the latency path and onto the trading server or FPGA.
Resilience and audit. The EU Digital Operational Resilience Act (DORA) has applied since 17 January 2025, and SEBI’s algorithmic trading framework applies to all brokers from 1 April 2026. Trading performance is benchmarked with STAC-T0, which evaluates the tick-to-trade network-I/O latency of a trading platform.
Market Segmentation: Which Segment Leads the High-Frequency Trading Server Market?
Overclocked and frequency-optimized servers lead the High-Frequency Trading Server Market with 46.5% of 2025 value, proprietary trading firms and market makers lead buyers with 56.4%, and exchange colocation leads deployment with 62.7%. Liquid-cooled servers are the fastest-growing segment at 20.09% a year, because each new generation of overclocked processors produces more heat than an air-cooled 1U chassis can remove.
By Product Type: Overclocked Servers Lead with 46.5%
| Product type | 2025 (USD billion) | Share 2025 | 2035 (USD billion) | CAGR 2025-2035 |
|---|---|---|---|---|
| Overclocked and Frequency-Optimized Servers | 0.53 | 46.5% | 1.24 | 8.88% |
| FPGA-Accelerated Servers and Appliances | 0.44 | 39.2% | 1.09 | 9.43% |
| Standard Low-Latency Rack Servers | 0.16 | 14.3% | 0.21 | 2.57% |
FPGA-accelerated servers and appliances grow fastest among product types at 9.43% a year. Standard low-latency rack servers grow only 2.57% a year as gateways and risk engines move onto FPGA cards.
By Cooling Type: Air-Cooled Servers Lead with 86.3%
Air-cooled servers are worth USD 980.24 million in 2025 and USD 1.57 billion by 2035, but their share falls to 61.8%. Liquid-cooled servers grow from 13.7% to 38.2% of value.
By End User: Proprietary Trading Firms Lead with 56.4%
| End user | 2025 (USD billion) | Share 2025 | 2035 (USD billion) | CAGR 2025-2035 |
|---|---|---|---|---|
| Proprietary Trading Firms and Market Makers | 0.64 | 56.4% | 1.51 | 8.93% |
| Banks and Broker-Dealers | 0.24 | 20.7% | 0.43 | 6.15% |
| Hedge Funds and Asset Managers | 0.15 | 13.3% | 0.36 | 9.02% |
| Exchanges and Trading Venues | 0.11 | 9.6% | 0.25 | 8.61% |
Hedge funds and asset managers grow fastest at 9.02% a year as systematic funds trade closer to the venue. Banks and broker-dealers grow slowest at 6.15% a year as more bank flow is internalized or routed through market makers.
By Asset Class: Equities Lead with 41.2%
Equities lead at USD 467.98 million in 2025, followed by futures and options at USD 338.48 million (29.8%), foreign exchange at USD 182.87 million (16.1%) and fixed income, crypto and other assets at USD 146.52 million (12.9%). Fixed income, crypto and other assets grow fastest at 9.51% a year, and futures and options gain 2.5 points of share by 2035. The Bank for International Settlements reported that electronic trading accounted for 59% of foreign exchange trading in its 2025 Triennial Survey.
By Deployment: Exchange Colocation Leads with 62.7%
Exchange colocation is worth USD 712.18 million in 2025 and USD 1.54 billion by 2035. Proximity hosting in third-party financial data centers grows fastest at 9.79% a year, because one cage in a multi-venue hub can reach several exchanges at once. Proprietary and on-premises data centers hold 13.2%, worth USD 149.93 million.
DC Exclusive: The Trading Rack Refresh Model and Product × Buyer Matrix
At USD 293.81 million in 2025, overclocked servers bought by proprietary trading firms and market makers are the largest cell of the matrix and 25.9% of all spending on trading servers. The matrix below cross-tabulates what is bought against who buys it. It is a DC Market Insights model, not a shipment count, built from 59 inputs: 16 annual trading-rack cohorts (2020 to 2035), 16 servers-per-rack values, 3 refresh-cycle settings, 6 historical demand-cycle factors, 3 unit-mix curves, 3 price curves and 12 product-by-buyer weights.
| 2025, USD million | Overclocked and Frequency-Optimized | FPGA-Accelerated | Standard Low-Latency | Total |
|---|---|---|---|---|
| Proprietary Trading Firms and Market Makers | 293.81 | 290.85 | 55.96 | 640.62 |
| Banks and Broker-Dealers | 111.89 | 67.15 | 56.08 | 235.12 |
| Hedge Funds and Asset Managers | 81.46 | 41.81 | 27.80 | 151.07 |
| Exchanges and Trading Venues | 41.22 | 44.88 | 22.94 | 109.04 |
| Total | 528.38 | 444.69 | 162.78 | USD 1.14 billion |
Proprietary trading firms spend 45.4% of their budget on FPGA-accelerated servers, against 28.6% for banks and broker-dealers and 27.7% for hedge funds. Banks spend 23.9% of their budget on standard low-latency rack servers, the slowest-growing product, so a vendor selling mainly to banks sells into the slowest-growing part of the market. Exchanges and trading venues buy more FPGA hardware than overclocked servers.
The trading rack refresh model has two inputs that any reader can check: the number of racks used for trading (about 15,000 in 2025) and how often their servers are replaced (every 3.5 years in 2025). Replacement servers plus servers for new racks, multiplied by the average price per server, give the market. The model and its assumptions are explained on our research methodology page.
Regional Insights: Which Region Leads the High-Frequency Trading Server Market?
North America leads the High-Frequency Trading Server Market with 45.8% of 2025 value, and Asia Pacific is the fastest-growing region at 10.21% a year, because Indian exchanges are expanding colocation capacity in phases.
North America Leads with 45.8% Share
North American trading firms spent USD 520.22 million on trading servers in 2025, and the region is forecast to reach USD 1.08 billion in 2035, a CAGR of 7.58%. Nasdaq’s primary data center in Carteret, New Jersey covers 113,944 square feet with cabinets from 2.88kW to 17.3kW, and CME Group’s colocation runs in a 428,000-square-foot facility in Aurora, Illinois, owned and operated by CyrusOne. CME’s annual report states that Google Cloud is developing a new private cloud region and a colocation facility in Aurora. North America loses 3.3 points of share by 2035 as Asia grows faster.
Europe Holds 24.5% Share
Europe is worth USD 278.28 million in 2025 and USD 581.98 million by 2035, a CAGR of 7.66%. DC Market Insights places most of the region’s trading racks in London, Frankfurt and Amsterdam. Deutsche Börse describes itself as one of many customers in the Equinix data center that hosts its colocation, and Flow Traders reported technology expenses of EUR 70.6 million in 2025, with 2026 fixed operating expenses expected at EUR 220-230 million, driven by continued technology investments.
Asia Pacific Holds 24.2% Share and Grows Fastest
Asia Pacific is worth USD 274.88 million in 2025 and USD 726.84 million by 2035, growing at 10.21% a year. Hong Kong Exchanges and Clearing (HKEX) states that its Hosting Data Centre can support up to 1,200 racks of server space, and NSE and BSE in India are adding racks in phases. Japan, Hong Kong SAR, India, China, Singapore and Australia together account for 23.2% of global value in 2025.
Latin America Holds 3.1% Share
Latin America is worth USD 35.21 million in 2025 and USD 86.41 million by 2035, a CAGR of 9.39%. In the DC Market Insights allocation, Brazil accounts for 67.7% of the region’s 2025 value.
Middle East and Africa Holds 2.4% Share
The Middle East and Africa is worth USD 27.26 million in 2025 and USD 66.08 million by 2035, a CAGR of 9.26%, from a small base.
Country Analysis: Which Countries Buy the Most Trading Servers?
The United States is the largest country market for trading servers at USD 464.56 million in 2025, 40.9% of global value, followed by the United Kingdom at USD 118.13 million (10.4%) and Japan at USD 69.29 million (6.1%). The 12 largest countries account for 87.7% of 2025 spending.
| Rank | Country | Region | 2025 (USD million) | Share 2025 | 2035 (USD million) | CAGR 2025-2035 |
|---|---|---|---|---|---|---|
| 1 | United States | North America | 464.56 | 40.9% | 955.56 | 7.48% |
| 2 | United Kingdom | Europe | 118.13 | 10.4% | 236.35 | 7.18% |
| 3 | Japan | Asia Pacific | 69.29 | 6.1% | 157.57 | 8.56% |
| 4 | India | Asia Pacific | 59.06 | 5.2% | 218.56 | 13.98% |
| 5 | Germany | Europe | 52.25 | 4.6% | 106.74 | 7.40% |
| 6 | Hong Kong SAR | Asia Pacific | 48.84 | 4.3% | 111.82 | 8.64% |
| 7 | Canada | North America | 47.71 | 4.2% | 104.20 | 8.12% |
| 8 | China | Asia Pacific | 38.62 | 3.4% | 99.11 | 9.88% |
| 9 | Singapore | Asia Pacific | 28.40 | 2.5% | 76.24 | 10.38% |
| 10 | Netherlands | Europe | 26.12 | 2.3% | 57.44 | 8.20% |
| 11 | Brazil | Latin America | 23.85 | 2.1% | 60.99 | 9.84% |
| 12 | Australia | Asia Pacific | 19.31 | 1.7% | 45.75 | 9.01% |
India is the fastest-growing country market at 13.98% a year, ahead of Singapore at 10.38%, as NSE and BSE expand colocation capacity. The country figures are a DC Market Insights allocation of the regional totals, weighted by each country’s estimated share of exchange colocation racks and trading activity.
Forecast Scenarios: How Could the 2035 Forecast Change?
The High-Frequency Trading Server Market reaches USD 2.54 billion by 2035 in the base case, with a range of USD 2.09 billion to USD 2.99 billion across the low and high scenarios.
| Scenario | Assumption from 2026 | 2035 (USD billion) | CAGR 2025-2035 |
|---|---|---|---|
| Low | Trading-rack growth 20% slower than base; refresh cycle stays at 3.5 years; FPGA share of units capped at 18% | 2.09 | 6.28% |
| Base | Trading racks grow from 15,000 to about 24,400; refresh cycle shortens to 3.3 years; FPGA share of units reaches 20% | 2.54 | 8.39% |
| High | Trading-rack growth 15% faster than base as India and other colocation programs deliver on plan; refresh cycle shortens to 3.0 years | 2.99 | 10.16% |
The low case reflects a long period of low market volatility, when trading revenues fall and firms stretch refresh cycles. The high case assumes new colocation programs arrive on schedule.
Competitive Insights: Who Leads the High-Frequency Trading Server Market?
- Hypertec
- Blackcore Technologies
- Dell Technologies
- Hewlett Packard Enterprise
- Supermicro
- AMD
- Intel
- Exegy
- Alpha Data
- Cisco
- Arista Networks
DC Market Insights estimates that the five largest suppliers of complete trading servers and appliances hold about 45% of 2025 value, with the rest split between general-purpose server makers and in-house builds by the largest trading firms. The estimate is based on vendor certifications, named launch partners and published STAC benchmark systems. Hypertec has built multiple generations of its ORION line since it entered the finance industry around 2011-2012, and Blackcore Technologies designs and builds overclocked servers for trading platforms. Dell Technologies supplied the PowerEdge R7525 used in AMD’s 13.9-nanosecond STAC-T0 record. AMD supplies EPYC processors, Alveo FPGA cards and Solarflare NICs, and named Alpha Data, Exegy and Hypertec as partners with UL3524 solutions at launch. Intel launched its Xeon 600 processors for workstation, with up to 86 cores, in February 2026. Exegy, Cisco and Arista Networks sell FPGA platforms, SmartNICs and switching for trading. Dell, Hewlett Packard Enterprise and Supermicro reported USD 19.51 billion of traditional servers and networking revenue for fiscal 2026, USD 17.75 billion of server revenue for fiscal 2025 and USD 22.00 billion of net sales for fiscal 2025, respectively, so trading servers are a niche inside each general-purpose vendor’s business. Smaller form factors used in some trading roles are covered in our Micro Server Market report.
Recent Developments
- In June 2024, AMD set a STAC-T0 record of 13.9 nanoseconds tick-to-trade latency using the Alveo UL3524 in a Dell PowerEdge R7525 server (Source: AMD blog).
- In October 2024, AMD launched the Alveo UL3422 accelerator for electronic trading, and Hypertec’s HF X410R-G6 server was certified to support it (Source: AMD press release).
- In June 2025, Exegy launched Nexus, a market data platform that lets trading strategies respond to aggregated market data in under 350 nanoseconds (Source: Exegy announcement).
- In October 2025, AMD introduced the Solarflare X4 Ethernet adapters, with up to 40% lower latency than previous Solarflare generations (Source: AMD blog).
- In January 2026, Exegy acquired NovaSparks (Source: Exegy announcement).
- In April 2026, NSE issued its circular for Phase 15 of its colocation capacity expansion (Source: NSE circular).
We follow these launches, deals and colocation expansions as they happen in our data center industry updates.
Methodology: How We Built the High-Frequency Trading Server Market Model
The High-Frequency Trading Server Market is a DC Market Insights model with bound checks, because no supplier discloses its sales of trading servers. DC Market Insights built it bottom-up from 16 annual cohorts of trading racks (2020 to 2035), each multiplied by servers per rack (7.0 in 2020, 7.5 in 2025, 8.5 in 2035) to give the installed base. Annual shipments are replacements on a refresh cycle of 3.6 years to 2022, 3.5 years to 2027, 3.4 years to 2031 and 3.3 years from 2032, plus servers for new racks, adjusted for the trading cycle in 2020 to 2025. Shipments were split into 3 priced product types, 2 cooling types, 4 end users, 4 asset classes, 3 deployment models and 5 regions, and every split sums to the market total. These inputs are DC Market Insights assumptions, informed by the published rack counts and power ratings of NSE, BSE, HKEX, CME Group and Nasdaq. Three bound checks frame the result: (a) a ceiling from server vendor disclosures, where the 2025 market equals 1.9% of the USD 59.26 billion combined from Dell’s fiscal 2026 traditional servers and networking revenue, Hewlett Packard Enterprise’s fiscal 2025 server revenue and Supermicro’s fiscal 2025 net sales; (b) a scale check from Virtu Financial, whose depreciation and amortization equaled 1.77% of revenue in 2025, which applied to the USD 70.85 billion of 2025 revenue reported by the company or the press for Jane Street, Citadel Securities, Hudson River Trading, IMC and Virtu gives USD 1.26 billion of annual depreciation across all equipment and software, the same order as a USD 1.14 billion market that also includes banks, exchanges and smaller firms; and (c) a floor from India, where the 1,600 colocation racks of NSE and BSE in 2025, at 7.5 servers per rack, a 3.5-year refresh and the standard server price, need at least USD 46.40 million a year, below the USD 59.06 million India value. Virtu Financial’s results are filed with the US Securities and Exchange Commission. The analyst named on this page built the model, and the reviewer checked the arithmetic, the sources and the dates before publication.
Table of contents
- 01Introduction
- 1.1Market Definition and Scope
- 1.2Research Objectives
- 1.3Currency, Units and Years Covered
- 1.4Stakeholders
- 02Research Methodology
- 2.1Trading Rack Refresh Model
- 2.2Bound Checks
- 2.3Primary and Secondary Sources
- 2.4Assumptions and Limitations
- 03Executive Summary
- 3.1Market Snapshot, 2025 and 2035
- 3.2Key Findings
- 3.3Analyst Viewpoint
- 04Market Dynamics
- 4.1Drivers
- 4.2Trends
- 4.3Challenges
- 4.4Opportunities
- 05Pricing Analysis
- 5.1Average Selling Price per Server by Product Type, 2020-2035
- 5.2Component Price References: Processors, FPGA Cards and NICs
- 06Standards and Regulation
- 6.1Clock Synchronization: MiFID II RTS 25, FINRA Rule 6820 and IEEE 1588
- 6.2Algorithmic Trading Controls: RTS 6
- 6.3Market Access: SEC Rule 15c3-5
- 6.4Operational Resilience: DORA and SEBI Algo Framework
- 6.5Benchmarks: STAC-T0
- 07Supply Chain Analysis
- 7.1Processor and FPGA Suppliers
- 7.2Server Builders and Integrators
- 7.3Colocation Providers and Exchanges
- 7.4Trading Firms and End Users
- 08Market Size and Forecast
- 8.1Market Size, 2020-2035
- 8.2Installed Base of Trading Racks and Servers, 2020-2035
- 8.3Server Shipments, 2020-2035
- 09Market by Product Type
- 9.1Overclocked and Frequency-Optimized Servers
- 9.2FPGA-Accelerated Servers and Appliances
- 9.3Standard Low-Latency Rack Servers
- 10Market by Cooling Type
- 10.1Air-Cooled Servers
- 10.2Liquid-Cooled Servers
- 11Market by End User
- 11.1Proprietary Trading Firms and Market Makers
- 11.2Banks and Broker-Dealers
- 11.3Hedge Funds and Asset Managers
- 11.4Exchanges and Trading Venues
- 12Market by Asset Class
- 12.1Equities
- 12.2Futures and Options
- 12.3Foreign Exchange
- 12.4Fixed Income, Crypto and Other
- 13Market by Deployment
- 13.1Exchange Colocation
- 13.2Proximity Hosting in Financial Data Centers
- 13.3Proprietary and On-Premises Data Centers
- 14DC Exclusive: Trading Rack Refresh Model and Product × Buyer Matrix
- 14.1Matrix of Product Type by End User, 2025
- 14.2Model Inputs
- 15Market by Region
- 15.1North America: United States, Canada
- 15.2Europe: United Kingdom, Germany, Netherlands, Rest of Europe
- 15.3Asia Pacific: Japan, India, Hong Kong SAR, China, Singapore, Australia, Rest of Asia Pacific
- 15.4Latin America: Brazil, Rest of Latin America
- 15.5Middle East and Africa
- 16Country Analysis
- 16.1Top 12 Countries, 2025 and 2035
- 16.2Fastest-Growing Countries
- 17Regional Cross-Sections
- 17.1Regional Share Shifts, 2025 and 2035
- 17.2Regional Growth Rates, 2025-2035
- 18Forecast Scenarios
- 18.1Low, Base and High Scenarios to 2035
- 18.2Key Swing Factors
- 19Competitive Landscape
- 19.1Market Concentration
- 19.2Competitive Positioning
- 19.3Recent Developments
- 20Company Profiles
- 20.1Hypertec
- 20.2Blackcore Technologies
- 20.3Dell Technologies
- 20.4Hewlett Packard Enterprise
- 20.5Supermicro
- 20.6AMD
- 20.7Intel
- 20.8Exegy
- 20.9Alpha Data
- 20.10Cisco
- 20.11Arista Networks
- 21Analyst Recommendations
- 21.1For Trading Firms
- 21.2For Server and Component Vendors
- 21.3For Exchanges and Colocation Providers
- Fig. 1High-Frequency Trading Server Market Size, 2020-2035
- Fig. 2Trading Racks and Installed Servers, 2020-2035
- Fig. 3Average Selling Price per Server by Product Type, 2020-2035
- Fig. 4Market Share by Product Type, 2025 and 2035
- Fig. 5Market Share by Cooling Type, 2025 and 2035
- Fig. 6Market Share by End User, 2025 and 2035
- Fig. 7Market Share by Asset Class, 2025 and 2035
- Fig. 8Market Share by Deployment, 2025 and 2035
- Fig. 9Product Type by End User Matrix, 2025
- Fig. 10Market by Region, 2025 and 2035
- Fig. 11Top 12 Countries, 2025
- Fig. 12Forecast Scenarios, 2035
- Table 1Report Attributes
- Table 2Market Size, 2020-2035
- Table 3Average Selling Price per Server, 2020-2035
- Table 4Market by Product Type, 2025 and 2035
- Table 5Market by Cooling Type, 2025 and 2035
- Table 6Market by End User, 2025 and 2035
- Table 7Market by Asset Class, 2025 and 2035
- Table 8Market by Deployment, 2025 and 2035
- Table 9Product Type by End User Matrix, 2025
- Table 10Market by Region, 2025 and 2035
- Table 11Top 12 Countries, 2025 and 2035
- Table 12Forecast Scenarios, 2035
- Table 13Bound Checks
- Table 14Recent Developments
About this report
Written by Amit Jain and reviewed by Deepti Agrawal, Senior Editor, Research. Figures are built top-down and bottom-up and reconciled before publication, with 2025 as the base year.
Read our methodologyHow we built this
- Historical period2020-2024
- Base year2025
- Forecast period2026-2035
- Sizing approachTop-down + bottom-up
Need more than the report?
Advisory on this market
Due diligence, site selection and market entry work, by the analysts who wrote this report.
See consulting servicesFrequently asked questions
USD 1.14 billion in 2025, rising to USD 2.54 billion by 2035. DC Market Insights estimates the market at USD 632.63 million in 2020.
8.39% a year from 2025 to 2035. Growth was faster, at 12.42% a year, between 2020 and 2025, as trading firms refreshed servers on a cycle of about 3.5 years and added colocation racks.
46.5% of 2025 value goes to overclocked and frequency-optimized servers. FPGA-accelerated servers and appliances grow fastest among product types at 9.43% a year.
USD 28,564 per server on a blended basis in 2025, from USD 13,533 for a standard low-latency rack server to USD 86,022 for an FPGA-accelerated server or appliance, according to DC Market Insights estimates.
45.8% of 2025 value, or USD 520.22 million, sits in North America. Asia Pacific grows fastest at 10.21% a year as Indian exchanges add colocation racks.
About 45% of 2025 value is held by the five largest suppliers of complete trading servers and appliances (DC Market Insights estimate). Hypertec, Blackcore Technologies, Dell Technologies, Hewlett Packard Enterprise, Supermicro, AMD, Intel, Exegy, Alpha Data, Cisco and Arista Networks compete.
20.09% a year for liquid-cooled servers, which grow from USD 155.61 million in 2025 to USD 970.81 million in 2035 as overclocked processors outgrow air cooling.
USD 464.56 million in the United States, or 40.9% of 2025 spending, followed by the United Kingdom at USD 118.13 million. India grows fastest at 13.98% a year (DC Market Insights estimate).
Licences, delivery and payment
Which licence should I choose?
Single User is a view-only PDF for one person. Multi User adds a printable PDF and the Excel data for unlimited users at one location. Enterprise covers your whole company and includes 100 free analyst hours.
How and when will I receive the report?
By email, within 24–48 business hours of payment, in the formats of your licence.
How can I pay?
Securely through PayPal: with a PayPal account, a debit or credit card, or PayPal Pay Later where available. Prices are in US dollars.
Can I see a sample first?
Yes. Request a free sample and we will email it to you.
Can the report be tailored to my needs?
Yes. We can add countries, segments or data cuts. Talk to an analyst about the scope you need.
Can I get an invoice or pay against a purchase order?
Write to sales@dcmarketinsights.com and our team will help.