
Data Center Blade Server Market Size, Share & Forecast to 2035
Market at a glance
The Data Center Blade Server market was worth USD 14.43 billion in 2025 and is forecast to reach USD 30.55 billion by 2035, growing at a 7.79% CAGR. North America accounts for 41.7% of the market.
 By Amit Jain, Senior Consultant, ICT & Emerging Technologies
 Reviewed by Deepti Agrawal
Last updated 10 Oct 2026
Base year 2025 PDF + Excel
Reviewed by Deepti Agrawal
Last updated 10 Oct 2026
Base year 2025 PDF + Excel
Source: DC Market Insights analysis
Key findings
GPU-Accelerated Blades Grow at 15.71% a Year to USD 15.32 Billion by 2035
Direct Liquid Cooling Reaches 46.5% of Blade Value by 2035
AI Rack Systems Grow Far Faster Than Traditional Servers
GPU Nodes in Enterprise Chassis Bring AI to Existing Blade Estates
What is inside the report
- 01Introduction
- 02Research Methodology
- 03Executive Summary
- 04Market Dynamics
- 05Pricing Analysis
- 06Standards and Regulation
- 07Supply Chain and Technology
- 08Market Size and Forecast
- 09Market by Component
- 10Market by Blade Type
- 23chapters
- 2020-2024Historical period
- 2026-2035Forecast period
- 11Companies profiled
Regional insights
- North America41.7%
- Asia Pacific26.1%
- Europe25%
- Latin America3.8%
- Middle East and Africa3.5%
Segmentation
Companies profiled
- Hewlett Packard Enterprise (HPE)
- Cisco Systems
- Dell Technologies
- Lenovo
- Supermicro (Super Micro Computer)
- Eviden
- Huawei
- H3C
- GIGABYTE
- AMD
- Intel
Recent developments
Cisco announced UCS X-Series Direct, a fabric interconnect module that connects a single X9508 chassis to a top-of-rack switch, with orders from May 2024 (Source: Cisco product FAQ).
AMD launched its 5th Gen EPYC server processors with 8 to 192 cores per CPU (Source: AMD press release).
JUPITER was inaugurated in Jülich, Germany, as Europe's new fastest supercomputer, with a booster built on Eviden's BullSequana XH3000 and about 24,000 NVIDIA GH200 Superchips (Source: EuroHPC Joint Undertaking announcement).
HPE detailed the GX440n, GX350a and GX250 blades for its Cray GX5000 supercomputing platform, with no new hardware expected before early 2027 and systems based on the new blades planned for HLRS and LRZ (Source: The Register report).
Supermicro unveiled a 6U SuperBlade for Intel Xeon 6900 processors with 5 air-cooled or 10 liquid-cooled nodes per chassis (Source: Supermicro press release).
Full analysis
The Data Center Blade Server Market covers compute blades that run inside a shared chassis, together with the blade chassis, enclosures, interconnect modules and management modules sold with them, for enterprise, cloud, telecom and supercomputing data centers. DC Market Insights values the global Data Center Blade Server Market at USD 14.43 billion in 2025 and forecasts USD 30.55 billion by 2035, a CAGR of 7.79%. The 2025 value is built from units and prices: about 720,000 enterprise compute blades at roughly USD 11,600 for a CPU blade and USD 52,000 for a blade accelerated by graphics processing units (GPUs) give USD 9.05 billion, about 18,700 supercomputing blades add USD 2.43 billion, and chassis and modules add USD 2.95 billion. AI training and inference is the fastest-growing application segment at 17.92% a year because new blade designs carry four to eight GPUs per node, and the Middle East and Africa is the fastest-growing region at 10.91% a year as, in the DC Market Insights view, national AI and research computing programs buy liquid-cooled blade systems from a small base.
Executive Summary
The Global Data Center Blade Server Market size was valued at USD 9.06 billion in 2020, reached USD 14.43 billion in 2025, and is anticipated to reach USD 30.55 billion by 2035, at a CAGR of 7.79% during the forecast period.
| Report attribute | Details |
|---|---|
| Historical Period | 2020-2024 |
| Base Year | 2025 |
| Forecast Period | 2026-2035 |
| Data Center Blade Server Market Size 2025 | USD 14.43 Billion |
| Data Center Blade Server Market, CAGR | 7.79% |
| Data Center Blade Server Market Size 2035 | USD 30.55 Billion |
DC Market Insights estimates that the market grew at 9.74% a year between 2020 and 2025, and that 2025 alone added 18.35% over 2024. Enterprise blade shipments fell from about 800,000 units in 2020 to about 680,000 in 2024, which DC Market Insights attributes to buyers moving general workloads to public cloud and rack servers, so most of the growth in that period came from price and from supercomputing. DC Market Insights estimates the average accelerated supercomputing blade at USD 98,000 in 2020 and USD 232,000 in 2025.
From 2025 to 2035, enterprise blade volume grows slowly to about 792,000 units, while GPU-accelerated blades grow at 15.71% a year and become half of market value. Supercomputing and high-performance computing (HPC) blade systems grow at 13.10% a year, more than twice as fast as enterprise blade systems at 5.76%.

Market Scope: What Does the Data Center Blade Server Market Cover?
The Data Center Blade Server Market covers every server that depends on a shared chassis for power, cooling and network connections, plus the chassis and modules that make the system work, valued at first sale in current US dollars, with 2025 as the base year and forecasts to 2035. DC Market Insights sizes it at USD 14.43 billion in 2025. The definition follows the EU ecodesign regulation, under which a blade server is “a server that is designed for use in a blade chassis”.
Included. Enterprise blade and modular systems such as HPE Synergy, Cisco Unified Computing System (UCS) X-Series, Dell PowerEdge MX and Supermicro SuperBlade; supercomputing blade systems such as HPE Cray EX, Eviden BullSequana XH3000 and Lenovo Neptune trays; half-height, full-height and quarter-height blades; GPU nodes that slot into a blade chassis; chassis and enclosures; and the interconnect and management modules installed in them.
Excluded. Stand-alone rack and tower servers, rack-scale GPU systems sold as complete racks outside a blade chassis, storage blades, external top-of-rack switches, cooling distribution units and facility plant, software licences, and installation and support services.
How the segments fit together. The component split (compute blades, chassis and enclosures, interconnect and management modules) divides the full USD 14.43 billion. Blade type, system class, cooling, application and end user each re-cut the same total, with chassis and module value allocated in proportion to the blades they serve.
Market Drivers: What Drives the Data Center Blade Server Market?
GPU-accelerated blades, a server processor refresh and national supercomputing programs drive the Data Center Blade Server Market, which DC Market Insights forecasts to grow at 7.79% a year. GPU-accelerated blades alone add USD 11.76 billion of value between 2025 and 2035.
GPU-Accelerated Blades Grow at 15.71% a Year to USD 15.32 Billion by 2035
Blade designs now carry several accelerators per node. HPE’s GX440n accelerated blade for the Cray GX5000 platform pairs 4 Vera CPUs with 8 Rubin GPUs, and a single Cray rack takes up to 24 of these blades for up to 192 GPUs; HPE does not expect the new platform to ship before early 2027. In enterprise chassis, Cisco’s UCS X580p PCIe node supports up to four PCIe GPUs, including the NVIDIA H200 NVL and RTX PRO 6000 Blackwell Server Edition, and occupies two slots in the 8-slot X9508 chassis. DC Market Insights estimates that GPU-accelerated blades were 24.7% of market value in 2025 and forecasts 50.2% in 2035, when they overtake x86 CPU blades. GPU servers sold outside a blade chassis are covered in the AI Server Market report.
Processor Refresh Lifts Enterprise Blade Shipments to 720,000 Units
Enterprise blade shipments recovered from about 680,000 units in 2024 to about 720,000 in 2025, according to DC Market Insights estimates, as new processors arrived for every major chassis. Advanced Micro Devices (AMD) launched its 5th Gen EPYC processors in October 2024 with 8 to 192 cores per CPU and estimated that customers modernizing to them could use about 87% fewer servers and 71% less power in its example. HPE’s Synergy 480 Gen12 compute module, a single-wide, half-height blade, takes one or two Intel Xeon 6 processors with 8 to 86 cores each and up to 4 TB of RDIMM memory. Fewer, denser blades replace older ones, so DC Market Insights forecasts only about 792,000 enterprise blade units by 2035.
Exascale and National HPC Programs Add USD 3.16 Billion of Blade Demand
Most of the world’s ten fastest supercomputers are built on blades. Seven of the ten fastest systems on the June 2026 TOP500 list run on HPE Cray EX or Eviden BullSequana XH3000 platforms, including El Capitan, Frontier, Aurora and the JUPITER Booster. JUPITER, inaugurated in Jülich, Germany, in September 2025 as Europe’s new fastest supercomputer, uses about 24,000 NVIDIA GH200 Grace Hopper Superchips in a BullSequana XH3000 booster (Source: EuroHPC Joint Undertaking announcement). HPC and supercomputing blade systems grow at 13.10% a year, from USD 3.16 billion in 2025 to USD 10.82 billion in 2035, according to DC Market Insights estimates.
Market Trends: How Are Blade Servers Changing?
Direct liquid cooling and chassis designs that outlive several processor generations are the two trends that shape the Data Center Blade Server Market, and direct liquid-cooled systems grow at 15.47% a year.
Direct Liquid Cooling Reaches 46.5% of Blade Value by 2035
Liquid cooling is moving from supercomputers into enterprise chassis. Supermicro’s 6U SuperBlade for Intel Xeon 6900 processors fits 5 nodes per 6U chassis when air-cooled and 10 nodes when liquid-cooled. Eviden reports 97% heat dispersion at a 40°C water inlet temperature for the BullSequana XH3000, and Lenovo’s 13U ThinkSystem N1380 Neptune enclosure holds up to eight SC-Series Neptune trays, reaching 162 kW DC per rack with three enclosures and water inlet temperatures up to 45°C. Direct liquid-cooled systems rise from 23.4% of market value in 2025 to 46.5% in 2035, according to DC Market Insights estimates.
Midplane-Free Chassis Stretch the Refresh Cycle
Chassis vendors design the enclosure to outlast the blades inside it. Cisco’s UCS X9508 is a 7RU chassis with 8 front-facing slots and a midplane-free design in which front-loaded compute nodes intersect with I/O modules at the rear of the chassis. Dell says the PowerEdge MX has no mid-plane, uses two fully redundant fabrics instead, and supports at least the next three generations of chipset technology. DC Market Insights therefore forecasts chassis and enclosures to grow at 7.07% a year, slower than compute blades at 7.90%.
Market Challenges: What Holds the Data Center Blade Server Market Back?
Rack-scale AI systems that grow faster than traditional servers, and facility limits on power and cooling, are the two constraints that DC Market Insights expects to hold x86 CPU blades to 3.25% growth a year.
AI Rack Systems Grow Far Faster Than Traditional Servers
Server spending is moving toward AI systems, which DC Market Insights estimates are mostly sold as complete racks rather than blades; the Dell results in the Competitive Insights section show how fast AI servers are outgrowing traditional servers. DC Market Insights therefore forecasts the share of x86 CPU blades to fall from 74.6% of market value in 2025 to 48.5% in 2035.
Power and Cooling Limits in Existing Data Halls
Dense blade racks need power and cooling that many enterprise rooms do not have. The International Energy Agency (IEA) estimates that data centers used about 415 TWh of electricity in 2024, around 1.5% of world consumption, and expects consumption to more than double to around 945 TWh by 2030. A rack of three Lenovo N1380 enclosures draws 162 kW DC, a density that DC Market Insights considers beyond most air-cooled enterprise halls, so many buyers must add liquid cooling before they can deploy the densest blades. DC Market Insights expects air-cooled systems to keep 53.5% of market value in 2035 because many enterprise rooms will not be converted.
Market Opportunities: Where Are the New Revenue Pools?
The two largest new revenue pools in the Data Center Blade Server Market are AI training and inference, growing at 17.92% a year to USD 9.79 billion by 2035, and cloud and colocation providers, growing at 10.80% a year.
GPU Nodes in Enterprise Chassis Bring AI to Existing Blade Estates
Enterprises that already run blade chassis can add GPUs without a new rack platform, as the Cisco X580p node shows. DC Market Insights estimates that GPU-accelerated blades were 2.4% of enterprise blade units in 2025 and forecasts 8.0% by 2035, which takes AI training and inference from USD 1.88 billion (13.1%) of the market in 2025 to USD 9.79 billion (32.0%) by 2035.
Cloud, Colocation and Edge Sites Buy Smaller Blade Systems
Cloud and colocation providers grow their blade spending at 10.80% a year, from 11.1% to 14.6% of market value between 2025 and 2035, according to DC Market Insights estimates. Smaller deployments are becoming simpler: Cisco announced UCS X-Series Direct in February 2024, a third fabric module for customers who want to connect a single chassis to their top-of-rack switch, with orders from May 2024. Compact multi-node servers also appear in the Micro Server Market report.
Pricing: How Much Does a Data Center Blade Server Cost?
A configured enterprise CPU blade sells for about USD 11,600 in 2025, a GPU-accelerated enterprise blade for about USD 52,000, and an accelerated supercomputing blade for about USD 232,000. These are DC Market Insights estimates of average selling prices at first sale, including processors, memory and local storage but excluding the chassis.
| Average price per blade (USD) | 2020 | 2025 | 2030 | 2035 |
|---|---|---|---|---|
| Enterprise CPU blade | 8,150 | 11,600 | 13,448 | 15,589 |
| Enterprise GPU-accelerated blade | 31,000 | 52,000 | 63,266 | 76,973 |
| HPC CPU blade | 38,000 | 52,000 | 66,367 | 84,703 |
| HPC accelerated blade | 98,000 | 232,000 | 310,468 | 415,477 |
Public reseller prices for empty blades set the floor. A Cisco UCS 210c M7 compute node without CPU, memory, storage or mezzanine card is listed at USD 6,293.00 by a US public-sector reseller, and an HPE Synergy 480 Gen12 configure-to-order compute module is listed by a UK reseller at GBP 3,580.20 excluding VAT at a special price, against a regular price of GBP 6,226.44. DC Market Insights estimates that two server processors and a typical memory configuration roughly double the price of a base blade, which gives its average of about USD 11,600 per configured enterprise CPU blade.
Standards and Regulation: Which Rules Shape Blade Server Design?
Three sets of rules shape how blade servers are designed and sold: the European Union ecodesign regulation for servers, the US ENERGY STAR program and the Redfish management standard of the Distributed Management Task Force (DMTF).
EU Regulation 2019/424. Commission Regulation (EU) 2019/424 sets ecodesign requirements for servers and data storage products and excludes servers with more than four processor sockets. Idle power and active state efficiency requirements have applied since 1 March 2020. For blade servers, idle power is calculated as the total measured power divided by the number of installed blade servers in the tested chassis, and blades are tested in a half-populated chassis.
ENERGY STAR Computer Servers Version 4.0. The US Environmental Protection Agency’s Version 4.0 requirements for computer servers took effect on 12 January 2024.
DMTF Redfish. Redfish is a standard designed to deliver simple and secure management for converged, hybrid IT. DC Market Insights treats Redfish support as a baseline buyer requirement for new chassis management modules, because it lets one set of tools manage blades and rack servers.
Market Segmentation: Which Segment Leads the Data Center Blade Server Market?
Compute blades lead the Data Center Blade Server Market with 79.6% of 2025 value, x86 CPU blades lead blade types with 74.6%, and enterprises lead buyers with 58.5%. AI training and inference is the fastest-growing segment at 17.92% a year, ahead of GPU-accelerated blades at 15.71% and direct liquid-cooled systems at 15.47%, because each new accelerated blade carries several GPUs and is cooled with liquid.
By Component: Compute Blades Lead with 79.6%
| Component | 2025 (USD billion) | Share 2025 | 2035 (USD billion) | CAGR 2025-2035 |
|---|---|---|---|---|
| Compute Blades | 11.48 | 79.6% | 24.56 | 7.90% |
| Chassis and Enclosures | 1.24 | 8.6% | 2.46 | 7.07% |
| Interconnect and Management Modules | 1.70 | 11.8% | 3.53 | 7.55% |
By Blade Type: x86 CPU Blades Lead with 74.6%
| Blade type | 2025 (USD billion) | Share 2025 | 2035 (USD billion) | CAGR 2025-2035 |
|---|---|---|---|---|
| x86 CPU Blades | 10.76 | 74.6% | 14.82 | 3.25% |
| Arm CPU Blades | 0.10 | 0.7% | 0.40 | 14.55% |
| GPU-Accelerated Blades | 3.56 | 24.7% | 15.32 | 15.71% |
Arm CPU blades are worth USD 103.89 million in 2025 and grow at 14.55% a year from a small base; Forschungszentrum Jülich planned the JUPITER Cluster Module around the SiPearl Rhea processor.
By System Class: Enterprise Blade Systems Lead with 78.1%
Enterprise blade systems are worth USD 11.27 billion (78.1%) in 2025 and USD 19.73 billion by 2035, a CAGR of 5.76%. HPC and supercomputing blade systems are worth USD 3.16 billion (21.9%) in 2025 and reach USD 10.82 billion (35.4%) by 2035, growing at 13.10% a year.
By Cooling: Air-Cooled Systems Lead with 76.6%
Air-cooled blade systems are worth USD 11.06 billion (76.6%) in 2025 and grow at 3.98% a year to USD 16.34 billion. Direct liquid-cooled systems are worth USD 3.37 billion (23.4%) and grow at 15.47% a year to USD 14.21 billion, because the DC Market Insights model assumes that almost every supercomputing blade and a rising share of enterprise blades use cold plates.
By Application: Virtualization and Private Cloud Leads with 36.6%
| Application | 2025 (USD billion) | Share 2025 | 2035 (USD billion) | CAGR 2025-2035 |
|---|---|---|---|---|
| Virtualization and Private Cloud | 5.28 | 36.6% | 6.90 | 2.72% |
| HPC and Scientific Computing | 2.06 | 14.3% | 5.18 | 9.66% |
| AI Training and Inference | 1.88 | 13.1% | 9.79 | 17.92% |
| Databases and Business Applications | 2.44 | 16.9% | 3.17 | 2.68% |
| VDI, Edge and Other | 2.77 | 19.2% | 5.50 | 7.10% |
AI training and inference overtakes virtualization and private cloud to become the largest application by 2035. Virtual desktop infrastructure (VDI), edge and other uses grow at 7.10% a year as GPU nodes enter enterprise chassis.
By End User: Enterprises Lead with 58.5%
| End user | 2025 (USD billion) | Share 2025 | 2035 (USD billion) | CAGR 2025-2035 |
|---|---|---|---|---|
| Enterprises | 8.44 | 58.5% | 14.75 | 5.74% |
| Government and Research Institutions | 3.25 | 22.6% | 9.15 | 10.90% |
| Cloud and Colocation Providers | 1.60 | 11.1% | 4.47 | 10.80% |
| Telecom Operators | 1.13 | 7.8% | 2.17 | 6.77% |
Government and research institutions grow fastest at 10.90% a year because, in the DC Market Insights model, national laboratories and supercomputing centers buy most accelerated supercomputing blades. By end use, buyer verticals such as IT and telecom, banking, financial services and insurance (BFSI), healthcare and life sciences, and energy and utilities sit inside the enterprises row, and machine learning workloads sit inside AI training and inference.
DC Exclusive: The Blade Type × Buyer Matrix
At USD 7.26 billion in 2025, x86 CPU blades bought by enterprises are the largest cell of the matrix and 50.3% of all blade server spending. The matrix cross-tabulates what is bought and who buys it. It is a DC Market Insights model, not a shipment count, built from 68 inputs: 48 annual unit values (16 years each of enterprise blades, supercomputing CPU blades and supercomputing accelerated blades), 4 price curves, 4 chassis and module attach ratios, 8 buyer splits (4 for each system class) and the disclosed server revenue of 4 listed vendors used as a cross-check.
| 2025, USD billion | x86 CPU | Arm CPU | GPU-Accelerated | Total |
|---|---|---|---|---|
| Enterprises | 7.26 | 0.05 | 1.14 | 8.44 |
| Government and Research Institutions | 1.23 | 0.04 | 1.98 | 3.25 |
| Cloud and Colocation Providers | 1.26 | 0.01 | 0.33 | 1.60 |
| Telecom Operators | 1.01 | 0.01 | 0.11 | 1.13 |
| Total | 10.76 | 0.10 | 3.56 | 14.43 |
Government and research institutions spend 61% of their blade budget on GPU-accelerated blades, while enterprises spend 86% on x86 CPU blades. Telecom operators spend the smallest share on accelerators, at about 10%.
Blade units multiplied by the average price of each blade type give compute blade value, and chassis and module attach ratios complete the market. The model and its assumptions are explained on our research methodology page.

Regional Insights: Which Region Leads the Data Center Blade Server Market?
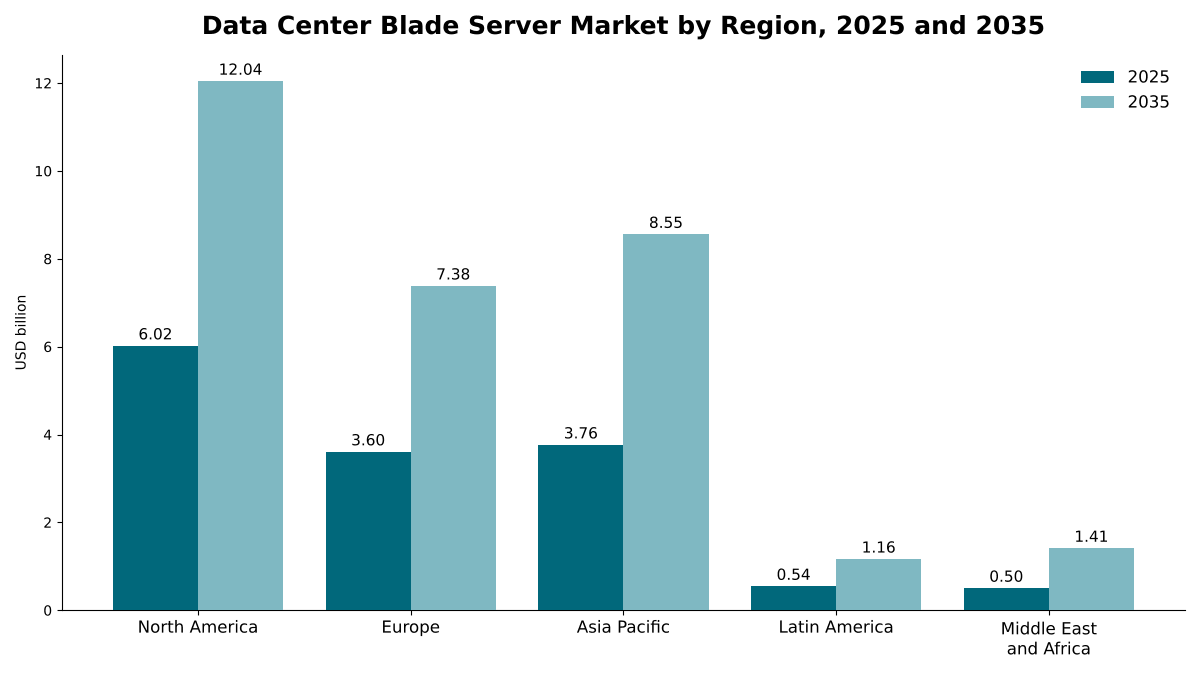
North America leads the Data Center Blade Server Market with 41.7% of 2025 value. The Middle East and Africa is the fastest-growing region at 10.91% a year, which DC Market Insights attributes to national AI and research computing programs adding liquid-cooled blade systems from a small installed base.
North America Leads with 41.7% Share
North American buyers spent USD 6.02 billion on blade systems in 2025, and the region is forecast to reach USD 12.04 billion by 2035, a CAGR of 7.18%. The region hosts El Capitan, Frontier and Aurora, the US Department of Energy systems ranked second to fourth on the June 2026 TOP500 list, all on HPE Cray EX platforms.
Asia Pacific Holds 26.1% Share
Asia Pacific is worth USD 3.76 billion in 2025 and USD 8.55 billion by 2035, a CAGR of 8.56%. China accounts for 38% of the regional total in the DC Market Insights allocation, and India grows fastest in the region. Asia Pacific gains 1.9 points of share by 2035, the largest gain of any region.
Europe Holds 25.0% Share
Europe is worth USD 3.60 billion in 2025 and USD 7.38 billion by 2035, a CAGR of 7.43%. JUPITER in Germany and the HPE supercomputers planned for HLRS and LRZ make Europe the second-largest region for supercomputing blades in the DC Market Insights model, and the EU ecodesign rules for servers reward shared-chassis designs that cut idle power per blade.
Latin America Holds 3.8% Share
Latin America is worth USD 543.16 million in 2025 and USD 1.16 billion by 2035, a CAGR of 7.91%, with Brazil accounting for 44% of the regional total.
Middle East and Africa Holds 3.5% Share and Grows Fastest
The Middle East and Africa is worth USD 500.41 million in 2025 and USD 1.41 billion by 2035, a CAGR of 10.91%. DC Market Insights expects national AI and research computing programs to drive most of the growth. Investors weighing new markets can read how we assess power, fiber routes and permitting in our data center site selection and feasibility work.
Country Analysis: Which Countries Buy the Most Blade Servers?
The United States is the largest country market for data center blade servers at USD 5.45 billion in 2025, 37.7% of global value, followed by China at USD 1.43 billion (9.9%) and Germany at USD 883.14 million (6.1%). The 12 largest countries account for 80.5% of 2025 spending.
| Rank | Country | Region | 2025 (USD billion) | Share 2025 | 2035 (USD billion) | CAGR 2025-2035 |
|---|---|---|---|---|---|---|
| 1 | United States | North America | 5.45 | 37.7% | 10.84 | 7.12% |
| 2 | China | Asia Pacific | 1.43 | 9.9% | 3.04 | 7.83% |
| 3 | Germany | Europe | 0.88 | 6.1% | 1.76 | 7.12% |
| 4 | Japan | Asia Pacific | 0.75 | 5.2% | 1.56 | 7.54% |
| 5 | United Kingdom | Europe | 0.68 | 4.7% | 1.34 | 6.91% |
| 6 | France | Europe | 0.51 | 3.5% | 1.08 | 7.73% |
| 7 | Canada | North America | 0.47 | 3.3% | 1.00 | 7.85% |
| 8 | India | Asia Pacific | 0.33 | 2.3% | 1.16 | 13.39% |
| 9 | South Korea | Asia Pacific | 0.32 | 2.2% | 0.74 | 8.81% |
| 10 | Italy | Europe | 0.29 | 2.0% | 0.61 | 7.69% |
| 11 | Australia | Asia Pacific | 0.26 | 1.8% | 0.62 | 9.02% |
| 12 | Brazil | Latin America | 0.24 | 1.7% | 0.53 | 8.20% |
India is the fastest-growing country market at 13.39% a year in the DC Market Insights model, which expects banks, telecom operators and government data centers there to expand on-premises capacity. Germany ranks third, ahead of Japan, because the model allocates it a large share of European supercomputing blade spend; the rest of Europe outside the four listed countries accounts for 34.2% of the regional total. Outside the top 12, Mexico is worth USD 146.65 million in 2025 and USD 325.73 million by 2035 (8.31% a year), and Saudi Arabia USD 120.10 million and USD 380.44 million (12.22% a year). The country figures are a DC Market Insights allocation of the regional totals, weighted by each country’s estimated share of installed blade chassis and supercomputing capacity.
Forecast Scenarios: How Could the 2035 Forecast Change?
The Data Center Blade Server Market reaches USD 30.55 billion by 2035 in the base case, with a range of USD 25.66 billion to USD 35.13 billion across the low and high scenarios.
| Scenario | Assumption from 2026 | 2035 (USD billion) | CAGR 2025-2035 |
|---|---|---|---|
| Low | Enterprise blade units fall back toward 2024 levels; accelerated blades lose share to rack-scale AI systems | 25.66 | 5.93% |
| Base | Enterprise units reach about 792,000 a year; accelerated blades reach 50.2% of value | 30.55 | 7.79% |
| High | More national AI and supercomputing programs; GPU nodes reach a larger share of enterprise chassis | 35.13 | 9.31% |
The low case is what happens if enterprises buy AI capacity as complete racks rather than blades. The high case assumes more national supercomputers and a larger blade share of enterprise AI inference.
Competitive Insights: Who Leads the Data Center Blade Server Market?
- Hewlett Packard Enterprise (HPE)
- Cisco Systems
- Dell Technologies
- Lenovo
- Supermicro (Super Micro Computer)
- Eviden
- Huawei
- H3C
- GIGABYTE
- AMD
- Intel
HPE is the market leader with about 31% of the Data Center Blade Server Market in 2025, and HPE, Cisco and Dell Technologies together hold about 62% (DC Market Insights estimate, based on the installed base of HPE Synergy, Cisco UCS and Dell PowerEdge MX chassis and on HPE Cray EX supercomputing systems). HPE reported server segment revenue of USD 17.75 billion in its fiscal year to October 2025, and its fiscal 2025 annual report lists HPE Synergy, a composable infrastructure for traditional and cloud-native applications, and HPE Cray EX supercomputing systems in the server portfolio (Source: HPE Form 10-K filed with the US Securities and Exchange Commission). Cisco sells UCS X-Series chassis with compute and GPU nodes, and Dell sells the 7U PowerEdge MX7000; Dell’s AI-optimized server revenue rose 166% to USD 24.68 billion in its fiscal year to January 2026, while its traditional servers and networking revenue rose 9% to USD 19.51 billion. Lenovo competes in supercomputing with Neptune liquid-cooled trays, Eviden with BullSequana XH3000 systems such as JUPITER, and Supermicro with SuperBlade. Huawei’s FusionServer E9000 provides 16 slots in a 12U chassis, H3C sells the UniServer B16000 chassis, GIGABYTE sells B-Series multi-node systems, and AMD and Intel supply the processors and accelerators that set each blade generation.
Recent Developments
- In February 2024, Cisco announced UCS X-Series Direct, a fabric interconnect module that connects a single X9508 chassis to a top-of-rack switch, with orders from May 2024 (Source: Cisco product FAQ).
- In October 2024, AMD launched its 5th Gen EPYC server processors with 8 to 192 cores per CPU (Source: AMD press release).
- In September 2025, JUPITER was inaugurated in Jülich, Germany, as Europe’s new fastest supercomputer, with a booster built on Eviden’s BullSequana XH3000 and about 24,000 NVIDIA GH200 Superchips (Source: EuroHPC Joint Undertaking announcement).
- In November 2025, HPE detailed the GX440n, GX350a and GX250 blades for its Cray GX5000 supercomputing platform, with no new hardware expected before early 2027 and systems based on the new blades planned for HLRS and LRZ (Source: The Register report).
- In December 2025, Supermicro unveiled a 6U SuperBlade for Intel Xeon 6900 processors with 5 air-cooled or 10 liquid-cooled nodes per chassis (Source: Supermicro press release).
We follow these launches, deals and deployments as they happen in our data center industry updates.
Methodology: How We Built the Data Center Blade Server Market Model
DC Market Insights built this market bottom-up from units and prices. Enterprise compute blade units (about 720,000 in 2025) were split into CPU and GPU-accelerated blades (2.4% in 2025, 8.0% in 2035) and priced with separate price curves; supercomputing blade units (10,600 CPU and 8,100 accelerated blades in 2025) were priced the same way. Chassis and enclosures were added at 10.5% of enterprise compute value in 2025, falling to 9.0% in 2035, and at 12% of supercomputing compute value; interconnect and management modules at 14.0% falling to 12.5%, and at 18%. Because no listed vendor reports blade server sales separately, the market is a DC Market Insights model with bound checks. Ceiling: the 2025 market of USD 14.43 billion equals 15.1% of the combined USD 95.56 billion of server-led revenue disclosed by Dell (traditional servers and networking, USD 19.51 billion), HPE (server segment, USD 17.75 billion), Lenovo (Infrastructure Solutions Group, USD 19.20 billion) and Supermicro (net sales, USD 39.10 billion) for their fiscal years 2026, 2025, 2025/26 and 2026 respectively, a share consistent with blades being a minority form factor in a larger global server market. Floor: the supercomputing segment of USD 3.16 billion must exceed two large recent blade installations, the USD 600 million El Capitan contract signed by the US Department of Energy with Cray in 2019 and JUPITER, whose system and six years of operation cost EUR 500 million; it does so by a wide margin. Every split sums to the market total. The analyst named on this page built the model, and the reviewer checked the arithmetic, the sources and the dates before publication.
Table of contents
- 01Introduction
- 1.1Market Definition and Scope
- 1.2Blade Server, Blade Chassis and Module Definitions
- 1.3Currency, Pricing and Base Year
- 1.4Stakeholders
- 02Research Methodology
- 2.1Units × Price Build
- 2.2Bound Checks Against Vendor Disclosures
- 2.3Data Sources
- 2.4Assumptions and Limitations
- 03Executive Summary
- 3.1Market Snapshot, 2025 and 2035
- 3.2Key Findings
- 3.3Analyst Viewpoint
- 04Market Dynamics
- 4.1Drivers
- 4.2Trends
- 4.3Challenges
- 4.4Opportunities
- 05Pricing Analysis
- 5.1Average Price per Blade by Type, 2020–2035
- 5.2Base Blade Reseller Prices
- 5.3Chassis and Module Attach Ratios
- 06Standards and Regulation
- 6.1EU Regulation 2019/424 (Ecodesign for Servers)
- 6.2ENERGY STAR Computer Servers Version 4.0
- 6.3DMTF Redfish
- 07Supply Chain and Technology
- 7.1Processor and Accelerator Suppliers
- 7.2Blade System Vendors
- 7.3Direct Liquid Cooling Integration
- 08Market Size and Forecast
- 8.1Market Size, 2020–2035
- 8.2Enterprise and Supercomputing Blade Units
- 8.3Year-on-Year Growth
- 09Market by Component
- 9.1Compute Blades
- 9.2Chassis and Enclosures
- 9.3Interconnect and Management Modules
- 10Market by Blade Type
- 10.1x86 CPU Blades
- 10.2Arm CPU Blades
- 10.3GPU-Accelerated Blades
- 11Market by System Class
- 11.1Enterprise Blade Systems
- 11.2HPC and Supercomputing Blade Systems
- 12Market by Cooling
- 12.1Air-Cooled
- 12.2Direct Liquid-Cooled
- 13Market by Application
- 13.1Virtualization and Private Cloud
- 13.2HPC and Scientific Computing
- 13.3AI Training and Inference
- 13.4Databases and Business Applications
- 13.5VDI, Edge and Other
- 14Market by End User
- 14.1Enterprises
- 14.2Government and Research Institutions
- 14.3Cloud and Colocation Providers
- 14.4Telecom Operators
- 15DC Exclusive: Blade Type × Buyer Matrix
- 15.1Matrix, 2025
- 15.2Model Inputs
- 16Market by Region
- 16.1North America (United States, Canada)
- 16.2Europe (Germany, United Kingdom, France, Italy)
- 16.3Asia Pacific (China, Japan, India, South Korea, Australia)
- 16.4Latin America (Brazil)
- 16.5Middle East and Africa
- 17Country Analysis
- 17.1Top 12 Countries, 2025 and 2035
- 17.2Fastest-Growing Countries
- 18Regional Cross-Sections
- 18.1Region by System Class, 2025 and 2035
- 18.2Region by Cooling, 2025 and 2035
- 19Forecast Scenarios
- 19.1Low Scenario
- 19.2Base Scenario
- 19.3High Scenario
- 20Competitive Landscape
- 20.1Market Share Estimate, 2025
- 20.2Vendor Positioning
- 21Company Profiles
- 21.1Hewlett Packard Enterprise (HPE)
- 21.2Cisco Systems
- 21.3Dell Technologies
- 21.4Lenovo
- 21.5Supermicro
- 21.6Eviden
- 21.7Huawei
- 21.8H3C
- 21.9GIGABYTE
- 21.10AMD
- 21.11Intel
- 22Recent Developments
- 22.1Product Launches
- 22.2Supercomputing Deployments
- 23Analyst Recommendations
- 23.1For Blade System Vendors
- 23.2For Data Center Operators
- 23.3For Investors
- Fig. 1Data Center Blade Server Market Size, 2020–2035
- Fig. 2Blade Type × Buyer Matrix, 2025
- Fig. 3Market by Region, 2025 and 2035
- Table 1Report Attributes
- Table 2Average Price per Blade by Type, 2020–2035
- Table 3Market by Component, 2025 and 2035
- Table 4Market by Blade Type, 2025 and 2035
- Table 5Market by Application, 2025 and 2035
- Table 6Market by End User, 2025 and 2035
- Table 7Blade Type × Buyer Matrix, 2025
- Table 8Top 12 Countries, 2025 and 2035
- Table 9Forecast Scenarios, 2035
About this report
Written by Amit Jain and reviewed by Deepti Agrawal, Senior Editor, Research. Figures are built top-down and bottom-up and reconciled before publication, with 2025 as the base year.
Read our methodologyHow we built this
- Historical period2020-2024
- Base year2025
- Forecast period2026-2035
- Sizing approachTop-down + bottom-up
Need more than the report?
Advisory on this market
Due diligence, site selection and market entry work, by the analysts who wrote this report.
See consulting servicesFrequently asked questions
USD 14.43 billion in 2025, rising to USD 30.55 billion by 2035. DC Market Insights estimates the market at USD 9.06 billion in 2020.
7.79% a year from 2025 to 2035. Growth was 9.74% a year between 2020 and 2025, and 2025 alone added 18.35% over 2024, according to DC Market Insights estimates.
x86 CPU blades, with USD 10.76 billion or 74.6% of 2025 value. GPU-accelerated blades grow fastest at 15.71% a year and reach 50.2% of value by 2035.
About USD 11,600 for a configured enterprise CPU blade in 2025, USD 52,000 for a GPU-accelerated enterprise blade and USD 232,000 for an accelerated supercomputing blade, according to DC Market Insights estimates.
North America, with USD 6.02 billion or 41.7% of 2025 value. The Middle East and Africa grows fastest at 10.91% a year.
HPE leads with about 31% of the market, and HPE, Cisco and Dell Technologies together hold about 62% (DC Market Insights estimate). Lenovo, Supermicro, Eviden, Huawei, H3C and GIGABYTE also compete.
USD 3.37 billion or 23.4% of 2025 value, rising to USD 14.21 billion or 46.5% by 2035 at 15.47% a year (DC Market Insights estimate).
USD 5.45 billion in the United States, or 37.7% of 2025 spending, followed by China at USD 1.43 billion. India grows fastest at 13.39% a year (DC Market Insights estimate).
Licences, delivery and payment
Which licence should I choose?
Single User is a view-only PDF for one person. Multi User adds a printable PDF and the Excel data for unlimited users at one location. Enterprise covers your whole company and includes 100 free analyst hours.
How and when will I receive the report?
By email, within 24–48 business hours of payment, in the formats of your licence.
How can I pay?
Securely through PayPal: with a PayPal account, a debit or credit card, or PayPal Pay Later where available. Prices are in US dollars.
Can I see a sample first?
Yes. Request a free sample and we will email it to you.
Can the report be tailored to my needs?
Yes. We can add countries, segments or data cuts. Talk to an analyst about the scope you need.
Can I get an invoice or pay against a purchase order?
Write to sales@dcmarketinsights.com and our team will help.