
Micro Server Market Size, Share & Forecast to 2035
Market at a glance
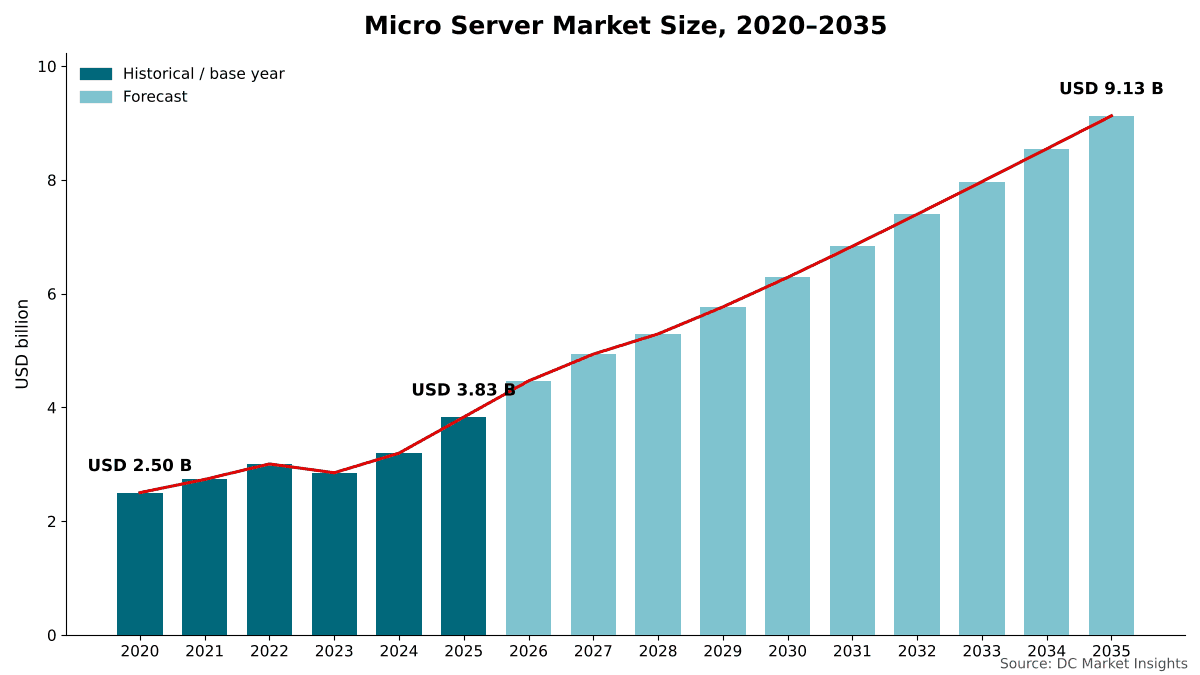
The Micro Server market was worth USD 3,830.0 million in 2025 and is forecast to reach USD 9,130.0 million by 2035, growing at a 9.07% CAGR. North America accounts for 36.4% of the market.
 By Amit Jain, Senior Consultant, ICT & Emerging Technologies
 Reviewed by Deepti Agrawal
Last updated 10 Oct 2026
Base year 2025 PDF + Excel
Reviewed by Deepti Agrawal
Last updated 10 Oct 2026
Base year 2025 PDF + Excel
Source: DC Market Insights analysis
Key findings
Multi-Node Designs Pack Up to 40 Servers in 6U and Grow at 11.01%
Arm-Based Micro Servers Grow at 16.81% a Year
Memory Prices Lift 2026 Average Selling Prices by 10.2%
Telecom and Edge Operators Grow at 13.69% a Year
What is inside the report
- 01Introduction
- 02Research Methodology
- 03Executive Summary
- 04Market Dynamics
- 05Pricing Analysis
- 06Standards and Regulation
- 07Supply Chain and Value Chain
- 08Market Size and Forecast
- 09Market by Form Factor
- 10Market by Processor Architecture
- 21chapters
- 2020-2024Historical period
- 2026-2035Forecast period
- 14Companies profiled
Regional insights
- North America36.4%
- Europe27.8%
- Asia Pacific27.1%
- Latin America4.9%
- Middle East and Africa3.8%
Segmentation
Companies profiled
- Supermicro
- Dell Technologies
- Hewlett Packard Enterprise (HPE)
- Lenovo
- Gigabyte
- ASRock Rack
- MiTAC
- MSI
- Altos
- Inspur
- Fujitsu
- AMD
- Intel
- Ampere Computing
Recent developments
Intel launched the Xeon 6300 series of entry server processors, a refresh of the Xeon E-2400 line that scales up to 8 cores (Source: Phoronix news report).
Lenovo unveiled the ThinkEdge SE100, described by Lenovo as an entry-level AI inferencing server; the system is 85% smaller than a standard 1U server and stays under 140W (Source: Data Center Dynamics news report).
AMD launched the EPYC 4005 Series for small and medium businesses and hosted IT service providers, with 1,000-unit prices from USD 239 to USD 699 (Source: AMD press release).
Supermicro introduced a MicroCloud system with up to 10 server nodes in 3U, built on AMD EPYC 4005 processors, for web and dedicated hosting, cloud gaming and content delivery networks (Source: Supermicro press release).
SoftBank Group completed its acquisition of all equity interests in Ampere Computing Holdings (Source: SoftBank Group press release).
Supermicro introduced an AMD EPYC 4005 MicroBlade system with up to 40 server nodes in a 6U enclosure and up to 320 nodes in a standard 48U rack (Source: Supermicro press release).
Full analysis
The Micro Server Market covers low-power, small-footprint servers built around a single entry-class processor or system-on-chip (SoC): micro towers for small offices, dense multi-node micro cloud and microblade nodes for hosting providers, and compact edge micro servers for branch, retail, telecom and AI inference sites. DC Market Insights values the global Micro Server Market at USD 3.83 billion in 2025 and forecasts USD 9.13 billion by 2035, a CAGR of 9.07%. The 2025 value is built from units and prices: about 1.12 million micro servers shipped at a blended average selling price of about USD 3,420 per system. Compact edge micro servers are the fastest-growing form factor at 11.82% a year because DC Market Insights expects AI inference and local data processing to move to sites with no server room, and the Middle East and Africa is the fastest-growing region at 11.47% a year as hosting and edge capacity is built from a small base.
Executive Summary
The Global Micro Server Market size was valued at USD 2.50 billion in 2020, reached USD 3.83 billion in 2025, and is anticipated to reach USD 9.13 billion by 2035, at a CAGR of 9.07% during the forecast period.
| Report attribute | Details |
|---|---|
| Historical Period | 2020-2024 |
| Base Year | 2025 |
| Forecast Period | 2026-2035 |
| Micro Server Market Size 2025 | USD 3.83 Billion |
| Micro Server Market, CAGR | 9.07% |
| Micro Server Market Size 2035 | USD 9.13 Billion |
DC Market Insights estimates that the market grew at 8.89% a year between 2020 and 2025, with a dip in 2023 and a 19.8% jump in 2025 as new entry-class processors reached hosting providers and compact edge systems began shipping with inference accelerators. Unit shipments rose from about 880,000 in 2020 to about 1.12 million in 2025, and DC Market Insights forecasts about 2.23 million units in 2035.
Value grows faster than units in 2026 because memory and storage make up the largest share of micro server value in DC Market Insights estimates and memory prices are elevated. After 2027, growth comes mainly from volume: more nodes per rack in hosting halls, more compact servers at edge sites and a rising share of Arm-based designs.
Market Scope: What Does the Micro Server Market Cover?
The Micro Server Market covers complete server systems that use one entry-class processor or SoC, draw roughly 65W to 200W at the processor, and fit in a micro tower, a shared multi-node chassis or a compact edge enclosure, valued at first sale in current US dollars with 2025 as the base year and forecasts to 2035. DC Market Insights sizes the market at USD 3.83 billion in 2025.
Included. Micro towers and compact standalone servers sold to small businesses and branch offices; multi-node micro cloud and microblade nodes that share power, cooling and networking in a common chassis; compact edge micro servers, including systems with a small inference accelerator; the processor, memory, storage, board, chassis, power supply and embedded networking shipped inside each system; and factory-installed management controllers.
Excluded. Dual-socket and multi-socket rack servers, GPU training servers, rugged military servers, desktop workstations sold as servers, processors and memory sold separately as spare parts, software subscriptions, and installation or managed services.
How the segments fit together. Form factor, processor architecture, component, application and end-user each re-cut the same USD 3.83 billion in 2025, so every split sums to the market total. The component split divides system value by what sits inside the box, while the application and end-user splits divide it by who buys the system and why.
Market Drivers: What Drives the Micro Server Market?
Three drivers explain most of the growth in the Micro Server Market: dense multi-node designs for hosting providers, compact servers for AI inference at the edge, and a new generation of low-cost entry server processors. Together, DC Market Insights expects them to lift the market from USD 3.83 billion in 2025 to USD 9.13 billion in 2035.
Multi-Node Designs Pack Up to 40 Servers in 6U and Grow at 11.01%
In May 2025, Supermicro introduced a MicroCloud system with up to 10 server nodes in 3U, offering up to 2,080 cores in a standard 42U rack and more than 3.3 times the compute density of standard 1U rack servers, for web and dedicated hosting, cloud gaming and content delivery networks. In February 2026, Supermicro followed with a MicroBlade enclosure that holds up to 40 server nodes in 6U, or up to 320 nodes in a standard 48U rack. DC Market Insights estimates that multi-node micro cloud and microblade nodes were worth USD 1.28 billion in 2025, or 33.3% of the market, and forecasts USD 3.63 billion by 2035, a CAGR of 11.01%.
Edge AI Inference Lifts Compact Edge Micro Servers to USD 3.76 billion by 2035
Lenovo unveiled the ThinkEdge SE100 at Mobile World Congress in March 2025, describing it as a first-to-market, entry-level AI inferencing server; it is 85% smaller than a standard 1U server and designed to stay under 140W even in its fullest GPU-equipped configuration. DC Market Insights values compact edge micro servers at USD 1.23 billion in 2025 and forecasts USD 3.76 billion by 2035, growing at 11.82% a year, the fastest of the three form factors. Edge computing and AI inference becomes the largest application by 2035, at USD 3.07 billion.
Entry Server Processors Priced from USD 149 to USD 699 Widen the Platform Base
AMD launched the EPYC 4004 Series in May 2024 for small and medium businesses and hosted IT service providers, with 4 to 16 cores and a lowest 1,000-unit price of USD 149. In May 2025, AMD followed with the EPYC 4005 Series, with 6 to 16 “Zen 5” cores, 65W to 170W of default power and 1,000-unit prices from USD 239 to USD 699 (Source: AMD press release). Intel launched the Xeon 6300 series in February 2025 as a refresh of the Xeon E-2400 line; the series scales up to 8 cores and 16 threads. DC Market Insights estimates that processors and SoCs account for USD 819.78 million of 2025 micro server value, or 21.4%.
Market Trends: How Are Micro Servers Changing?
The Micro Server Market is moving toward Arm-based processors, more nodes per rack and a larger share of value in memory and networking, with Arm-based designs growing at 16.81% a year to 2035 according to DC Market Insights estimates.
Arm-Based Micro Servers Grow at 16.81% a Year
Arm said in April 2025 that close to 50 percent of the compute shipped to top hyperscalers in 2025 would be Arm-based. SoftBank Group completed its acquisition of Ampere Computing, a designer of high-performance, energy-efficient AI compute based on the Arm platform, in November 2025. DC Market Insights expects micro servers to follow large cloud servers with a lag and estimates that Arm-based systems held 13.8% of micro server value in 2025, worth USD 528.64 million, and forecasts USD 2.50 billion by 2035, or 27.4% of the market.
Shared-Chassis Nodes Replace 1U Pizza-Box Servers in Hosting Halls
In a shared enclosure, nodes share power supplies, fans and switch ports. DC Market Insights estimates that about 432,000 multi-node micro cloud and microblade nodes shipped in 2025 and forecasts about 1.00 million in 2035, when they account for 45.0% of micro server units. Supermicro’s newest MicroBlade enclosure supports power capping, which lets administrators limit each server’s maximum power draw.
Memory and Storage Take 46.8% of System Value
Memory and storage are the largest part of what a buyer pays for: USD 1.79 billion in 2025, or 46.8% of micro server value, according to DC Market Insights estimates. Networking, management and other content grows fastest among components, at 12.44% a year, as nodes add faster network ports and remote management controllers.
Market Challenges: What Holds the Micro Server Market Back?
Memory prices and the shift of small-business workloads to cloud instances are the two constraints that DC Market Insights expects to slow the Micro Server Market, with micro tower value growing only 2.76% a year to 2035.
Memory Prices Lift 2026 Average Selling Prices by 10.2%
Hewlett Packard Enterprise (HPE) chief executive Antonio Neri said in March 2026 that DRAM and NAND make up more than 50 percent of a traditional server’s bill of materials and that HPE expects elevated memory prices to persist well into 2027. HPE has amended its quoting terms to give it the right to reprice existing orders for commodity cost increases. DC Market Insights models the blended micro server selling price rising from about USD 3,420 in 2025 to about USD 3,769 in 2026, a 10.2% increase, which holds 2026 unit growth to 5.8%.
Cloud Instances Shrink the Small-Business Server Room
DC Market Insights expects many small offices to keep renting virtual machines instead of buying a server, and estimates that micro tower and compact standalone server shipments fell from about 447,000 units in 2022 to about 418,000 in 2025 and fall to about 412,000 in 2026, before recovering slowly to about 453,000 by 2035. SMB and branch IT is the slowest-growing application, at 5.82% a year, and its share of the market falls from 27.6% in 2025 to 20.4% in 2035.
Market Opportunities: Where Are the New Revenue Pools?
The two largest new revenue pools in the Micro Server Market are telecom and edge operators, growing at 13.69% a year, and the steady refresh of large hosting fleets.
Telecom and Edge Operators Grow at 13.69% a Year
Telecom and edge operators spent USD 559.29 million on micro servers in 2025, and DC Market Insights expects USD 2.02 billion in 2035, more than three and a half times the 2025 level. DC Market Insights expects most of that spend to go to compact edge systems for cell sites, central offices and on-premises edge nodes.
Large Hosting Fleets Create a Steady Refresh Base
OVHcloud reported more than 500,000 servers in 44 data centers in its fiscal 2025 results, and its Private Cloud business, which includes Bare Metal Cloud, earned EUR 671.6 million. OVHcloud is also among the partners AMD named for both the EPYC 4004 and EPYC 4005 launches. DC Market Insights estimates that hosting and cloud service providers bought about 0.50 million micro servers in 2025, worth USD 1.58 billion, and forecasts USD 3.70 billion by 2035. Server sizing for these fleets is covered in our White Box Server Market report.
Pricing: How Much Does a Micro Server Cost?
A micro server sold for about USD 3,420 on average in 2025, according to DC Market Insights estimates, ranging from about USD 2,955 for a micro cloud node to about USD 4,560 for a compact edge system with accelerator options. Processor list prices set the floor: AMD’s EPYC 4005 Series ranges from USD 239 to USD 699 per processor in 1,000-unit quantities, and Intel’s Xeon 6369P carries a list price of USD 545.
| Average selling price per system (USD) | 2020 | 2025 | 2030 | 2035 |
|---|---|---|---|---|
| Multi-node micro cloud and microblade node | 2,510 | 2,955 | 3,395 | 3,620 |
| Micro tower and compact standalone server | 2,780 | 3,165 | 3,620 | 3,835 |
| Compact edge micro server | 3,620 | 4,560 | 4,900 | 4,875 |
| Blended average | 2,844 | 3,420 | 3,910 | 4,099 |
Prices rise in two steps. The 2026 step comes from memory costs. The slower rise after 2027 comes from content: more cores, more memory per node and faster network ports.
Standards and Regulation: Which Rules Shape Micro Servers?
The main rule for micro servers sold in Europe is the ecodesign regulation for servers, and processor socket choices decide how long a micro server platform stays in production.
EU ecodesign regulation for servers. Commission Regulation (EU) 2019/424 of 15 March 2019 sets ecodesign requirements for servers and online data storage products. Servers had to meet its first requirements from 1 March 2020, and servers and online data storage products had to meet further requirements from 1 January 2023. The regulation does not apply to, among other products, servers intended for embedded applications, servers classified as small scale servers under Regulation (EU) No 617/2013, servers with more than four processor sockets, server appliances, large servers, fully fault tolerant servers and network servers. In DC Market Insights’ reading, single-socket rack and multi-node micro servers generally fall inside its scope, while tower designs that qualify as small scale servers are excluded.
Platform sockets. AMD built the EPYC 4005 Series on the same AM5 socket used for the EPYC 4004 Series. Intel’s Xeon 6300 series has been described as a refresh of the Xeon E-2400 line rather than a new line.
Market Segmentation: Which Segment Leads the Micro Server Market?
Micro towers and compact standalone servers lead the Micro Server Market by form factor with 34.5% of 2025 value, x86 leads processor architectures with 84.6%, and hosting and cloud service providers lead buyers with 41.2%. Among form factors, compact edge micro servers are the fastest-growing segment at 11.82% a year because DC Market Insights expects AI inference to move to retail, industrial and telecom sites that have no server room.
By Form Factor: Micro Towers Lead with 34.5%
| Form factor | 2025 (USD billion) | Share 2025 | 2035 (USD billion) | CAGR 2025-2035 |
|---|---|---|---|---|
| Multi-Node Micro Cloud and MicroBlade Nodes | 1.28 | 33.3% | 3.63 | 11.01% |
| Micro Tower and Compact Standalone Servers | 1.32 | 34.5% | 1.74 | 2.76% |
| Compact Edge Micro Servers | 1.23 | 32.1% | 3.76 | 11.82% |
The three form factors are close in 2025, but they diverge quickly. DC Market Insights forecasts that compact edge micro servers overtake micro towers in 2026 and reach 41.2% of the market by 2035, while micro towers fall to 19.0%.
By Processor Architecture: x86 Leads with 84.6%
| Processor architecture | 2025 (USD billion) | Share 2025 | 2035 (USD billion) | CAGR 2025-2035 |
|---|---|---|---|---|
| x86 | 3.24 | 84.6% | 6.29 | 6.85% |
| Arm-Based | 0.53 | 13.8% | 2.50 | 16.81% |
| RISC-V and Other | 0.06 | 1.6% | 0.34 | 18.61% |
Arm-based designs gain 13.6 points of share by 2035, and RISC-V and other architectures grow from USD 61.29 million to USD 337.74 million, mainly in edge appliances.
By Component: Memory and Storage Lead with 46.8%
| Component | 2025 (USD billion) | Share 2025 | 2035 (USD billion) | CAGR 2025-2035 |
|---|---|---|---|---|
| Memory and Storage | 1.79 | 46.8% | 4.12 | 8.67% |
| Processor and SoC | 0.82 | 21.4% | 1.84 | 8.44% |
| Board, Chassis and Power | 0.75 | 19.7% | 1.67 | 8.27% |
| Networking, Management and Other | 0.46 | 12.1% | 1.50 | 12.44% |
By Application: Web and Dedicated Hosting Leads with 31.5%
Web and dedicated hosting is the largest application at USD 1.21 billion (31.5%) in 2025. SMB and branch IT follows at USD 1.06 billion (27.6%), then edge computing and AI inference at USD 873.41 million (22.8%), content delivery and cloud gaming at USD 417.55 million (10.9%) and other applications at USD 275.81 million (7.2%). Edge computing and AI inference grows fastest at 13.38% a year and becomes the largest application before 2035, reaching USD 3.07 billion.
By End-user: Hosting and Cloud Service Providers Lead with 41.2%
| End-user | 2025 (USD billion) | Share 2025 | 2035 (USD billion) | CAGR 2025-2035 |
|---|---|---|---|---|
| Hosting and Cloud Service Providers | 1.58 | 41.2% | 3.70 | 8.88% |
| Enterprises and SMBs | 1.45 | 37.9% | 2.80 | 6.80% |
| Telecom and Edge Operators | 0.56 | 14.6% | 2.02 | 13.69% |
| Government and Education | 0.24 | 6.3% | 0.61 | 9.74% |
Enterprises and SMBs are the slowest-growing buyers at 6.80% a year as small offices move workloads to cloud instances. Government and education buyers grow at 9.74% a year, mainly through school, municipal and public-safety edge sites.
DC Exclusive: The Micro Server Units × Price Model and Form Factor × Buyer Matrix
At USD 1.09 billion in 2025, multi-node nodes bought by hosting and cloud service providers are the single largest cell of the matrix and 28.4% of all micro server spending. The matrix cross-tabulates what is bought against who buys it.
| 2025, USD billion | Multi-Node Nodes | Micro Towers | Compact Edge | Total |
|---|---|---|---|---|
| Hosting and Cloud Service Providers | 1.09 | 0.20 | 0.29 | 1.58 |
| Enterprises and SMBs | 0.10 | 0.96 | 0.39 | 1.45 |
| Telecom and Edge Operators | 0.06 | 0.04 | 0.46 | 0.56 |
| Government and Education | 0.03 | 0.12 | 0.09 | 0.24 |
| Total | 1.28 | 1.32 | 1.23 | 3.83 |
Hosting and cloud service providers spend 68.9% of their micro server budget on multi-node nodes, while enterprises and SMBs spend 66.1% on micro towers; a vendor strong only in towers is selling into the slowest-growing buyer. Telecom and edge operators put 82.4% of their spend into compact edge systems, the highest concentration of any buyer.
The matrix is a DC Market Insights model, not a shipment count. The model is built from 113 inputs: 96 unit and price points (3 form factors, 16 years, units and price), 12 seed shares for the form factor × buyer matrix and 5 regional splits, and it is checked against disclosed revenue of 3 listed system makers and the published fleet size of one large hosting provider. Two inputs drive the result and any reader can test them: units shipped (about 1.12 million in 2025) and the blended price per system (about USD 3,420). The model and its assumptions are explained on our research methodology page.
Regional Insights: Which Region Leads the Micro Server Market?
North America leads the Micro Server Market with 36.4% of 2025 value, and the Middle East and Africa is the fastest-growing region at 11.47% a year, because DC Market Insights expects new hosting, telecom edge and government sites in the Gulf states to grow from a small installed base.
North America Leads with 36.4% Share
North American buyers spent USD 1.39 billion on micro servers in 2025, and DC Market Insights forecasts USD 3.07 billion by 2035, a CAGR of 8.20%. North America loses 2.8 points of share by 2035 as Asia Pacific grows faster.
Europe Holds 27.8% Share
Europe is worth USD 1.06 billion in 2025 and USD 2.24 billion by 2035, a CAGR of 7.71%. DC Market Insights attributes Europe’s high share to its large dedicated-server hosting industry, including bare metal operators such as OVHcloud.
Asia Pacific Holds 27.1% Share
Asia Pacific is worth USD 1.04 billion in 2025 and USD 2.90 billion by 2035, a CAGR of 10.83%. China is the largest country market in the region, and India grows fastest. Asia Pacific gains 4.7 points of share, the largest gain of any region.
Latin America Holds 4.9% Share
Latin America is worth USD 187.71 million in 2025 and USD 490.47 million by 2035, a CAGR of 10.08%, with Brazil the largest country market.
Middle East and Africa Holds 3.8% Share
The Middle East and Africa is worth USD 145.57 million in 2025 and USD 431.02 million by 2035, growing at 11.47% a year. DC Market Insights expects local hosting providers and telecom operators in the Gulf states to drive most of that growth.

Country Analysis: Which Countries Buy the Most Micro Servers?
The United States is the largest country market for micro servers at USD 1.25 billion in 2025, 32.5% of global value, followed by China at USD 386.18 million (10.1%) and Germany at USD 251.33 million (6.6%). The 12 largest countries account for 78.6% of 2025 spending.
| Rank | Country | Region | 2025 (USD billion) | Share 2025 | 2035 (USD billion) | CAGR 2025-2035 |
|---|---|---|---|---|---|---|
| 1 | United States | North America | 1.25 | 32.5% | 2.71 | 8.09% |
| 2 | China | Asia Pacific | 0.39 | 10.1% | 0.97 | 9.64% |
| 3 | Germany | Europe | 0.25 | 6.6% | 0.51 | 7.39% |
| 4 | United Kingdom | Europe | 0.20 | 5.1% | 0.39 | 7.23% |
| 5 | Japan | Asia Pacific | 0.18 | 4.6% | 0.43 | 9.31% |
| 6 | France | Europe | 0.17 | 4.5% | 0.38 | 8.10% |
| 7 | Canada | North America | 0.15 | 3.9% | 0.36 | 9.08% |
| 8 | India | Asia Pacific | 0.11 | 2.8% | 0.44 | 15.11% |
| 9 | Netherlands | Europe | 0.10 | 2.5% | 0.20 | 7.35% |
| 10 | Brazil | Latin America | 0.08 | 2.2% | 0.22 | 9.81% |
| 11 | South Korea | Asia Pacific | 0.07 | 2.0% | 0.21 | 10.67% |
| 12 | Australia | Asia Pacific | 0.07 | 1.8% | 0.19 | 10.49% |
India is the fastest-growing large country market at 15.11% a year. Germany, the United Kingdom, France and the Netherlands together account for 18.7% of global value, reflecting Europe’s large dedicated-server hosting industry. The country figures are a DC Market Insights allocation of the regional totals, weighted by each country’s estimated share of hosting capacity, small-business server installations and edge sites.
Forecast Scenarios: How Could the 2035 Forecast Change?
The Micro Server Market reaches USD 9.13 billion by 2035 in the base case, with a range of USD 7.58 billion to USD 10.50 billion across the low and high scenarios.
| Scenario | Assumption from 2026 | 2035 (USD billion) | CAGR 2025-2035 |
|---|---|---|---|
| Low | Memory prices stay high through 2028; edge AI adoption 25% slower; micro tower units decline | 7.58 | 7.06% |
| Base | Units rise to about 2.23 million a year; blended price reaches about USD 4,099 | 9.13 | 9.07% |
| High | Edge inference adoption 20% faster; Arm share reaches one third of units | 10.50 | 10.61% |
The low case reflects a long memory squeeze: buyers stretch refresh cycles and edge projects wait for cheaper accelerators. The high case assumes that compact inference servers become a standard item in retail, factory and telecom sites. Larger single-socket servers are the main swing factor: if mainstream single-socket rack servers fall in price, some hosting buyers will choose fewer, larger servers over many micro nodes.
Competitive Insights: Who Leads the Micro Server Market?
- Supermicro
- Dell Technologies
- Hewlett Packard Enterprise (HPE)
- Lenovo
- Gigabyte
- ASRock Rack
- MiTAC
- MSI
- Altos
- Inspur
- Fujitsu
- AMD
- Intel
- Ampere Computing
DC Market Insights estimates that the three largest system makers, Dell Technologies, HPE and Lenovo, together hold about 37% of the Micro Server Market in 2025, based on our allocation of micro tower, entry single-socket and compact edge shipments by vendor, and that Supermicro leads multi-node micro cloud and microblade nodes. Supermicro reported net sales of USD 22.0 billion for the fiscal year ended June 30, 2025 (Source: Supermicro filing with the US Securities and Exchange Commission). Dell reported USD 19.51 billion of traditional servers and networking revenue for its fiscal year ended January 30, 2026, and HPE reported server revenue of USD 4.5 billion in the fourth quarter of its fiscal 2025, down 5% from a year earlier. Gigabyte, ASRock Rack, MiTAC, MSI and Altos were all named as partners for AMD’s EPYC 4005 launch. AMD and Intel supply most micro server processors according to DC Market Insights estimates (x86 held 84.6% of 2025 value), while Ampere Computing, now owned by SoftBank Group, focuses on high-performance, energy-efficient AI compute based on the Arm platform. The broader server landscape is covered in our Data Center Server Market report.
Recent Developments
- In February 2025, Intel launched the Xeon 6300 series of entry server processors, a refresh of the Xeon E-2400 line that scales up to 8 cores (Source: Phoronix news report).
- In March 2025, Lenovo unveiled the ThinkEdge SE100, described by Lenovo as an entry-level AI inferencing server; the system is 85% smaller than a standard 1U server and stays under 140W (Source: Data Center Dynamics news report).
- In May 2025, AMD launched the EPYC 4005 Series for small and medium businesses and hosted IT service providers, with 1,000-unit prices from USD 239 to USD 699 (Source: AMD press release).
- In May 2025, Supermicro introduced a MicroCloud system with up to 10 server nodes in 3U, built on AMD EPYC 4005 processors, for web and dedicated hosting, cloud gaming and content delivery networks (Source: Supermicro press release).
- In November 2025, SoftBank Group completed its acquisition of all equity interests in Ampere Computing Holdings (Source: SoftBank Group press release).
- In February 2026, Supermicro introduced an AMD EPYC 4005 MicroBlade system with up to 40 server nodes in a 6U enclosure and up to 320 nodes in a standard 48U rack (Source: Supermicro press release).
We follow these launches, deals and platform changes as they happen in our data center industry updates.
Methodology: How We Built the Micro Server Market Model
DC Market Insights built the Micro Server Market as a niche model from units and prices: 3 form factors, each with 16 years (2020 to 2035) of unit shipments and average selling prices, give 96 inputs, and their products sum to the market total of USD 3.83 billion in 2025. Processor list prices from AMD and Intel and HPE’s statement that DRAM and NAND exceed 50% of a traditional server’s bill of materials anchor the price inputs (the model’s 46.8% memory and storage share is a share of selling price, not of component cost); all unit counts and prices are DC Market Insights assumptions. The total was then split by 3 form factors, 3 processor architectures, 4 components, 5 applications, 4 end-users, 5 regions and 12 countries, and every split sums to the market total. Because no company reports micro server sales on their own, the result was tested against two bounds instead of a single top-down check. The ceiling: the 2025 market equals 19.6% of Dell’s traditional servers and networking revenue alone and is smaller than HPE’s server revenue in a single quarter, so it sits well inside the global server market. The floor: OVHcloud alone runs more than 500,000 servers; replacing a fifth of that fleet each year would need about 100,000 servers, against our estimate of about 0.50 million micro servers bought by all hosting and cloud service providers in 2025. The analyst named on this page built the model, and the reviewer checked the arithmetic, the sources and the dates before publication.
Table of contents
- 01Introduction
- 1.1Market Definition and Scope
- 1.2Micro Server Form Factors
- 1.3Currency, Units and Base Year
- 1.4Key Stakeholders
- 02Research Methodology
- 2.1Units × Price Model Design
- 2.2Bound Checks: Server Revenue Ceiling and Hosting Fleet Floor
- 2.3Primary and Secondary Sources
- 2.4Assumptions and Limitations
- 03Executive Summary
- 3.1Market Snapshot, 2025 and 2035
- 3.2Key Findings
- 3.3Analyst Viewpoint
- 04Market Dynamics
- 4.1Drivers
- 4.2Trends
- 4.3Challenges
- 4.4Opportunities
- 05Pricing Analysis
- 5.1Average Selling Price per System by Form Factor, 2020-2035
- 5.2Entry Server Processor List Prices
- 5.3Memory Cost Impact on System Prices
- 06Standards and Regulation
- 6.1EU Ecodesign Regulation 2019/424 for Servers
- 6.2Processor Socket Platforms and Lifecycles
- 07Supply Chain and Value Chain
- 7.1Processor and SoC Suppliers
- 7.2Memory and Storage Suppliers
- 7.3System Makers and ODMs
- 7.4Channels: Hosting Providers, Resellers and Telecom Operators
- 08Market Size and Forecast
- 8.1Market Value, 2020-2035
- 8.2Unit Shipments, 2020-2035
- 8.3Year-on-Year Growth
- 09Market by Form Factor
- 9.1Multi-Node Micro Cloud and MicroBlade Nodes
- 9.2Micro Tower and Compact Standalone Servers
- 9.3Compact Edge Micro Servers
- 10Market by Processor Architecture
- 10.1x86
- 10.2Arm-Based
- 10.3RISC-V and Other
- 11Market by Component
- 11.1Memory and Storage
- 11.2Processor and SoC
- 11.3Board, Chassis and Power
- 11.4Networking, Management and Other
- 12Market by Application
- 12.1Web and Dedicated Hosting
- 12.2SMB and Branch IT
- 12.3Edge Computing and AI Inference
- 12.4Content Delivery and Cloud Gaming
- 12.5Other Applications
- 13Market by End-user
- 13.1Hosting and Cloud Service Providers
- 13.2Enterprises and SMBs
- 13.3Telecom and Edge Operators
- 13.4Government and Education
- 14DC Exclusive: Units × Price Model and Form Factor × Buyer Matrix
- 14.1Matrix Results, 2025
- 14.2Model Inputs and Bound Checks
- 15Market by Region
- 15.1North America: United States, Canada
- 15.2Europe: Germany, United Kingdom, France, Netherlands
- 15.3Asia Pacific: China, Japan, India, South Korea, Australia
- 15.4Latin America: Brazil
- 15.5Middle East and Africa
- 16Regional Cross-Sections
- 16.1Regional Shares, 2025 and 2035
- 16.2Regional Growth Rates, 2025-2035
- 17Country Analysis
- 17.1Top 12 Countries, 2025 and 2035
- 17.2Fastest-Growing Countries
- 18Forecast Scenarios
- 18.1Low, Base and High Cases to 2035
- 18.2Swing Factors
- 19Competitive Landscape
- 19.1Market Concentration
- 19.2Positioning by Form Factor
- 19.3Recent Developments
- 20Company Profiles
- 20.1Supermicro
- 20.2Dell Technologies
- 20.3Hewlett Packard Enterprise (HPE)
- 20.4Lenovo
- 20.5Gigabyte
- 20.6ASRock Rack
- 20.7MiTAC
- 20.8MSI
- 20.9Altos
- 20.10Inspur
- 20.11Fujitsu
- 20.12AMD
- 20.13Intel
- 20.14Ampere Computing
- 21Analyst Recommendations
- 21.1For System Makers
- 21.2For Hosting Providers
- 21.3For Edge and Telecom Operators
- 21.4For Investors
- Fig. 1Micro Server Market Size, 2020-2035
- Fig. 2Micro Server Unit Shipments, 2020-2035
- Fig. 3Average Selling Price per System by Form Factor, 2020-2035
- Fig. 4Micro Server Market by Form Factor, 2025 and 2035
- Fig. 5Micro Server Market by Processor Architecture, 2025 and 2035
- Fig. 6Micro Server Market by Application, 2025 and 2035
- Fig. 7Micro Server Market by End-user, 2025 and 2035
- Fig. 8Form Factor × Buyer Matrix, 2025
- Fig. 9Micro Server Market by Region, 2025 and 2035
- Fig. 10Top 12 Countries, 2025
- Fig. 11Forecast Scenarios, 2035
- Fig. 12Market Concentration, 2025
- Table 1Report Attributes
- Table 2Average Selling Price per System by Form Factor, 2020, 2025, 2030 and 2035
- Table 3Micro Server Market by Form Factor, 2025 and 2035
- Table 4Micro Server Market by Processor Architecture, 2025 and 2035
- Table 5Micro Server Market by Component, 2025 and 2035
- Table 6Micro Server Market by Application, 2025 and 2035
- Table 7Micro Server Market by End-user, 2025 and 2035
- Table 8Form Factor × Buyer Matrix, 2025
- Table 9Micro Server Market by Region, 2025 and 2035
- Table 10Top 12 Countries, 2025 and 2035
- Table 11Forecast Scenarios, 2035
- Table 12Model Inputs and Bound Checks
- Table 13Recent Developments
About this report
Written by Amit Jain and reviewed by Deepti Agrawal, Senior Editor, Research. Figures are built top-down and bottom-up and reconciled before publication, with 2025 as the base year.
Read our methodologyHow we built this
- Historical period2020-2024
- Base year2025
- Forecast period2026-2035
- Sizing approachTop-down + bottom-up
Need more than the report?
Advisory on this market
Due diligence, site selection and market entry work, by the analysts who wrote this report.
See consulting servicesFrequently asked questions
USD 3.83 billion in 2025, rising to USD 9.13 billion by 2035. DC Market Insights estimates the market at USD 2.50 billion in 2020.
9.07% a year from 2025 to 2035, after 8.89% a year between 2020 and 2025, according to DC Market Insights estimates.
Micro towers and compact standalone servers, with 34.5% of 2025 value. Compact edge micro servers are the fastest-growing form factor at 11.82% a year.
About USD 3,420 on average in 2025, from about USD 2,955 for a micro cloud node to about USD 4,560 for a compact edge system, according to DC Market Insights estimates.
North America, with USD 1.39 billion or 36.4% of 2025 value. The Middle East and Africa grows fastest at 11.47% a year.
About 37% of the market is held by Dell Technologies, HPE and Lenovo together, and Supermicro leads multi-node nodes (both DC Market Insights estimates). Other vendors include Gigabyte, ASRock Rack, MiTAC, MSI, Altos, Inspur and Fujitsu.
USD 528.64 million, or 13.8% of 2025 micro server value, and DC Market Insights forecasts USD 2.50 billion by 2035, growing 16.81% a year.
USD 1.25 billion in the United States, or 32.5% of 2025 spending, followed by China at USD 386.18 million. India grows fastest at 15.11% a year (DC Market Insights estimate).
Licences, delivery and payment
Which licence should I choose?
Single User is a view-only PDF for one person. Multi User adds a printable PDF and the Excel data for unlimited users at one location. Enterprise covers your whole company and includes 100 free analyst hours.
How and when will I receive the report?
By email, within 24–48 business hours of payment, in the formats of your licence.
How can I pay?
Securely through PayPal: with a PayPal account, a debit or credit card, or PayPal Pay Later where available. Prices are in US dollars.
Can I see a sample first?
Yes. Request a free sample and we will email it to you.
Can the report be tailored to my needs?
Yes. We can add countries, segments or data cuts. Talk to an analyst about the scope you need.
Can I get an invoice or pay against a purchase order?
Write to sales@dcmarketinsights.com and our team will help.