
AI Server Market Size, Share & Forecast to 2035
Market at a glance
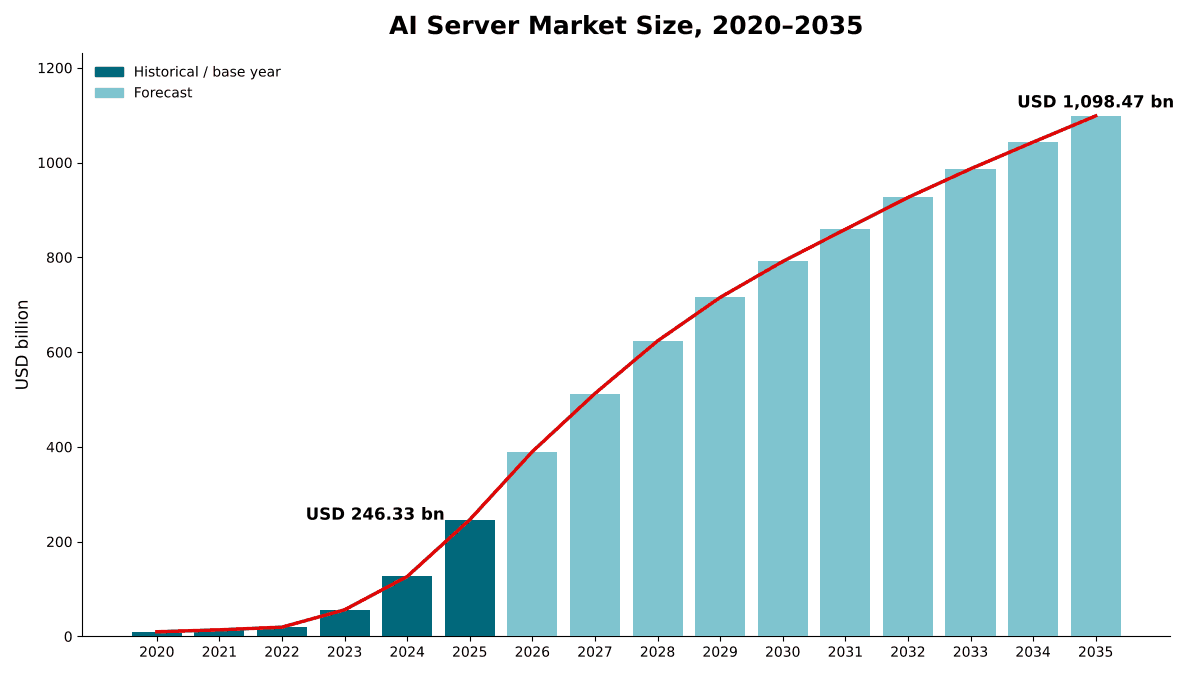
The AI Server market was worth USD 246.33 billion in 2025 and is forecast to reach USD 1,098.47 billion by 2035, growing at a 16.13% CAGR. North America accounts for 57.5% of the market.
 By Amit Jain, Senior Consultant, ICT & Emerging Technologies
 Reviewed by Deepti Agrawal
Last updated 7 Oct 2026
Base year 2025 PDF + Excel
Reviewed by Deepti Agrawal
Last updated 7 Oct 2026
Base year 2025 PDF + Excel
Source: DC Market Insights analysis
Key findings
Accelerator Value Drives a USD 178,500 Average Selling Price
Rack-Scale Systems Reach 57.5% of AI Server Value by 2035
DDR5 Module Prices Rose 60% in Two Months
Sovereign AI Buyers Grow Spending to USD 124.97 Billion
What is inside the report
- 01Introduction
- 02Research Methodology
- 03Executive Summary
- 04Market Dynamics
- 05Pricing Analysis
- 06Standards and Regulation
- 07Supply Chain Analysis
- 08Market Size and Forecast, 2020-2035
- 09Market by Accelerator Type
- 10Market by Workload
- 23chapters
- 2020-2024Historical period
- 2026-2035Forecast period
- 13Companies profiled
Regional insights
- North America57.5%
- Asia Pacific25.3%
- Europe9.9%
- Middle East and Africa5%
- Latin America2.3%
Segmentation
Companies profiled
- Dell Technologies
- Supermicro
- Hewlett Packard Enterprise
- Lenovo
- Foxconn
- Quanta Computer
- Wiwynn
- Inspur
- Huawei
- NVIDIA
- AMD
- Sanmina
- Gigabyte
Recent developments
AMD completed its USD 4.9 billion acquisition of ZT Systems, a builder of AI server racks for cloud operators, and later agreed to sell the manufacturing business to Sanmina for USD 3 billion (Source: Data Center Dynamics news report).
Hewlett Packard Enterprise completed its acquisition of Juniper Networks (Source: HPE press release).
AMD and OpenAI announced a 6 GW agreement, with the first 1 GW deployment of Instinct MI450 GPUs set to begin in the second half of 2026 (Source: AMD press release).
Supermicro expanded its DCBBS line with an AI Rack Series and said it can deliver up to 3,000 racks a month, including 2,000 liquid-cooled racks (Source: Supermicro press release).
NVIDIA reported Data Center revenue of USD 89.00 billion for the second quarter of fiscal 2027 and said Vera Rubin was ramping into full production (Source: NVIDIA press release).
Dell reported a record USD 60.9 billion of AI server orders and a record USD 95 billion backlog for the second quarter of fiscal 2027 and raised its fiscal 2027 AI-optimized server revenue guidance to USD 74.00 billion (Source: Dell earnings release).
Full analysis
The AI Server Market covers complete servers built around artificial intelligence (AI) accelerators that data centers buy to train and run AI models: graphics processing unit (GPU) servers, servers carrying custom application-specific integrated circuits (ASICs), servers with field-programmable gate arrays (FPGAs) and other accelerators, and rack-scale systems sold as a complete rack, valued at first sale. DC Market Insights values the global AI Server Market at USD 246.33 billion in 2025 and forecasts USD 1,098.47 billion by 2035, a CAGR of 16.13%. The 2025 value is built from units and prices: about 1.38 million AI servers shipped at an average selling price of roughly USD 178,500 each. Custom ASIC servers are the fastest-growing segment at 24.68% a year because hyperscalers are moving a growing part of inference onto their own chips, and the Middle East and Africa is the fastest-growing region at 20.75% a year as sovereign AI campuses in Saudi Arabia and the United Arab Emirates fill with accelerated racks.
Executive Summary
The Global AI Server Market size was valued at USD 9.74 billion in 2020, reached USD 246.33 billion in 2025, and is anticipated to reach USD 1,098.47 billion by 2035, at a CAGR of 16.13% during the forecast period.
| Report attribute | Details |
|---|---|
| Historical Period | 2020-2024 |
| Base Year | 2025 |
| Forecast Period | 2026-2035 |
| AI Server Market Size 2025 | USD 246.33 Billion |
| AI Server Market, CAGR | 16.13% |
| AI Server Market Size 2035 | USD 1,098.47 Billion |
AI server spending grew at 90.82% a year between 2020 and 2025, from a niche of about 102,500 accelerated servers into the largest single category of data center hardware. Value rose from USD 126.40 billion in 2024 to USD 246.33 billion in 2025, an increase of 94.9%, as hyperscalers, AI labs and GPU clouds moved from eight-GPU boxes to liquid-cooled racks. DC Market Insights expects a further 58.3% rise in 2026, to USD 390.00 billion, before growth slows to single digits after 2030 as accelerator prices per unit of compute fall and fleets move from build-out to refresh.
Supplier results show how quickly the market has scaled. Dell’s AI server sales went from USD 1.6 billion in fiscal 2024 to USD 9.8 billion in fiscal 2025; in fiscal 2026 the company closed more than USD 64 billion of AI-optimized server orders and shipped more than USD 25 billion, and by the end of the second quarter of fiscal 2027 its backlog had reached a record USD 95 billion. DC Market Insights estimates that AI servers already made up 67.4% of all data center server value in 2025.
Market Scope: What Does the AI Server Market Cover?
The AI Server Market covers complete accelerated server systems installed in data centers, valued at first sale by the original equipment manufacturer (OEM) or original design manufacturer (ODM) in current US dollars, with 2025 as the base year and forecasts to 2035. DC Market Insights sizes it at USD 246.33 billion in 2025.
Included. Servers with one or more GPUs, custom ASICs such as tensor and training chips designed by cloud operators, FPGAs or other AI accelerators; eight-accelerator training servers; one- to four-accelerator inference servers; and rack-scale integrated systems sold as a complete rack of compute trays, switch trays and power shelves. The value includes host processors, memory, local drives, network cards and cooling hardware shipped inside the server or rack.
Excluded. General-purpose and storage servers without accelerators, accelerator cards sold on their own, external storage arrays, data center switches and optical transceivers sold separately, software and support contracts, edge and embedded AI devices outside data center buildings, and installation labor.
How the segments fit together. The accelerator-type, workload, form-factor, cooling, vendor-model and end-user splits each re-cut the same USD 246.33 billion. The market equals the AI and accelerated server segment of our Data Center Server Market report, which also covers general-purpose and storage-dense servers.
Market Drivers: What Drives the AI Server Market?
Three drivers explain most of the growth in the AI Server Market: AI servers that sell for an average of USD 178,500, operator capital spending that BloombergNEF sees close to USD 750 billion for the 14 largest publicly owned data center operators, and the spread of AI from hyperscalers to GPU clouds, governments and enterprises.
Accelerator Value Drives a USD 178,500 Average Selling Price
An eight-GPU training server or a rack-scale compute tray carries accelerators, high-bandwidth memory, high-speed networking and often liquid cooling, so one unit carries the value of a small rack of conventional servers. DC Market Insights estimates the 2025 average selling price of an AI server at USD 178,500, against USD 95,000 in 2020, and models units rising from about 1.38 million in 2025 to 3.66 million in 2035. Chip supplier revenue points the same way: NVIDIA reported Data Center revenue of USD 193.74 billion in fiscal 2026, up 68%, of which USD 31.38 billion was networking, and Data Center revenue of USD 89.00 billion in the second quarter of fiscal 2027 alone, up 117%. AMD’s Data Center segment revenue rose 32% to USD 16.60 billion in 2025, helped by the ramp of its Instinct GPUs.
Operator Capital Spending Rises Toward USD 750 Billion
BloombergNEF expects the capital expenditure of the 14 largest publicly owned data center operators to come close to USD 750 billion in 2026, and it counted more than 23 GW of data center capacity under construction worldwide at the end of September 2025, with 15.9 GW in the United States. DC Market Insights estimates that hyperscale cloud providers bought USD 150.91 billion of AI servers in 2025, 61.3% of the market, and forecasts USD 589.40 billion of hyperscale AI server spending by 2035.
Server Vendors Report Order Books Far Above Shipments
Supermicro reported fiscal 2026 net sales of USD 39.10 billion against USD 22.00 billion a year earlier and expects USD 65.00 billion to USD 72.00 billion in fiscal 2027 (Source: Supermicro filing with the US Securities and Exchange Commission). Dell raised its fiscal 2027 AI-optimized server revenue guidance to USD 74.00 billion from USD 60.00 billion after booking a record USD 60.9 billion of AI server orders in its second quarter. DC Market Insights reads these order books as demand already contracted for 2026 and 2027, which supports the 58.3% rise forecast for 2026.
Market Trends: How Are AI Servers Changing?
AI servers are changing in three ways at once: from single servers to complete racks, from air to liquid cooling, and from training toward inference, which DC Market Insights expects to reach 63.5% of AI server value by 2035.
Rack-Scale Systems Reach 57.5% of AI Server Value by 2035
Large AI buyers now order complete racks, integrated and tested at the factory. NVIDIA’s GB300 NVL72 integrates 72 Blackwell Ultra GPUs and 36 Arm-based Grace CPUs into a single fully liquid-cooled, rack-scale platform, and Amazon Web Services says its Trainium3 UltraServers scale up to 144 Trainium chips. DC Market Insights values rack-scale integrated systems at USD 94.62 billion (38.4%) in 2025 and forecasts USD 631.20 billion by 2035, a CAGR of 20.90%. Factory capacity is being built for that model: Supermicro said in July 2026 that it can deliver up to 3,000 AI racks a month from its facilities around the world.
Liquid-Cooled Servers Grow at 24.28% a Year
Rack-scale GPU systems concentrate so much power in one rack that air cooling can no longer remove the heat. Supermicro said in July 2026 that it can deliver up to 2,000 liquid-cooled racks a month. DC Market Insights values liquid-cooled AI servers at USD 92.47 billion (37.5%) in 2025 and forecasts USD 812.60 billion by 2035, when they reach 74.0% of the market; air-cooled AI servers grow at only 6.39% a year.
Inference Overtakes Training Around 2029
Training servers account for USD 142.38 billion (57.8%) of 2025 value, but inference servers grow at 20.97% a year, against 10.91% for training, as trained models are put into production across search, coding, customer service and agent workloads. DC Market Insights forecasts inference servers at USD 697.32 billion by 2035 and expects them to overtake training around 2029.
Market Challenges: What Holds the AI Server Market Back?
Memory costs, grid power and export controls are the three constraints that DC Market Insights expects to slow the AI Server Market, and together they explain why the forecast growth falls from 58.3% in 2026 to 5.31% by 2035.
DDR5 Module Prices Rose 60% in Two Months
Memory is a large share of the bill of materials of an AI server, in high-bandwidth memory on the accelerator and in DDR5 modules on the host. Samsung’s contract price for 32GB DDR5 memory modules rose to USD 239 in November 2025 from USD 149 in September, an increase of 60%, as the race to build AI data centers absorbed supply. DC Market Insights assumes memory cost pressure lifts AI server prices in 2026 and 2027 and fades after that.
Power Availability Caps Deliveries
A rack-scale AI system cannot ship until the hall that houses it has power and liquid cooling. More than 23 GW of capacity was under construction worldwide at the end of September 2025, according to BloombergNEF; in the DC Market Insights view, the pace at which that capacity is energized sets the pace of AI server deliveries. Supplier backlogs show the gap: Dell entered fiscal 2027 with a backlog of USD 43 billion, which rose to USD 95 billion by the end of its second quarter.
Export Controls Split the Supply Base
In May 2025 the US Department of Commerce said that using Huawei Ascend chips anywhere in the world violates US export controls. DC Market Insights expects Chinese buyers to rely increasingly on domestic accelerator servers, which lowers the US-based suppliers’ addressable market in China.
Market Opportunities: Where Are the New Revenue Pools?
The two largest new revenue pools in the AI Server Market are government and sovereign AI buyers, growing at 21.42% a year, and enterprises, growing at 17.26% a year.
Sovereign AI Buyers Grow Spending to USD 124.97 Billion
Governments, national research centers and state-backed AI companies spent USD 17.95 billion on AI servers in 2025, and DC Market Insights forecasts USD 124.97 billion in 2035, almost seven times the 2025 level. Saudi Arabia and the United Arab Emirates together account for 64.9% of Middle East and Africa AI server value in 2025.
Enterprises Buy USD 148.20 Billion of AI Servers by 2035
Enterprises spent USD 30.16 billion on AI servers in 2025, mostly on GPU servers for private inference and fine-tuning. Lenovo’s Infrastructure Solutions Group reported an AI server business pipeline of USD 21 billion and more than 5,800 customer AI deployments, and Dell has sold AI servers with GPUs to more than 3,000 customers. DC Market Insights forecasts enterprise AI server spending of USD 148.20 billion in 2035, with buyers that previously bought only general-purpose servers adding GPU clusters on site.
GPU and Neocloud Providers Reach USD 196.10 Billion
Specialist GPU cloud operators spent USD 41.22 billion on AI servers in 2025, and DC Market Insights forecasts USD 196.10 billion in 2035. NVIDIA said in August 2026 that its Vera Rubin platform was ramping into full production with racks running at partners including CoreWeave and Nebius as well as the largest cloud providers.
Pricing: How Much Does an AI Server Cost?
An AI server sold for about USD 178,500 on average in 2025, up from USD 95,000 in 2020. These are DC Market Insights estimates of the average selling price at first sale across all form factors, from one-accelerator inference servers to rack-scale compute trays, including memory, drives and networking cards shipped inside the server.
| AI server units and prices | 2020 | 2025 | 2030 | 2035 |
|---|---|---|---|---|
| Units shipped (thousand) | 102.5 | 1,380.0 | 3,020.0 | 3,660.0 |
| Average selling price (USD thousand) | 95.00 | 178.50 | 262.00 | 300.13 |
| Market value (USD billion) | 9.74 | 246.33 | 791.24 | 1,098.47 |
Average prices rise fastest to 2030 as rack-scale systems with more accelerators per tray and larger high-bandwidth memory stacks replace eight-GPU boxes, then flatten as custom ASIC servers, which sell for less per unit, take a larger share. A complete rack-scale system carries the value of many servers, so per-rack spending is far above the per-unit average.
Standards and Regulation: Which Rules Shape AI Servers?
Three sets of rules shape which AI servers a data center may buy: US export controls on advanced AI chips, the European Union ecodesign regulation for servers, and the US ENERGY STAR server specification.
US export controls. The US Department of Commerce formally rescinded the AI Diffusion Rule in May 2025 and at the same time said that using Huawei Ascend chips anywhere in the world violates US export controls.
EU Regulation 2019/424. Under the Commission Regulation (EU) 2019/424 on ecodesign requirements for servers and data storage products, servers placed on the EU market have had to meet its first ecodesign requirements from 1 March 2020, with further requirements phased in from 1 March 2021 and 1 January 2023.
ENERGY STAR Computer Servers Version 4.0. The US Environmental Protection Agency ENERGY STAR Version 4.0 specification for computer servers took effect on January 12, 2024 and added definitions for FPGAs and data processing units (DPUs).
Market Segmentation: Which Segment Leads the AI Server Market?
GPU servers lead the AI Server Market with 78.4% of 2025 value, hyperscale cloud providers lead buyers with 61.3%, and training leads workloads with 57.8%. Custom ASIC servers are the fastest-growing segment at 24.68% a year, ahead of liquid-cooled servers at 24.28%, because hyperscalers are moving inference onto their own chips.
By Accelerator Type: GPU Servers Lead with 78.4%
| Accelerator type | 2025 (USD billion) | Share 2025 | 2035 (USD billion) | CAGR 2025-2035 |
|---|---|---|---|---|
| GPU | 193.12 | 78.4% | 675.56 | 13.34% |
| Custom ASIC | 41.88 | 17.0% | 380.07 | 24.68% |
| FPGA and Other Accelerators | 11.33 | 4.6% | 42.84 | 14.23% |
Custom ASIC servers reach 34.6% of the market by 2035. GPU servers keep the lead at 61.5% because AI labs, GPU clouds and enterprises buy merchant platforms, and AMD’s 6 GW agreement with OpenAI, with the first 1 GW of Instinct MI450 GPUs due from the second half of 2026, widens the merchant GPU supply base.
By Workload: Training Leads with 57.8%
| Workload | 2025 (USD billion) | Share 2025 | 2035 (USD billion) | CAGR 2025-2035 |
|---|---|---|---|---|
| Training | 142.38 | 57.8% | 401.15 | 10.91% |
| Inference | 103.95 | 42.2% | 697.32 | 20.97% |
By Form Factor: 8-Accelerator Servers Lead with 48.1%
| Form factor | 2025 (USD billion) | Share 2025 | 2035 (USD billion) | CAGR 2025-2035 |
|---|---|---|---|---|
| 8-Accelerator Servers | 118.54 | 48.1% | 352.40 | 11.51% |
| Rack-Scale Integrated Systems | 94.62 | 38.4% | 631.20 | 20.90% |
| 1-4 Accelerator Servers | 33.17 | 13.5% | 114.87 | 13.23% |
Rack-scale integrated systems overtake eight-accelerator servers before 2030 in the DC Market Insights forecast.
By Cooling: Air-Cooled Servers Lead with 62.5%
Air-cooled AI servers account for USD 153.86 billion (62.5%) of 2025 value and grow at 6.39% a year to USD 285.87 billion by 2035. Liquid-cooled AI servers account for USD 92.47 billion (37.5%) and grow at 24.28% a year to USD 812.60 billion, taking the lead before 2030.
By Vendor Model: ODM Direct Leads with 56.4%
Servers built by ODMs to a buyer’s own design and sold direct account for USD 138.95 billion (56.4%) in 2025 and grow at 16.51% a year to USD 640.25 billion; our White Box Server Market report covers that channel in detail. Branded OEM AI servers account for USD 107.38 billion (43.6%) and grow at 15.62% a year to USD 458.22 billion. Quanta said AI servers made up more than 70% of its server revenue in the fourth quarter of 2025; Wiwynn’s 2025 revenue rose 163.7% to NT$950.66 billion with AI-related products contributing more than half; and Foxconn’s cloud and networking segment, which includes AI servers, made up 51% of its second-quarter 2026 revenue.
By End-user: Hyperscale Cloud Providers Lead with 61.3%
| End-user | 2025 (USD billion) | Share 2025 | 2035 (USD billion) | CAGR 2025-2035 |
|---|---|---|---|---|
| Hyperscale Cloud Providers | 150.91 | 61.3% | 589.40 | 14.60% |
| GPU and Neocloud Providers | 41.22 | 16.7% | 196.10 | 16.88% |
| Enterprises | 30.16 | 12.2% | 148.20 | 17.26% |
| Government and Sovereign AI | 17.95 | 7.3% | 124.97 | 21.42% |
| Telecom and Other Service Providers | 6.09 | 2.5% | 39.80 | 20.65% |
Hyperscale cloud providers lose 7.6 points of share by 2035 as government, enterprise and telecom buyers build their own AI capacity.
DC Exclusive: The AI Server Units × Price Model and Accelerator × Buyer Matrix
At USD 104.06 billion in 2025, hyperscale GPU servers are the single largest cell of the matrix and 42.2% of all AI server spending. The matrix below cross-tabulates which accelerator is bought and who buys it.
| 2025, USD billion | GPU | Custom ASIC | FPGA and Other | Total |
|---|---|---|---|---|
| Hyperscale Cloud Providers | 104.06 | 38.95 | 7.90 | 150.91 |
| GPU and Neocloud Providers | 40.65 | 0.21 | 0.36 | 41.22 |
| Enterprises | 28.12 | 0.34 | 1.70 | 30.16 |
| Government and Sovereign AI | 15.30 | 1.98 | 0.67 | 17.95 |
| Telecom and Other Service Providers | 4.99 | 0.40 | 0.70 | 6.09 |
| Total | 193.12 | 41.88 | 11.33 | 246.33 |
Hyperscalers buy 93.0% of all custom ASIC server value, because the chips are designed by the cloud operators for their own fleets; every other buyer group spends more than 80% of its AI server budget on GPUs, and GPU and neocloud providers spend 98.6%. A vendor that sells only merchant GPU servers is therefore shut out of about a quarter of hyperscale AI server spending, a share that DC Market Insights expects to rise as custom ASIC servers grow.
The matrix is a DC Market Insights model, not a shipment count. It is built from 38 inputs: 32 unit and price series (16 years each of units and average selling price), 3 accelerator-type splits and 3 checks against chip supplier revenue, and its rows add up to the 5 end-user totals. The units × price model behind these figures and its assumptions are explained on our research methodology page.
Regional Insights: Which Region Leads the AI Server Market?
North America leads the AI Server Market with 57.5% of 2025 value, and the Middle East and Africa is the fastest-growing region at 20.75% a year, because sovereign AI programs in Saudi Arabia and the United Arab Emirates are adding accelerated capacity from a small base.
North America Leads with 57.5% Share
North American buyers spent USD 141.62 billion on AI servers in 2025, and the region is forecast to reach USD 506.80 billion by 2035, a CAGR of 13.60%. The largest cloud operators, AI labs and GPU clouds are headquartered there, and the United States hosted 15.9 GW of the more than 23 GW under construction worldwide at the end of September 2025. North America falls to 46.1% of the market by 2035 as other regions build their own AI capacity, not because its volume slows.
Asia Pacific Holds 25.3% Share
Asia Pacific is worth USD 62.40 billion in 2025 and USD 330.15 billion by 2035, a CAGR of 18.13%. China is the largest market in the region, and Huawei’s Atlas 950 SuperPoD, with 8,192 Ascend neural processing units (NPUs), and Atlas 960 SuperPoD, with 15,488, show how domestic suppliers are building rack-scale systems of their own. India grows fastest among large countries as hyperscale and colocation capacity expands.
Europe Holds 9.9% Share
Europe is worth USD 24.38 billion in 2025 and USD 145.20 billion by 2035, a CAGR of 19.53%. Sovereign cloud and national AI programs in the United Kingdom, Germany and France lift demand for accelerated systems from a lower base than in North America.
Middle East and Africa Holds 5.0% Share
The Middle East and Africa is worth USD 12.31 billion in 2025 and USD 81.12 billion by 2035, the fastest growth of any region at 20.75% a year. The United Arab Emirates and Saudi Arabia lead the region.
Latin America Holds 2.3% Share
Latin America is worth USD 5.62 billion in 2025 and USD 35.20 billion by 2035, a CAGR of 20.14%, led by Brazil, Mexico and Chile.
Country Analysis: Which Countries Buy the Most AI Servers?
The United States is the largest country market for AI servers at USD 129.85 billion in 2025, 52.7% of global value, followed by China at USD 22.76 billion (9.2%) and Canada at USD 11.77 billion (4.8%). The 12 largest countries account for 84.2% of 2025 spending.
| Rank | Country | Region | 2025 (USD billion) | Share 2025 | 2035 (USD billion) | CAGR 2025-2035 |
|---|---|---|---|---|---|---|
| 1 | United States | North America | 129.85 | 52.7% | 458.40 | 13.44% |
| 2 | China | Asia Pacific | 22.76 | 9.2% | 96.30 | 15.52% |
| 3 | Canada | North America | 11.77 | 4.8% | 48.40 | 15.19% |
| 4 | Japan | Asia Pacific | 8.93 | 3.6% | 40.15 | 16.22% |
| 5 | United Kingdom | Europe | 5.34 | 2.2% | 28.60 | 18.27% |
| 6 | Germany | Europe | 4.82 | 2.0% | 26.15 | 18.42% |
| 7 | India | Asia Pacific | 4.61 | 1.9% | 49.80 | 26.87% |
| 8 | South Korea | Asia Pacific | 4.38 | 1.8% | 22.65 | 17.86% |
| 9 | United Arab Emirates | Middle East and Africa | 4.12 | 1.7% | 24.10 | 19.32% |
| 10 | Saudi Arabia | Middle East and Africa | 3.87 | 1.6% | 27.90 | 21.84% |
| 11 | Australia | Asia Pacific | 3.49 | 1.4% | 18.65 | 18.25% |
| 12 | France | Europe | 3.46 | 1.4% | 21.70 | 20.15% |
India is the fastest-growing large country market at 26.87% a year, ahead of Saudi Arabia at 21.84%, and moves from seventh place to third by 2035. The country figures are a DC Market Insights allocation of the regional totals, weighted by each country’s estimated share of installed and new data center capacity and of accelerated server deliveries.
Forecast Scenarios: How Could the 2035 Forecast Change?
The AI Server Market reaches USD 1,098.47 billion by 2035 in the base case, with a range of USD 846.30 billion to USD 1,327.85 billion across the low and high scenarios.
| Scenario | Assumption from 2026 | 2035 (USD billion) | CAGR 2025-2035 |
|---|---|---|---|
| Low | AI server units 20% below base by 2030; average prices flat after 2027 | 846.30 | 13.14% |
| Base | Units reach 3.66 million in 2035 at about USD 300,000 each | 1,098.47 | 16.13% |
| High | Units 15% above base; liquid-cooled rack-scale systems adopted faster | 1,327.85 | 18.35% |
The low case is what a two-year pause in AI capital spending looks like: backlogs are worked down, prices fall and buyers stretch the life of installed GPU fleets. The high case assumes grid connections, memory supply and liquid-cooling capacity keep pace with announced hyperscale and sovereign plans.
Competitive Insights: Who Leads the AI Server Market?
- Dell Technologies
- Supermicro
- Hewlett Packard Enterprise
- Lenovo
- Foxconn
- Quanta Computer
- Wiwynn
- Inspur
- Huawei
- NVIDIA
- AMD
- Sanmina
- Gigabyte
Dell holds about 10% of the AI Server Market (DC Market Insights estimate: more than USD 25 billion of AI-optimized servers shipped in fiscal 2026, set against the USD 246.33 billion market; Dell’s fiscal year ends in late January) (Source: Dell filing with the US Securities and Exchange Commission). Dell expects AI-optimized server revenue of USD 74.00 billion in fiscal 2027, and its AI server revenue reached USD 16.4 billion in the second quarter alone. Supermicro reported fiscal 2026 net sales of USD 39.10 billion. HPE’s server revenue rose 35.3% to USD 6.80 billion in the third quarter of fiscal 2026, with its order backlog at a record level. Lenovo’s Infrastructure Solutions Group reported record revenue of USD 19.20 billion in fiscal 2025/26, up 32%. Foxconn, Quanta and Wiwynn build AI racks to hyperscaler designs. NVIDIA’s fiscal 2026 Data Center compute revenue, about USD 162.36 billion after networking, is the largest single component of AI server value, and AMD added rack-scale design capability by buying ZT Systems.
Recent Developments
- In March 2025, AMD completed its USD 4.9 billion acquisition of ZT Systems, a builder of AI server racks for cloud operators, and later agreed to sell the manufacturing business to Sanmina for USD 3 billion (Source: Data Center Dynamics news report).
- In July 2025, Hewlett Packard Enterprise completed its acquisition of Juniper Networks (Source: HPE press release).
- In October 2025, AMD and OpenAI announced a 6 GW agreement, with the first 1 GW deployment of Instinct MI450 GPUs set to begin in the second half of 2026 (Source: AMD press release).
- In July 2026, Supermicro expanded its DCBBS line with an AI Rack Series and said it can deliver up to 3,000 racks a month, including 2,000 liquid-cooled racks (Source: Supermicro press release).
- In August 2026, NVIDIA reported Data Center revenue of USD 89.00 billion for the second quarter of fiscal 2027 and said Vera Rubin was ramping into full production (Source: NVIDIA press release).
- In September 2026, Dell reported a record USD 60.9 billion of AI server orders and a record USD 95 billion backlog for the second quarter of fiscal 2027 and raised its fiscal 2027 AI-optimized server revenue guidance to USD 74.00 billion (Source: Dell earnings release).
We follow these deals, launches and capacity announcements as they happen in our data center industry updates.
Methodology: How We Built the AI Server Market Model
DC Market Insights built this market bottom-up from 16 annual unit cohorts (2020 to 2035) of AI servers, each priced with an average selling price at first sale: about 102,500 units at USD 95,000 in 2020, 1.38 million units at USD 178,500 in 2025 and 3.66 million units at about USD 300,000 in 2035. The total was split by 3 accelerator types, 2 workloads, 3 form factors, 2 cooling types, 2 vendor models, 5 end-users and 5 regions, and every split sums to its parent total. The result was checked top-down against NVIDIA’s fiscal 2026 Data Center compute revenue of about USD 162.36 billion, which sits inside AI server value as its largest component (65.9% of the 2025 market), against AMD’s Data Center segment revenue, and against the AI server shipments and order books of Dell, Supermicro, Lenovo, Quanta, Wiwynn and Foxconn. The market is kept consistent with the accelerated server segment of the DC Market Insights Data Center Server Market model. Country values allocate each regional total by country weights for installed and new capacity. The analyst named on this page built the model, and the reviewer checked the arithmetic, the sources and the dates before publication.
Table of contents
- 01Introduction
- 1.1Market Definition and Scope
- 1.2Report Coverage and Units
- 1.3Key Questions Answered
- 02Research Methodology
- 2.1Units × Price Model
- 2.2Top-Down Checks Against Supplier Revenue
- 2.3Data Sources and Assumptions
- 03Executive Summary
- 3.1Market Size, 2020, 2025 and 2035
- 3.2Key Findings
- 04Market Dynamics
- 4.1Drivers
- 4.2Trends
- 4.3Challenges
- 4.4Opportunities
- 05Pricing Analysis
- 5.1Average Selling Price of AI Servers, 2020-2035
- 5.2AI Server Units Shipped, 2020-2035
- 06Standards and Regulation
- 6.1US Export Controls
- 6.2EU Regulation 2019/424
- 6.3ENERGY STAR Computer Servers Version 4.0
- 07Supply Chain Analysis
- 7.1Accelerator and Memory Suppliers
- 7.2ODM and OEM Assembly
- 7.3Rack Integration and Liquid Cooling
- 08Market Size and Forecast, 2020-2035
- 8.1Market Value
- 8.2Year-on-Year Growth
- 09Market by Accelerator Type
- 9.1GPU
- 9.2Custom ASIC
- 9.3FPGA and Other Accelerators
- 10Market by Workload
- 10.1Training
- 10.2Inference
- 11Market by Form Factor
- 11.18-Accelerator Servers
- 11.2Rack-Scale Integrated Systems
- 11.31-4 Accelerator Servers
- 12Market by Cooling
- 12.1Air-Cooled
- 12.2Liquid-Cooled
- 13Market by Vendor Model
- 13.1ODM Direct
- 13.2Branded OEM
- 14Market by End-user
- 14.1Hyperscale Cloud Providers
- 14.2GPU and Neocloud Providers
- 14.3Enterprises
- 14.4Government and Sovereign AI
- 14.5Telecom and Other Service Providers
- 15DC Exclusive: Accelerator × Buyer Matrix
- 15.1Matrix, 2025
- 15.2Model Inputs
- 16Market by Region
- 16.1North America (United States, Canada)
- 16.2Asia Pacific (China, Japan, India, South Korea, Australia)
- 16.3Europe (United Kingdom, Germany, France)
- 16.4Middle East and Africa (United Arab Emirates, Saudi Arabia)
- 16.5Latin America (Brazil, Mexico, Chile)
- 17Country Analysis
- 17.1Top 12 Countries, 2025 and 2035
- 17.2Fastest-Growing Countries
- 18Regional Cross-Sections
- 18.1Region Share, 2025 and 2035
- 18.2Region Growth Comparison
- 19Forecast Scenarios
- 19.1Low Scenario
- 19.2Base Scenario
- 19.3High Scenario
- 20Competitive Landscape
- 20.1Market Share Estimate
- 20.2Competitive Positioning
- 21Company Profiles
- 21.1Dell Technologies
- 21.2Supermicro
- 21.3Hewlett Packard Enterprise
- 21.4Lenovo
- 21.5Foxconn
- 21.6Quanta Computer
- 21.7Wiwynn
- 21.8Inspur
- 21.9Huawei
- 21.10NVIDIA
- 21.11AMD
- 21.12Sanmina
- 21.13Gigabyte
- 22Recent Developments
- 22.1Acquisitions and Agreements
- 22.2Product Launches
- 23Analyst Recommendations
- 23.1For Server Vendors
- 23.2For Data Center Operators
- 23.3For Investors
- Fig. 1AI Server Market Size, 2020–2035
- Fig. 2AI Server Market Share by Accelerator Type, 2025 and 2035
- Fig. 3AI Server Market Share by Region, 2025 and 2035
- Fig. 4AI Server Units and Average Selling Price, 2020–2035
- Fig. 5AI Server Market by Workload, 2025 and 2035
- Fig. 6Liquid-Cooled Share of AI Server Value, 2025 and 2035
- Table 1AI Server Market Report Attributes
- Table 2AI Server Units, Prices and Value, 2020, 2025, 2030 and 2035
- Table 3AI Server Market by Accelerator Type, 2025 and 2035
- Table 4AI Server Market by Workload, 2025 and 2035
- Table 5AI Server Market by Form Factor, 2025 and 2035
- Table 6AI Server Market by Cooling, 2025 and 2035
- Table 7AI Server Market by Vendor Model, 2025 and 2035
- Table 8AI Server Market by End-user, 2025 and 2035
- Table 9Accelerator Type × End-user Matrix, 2025
- Table 10AI Server Market by Region, 2025 and 2035
- Table 11Top 12 Countries, 2025 and 2035
- Table 12Forecast Scenarios, 2035
About this report
Written by Amit Jain and reviewed by Deepti Agrawal, Senior Editor, Research. Figures are built top-down and bottom-up and reconciled before publication, with 2025 as the base year.
Read our methodologyHow we built this
- Historical period2020-2024
- Base year2025
- Forecast period2026-2035
- Sizing approachTop-down + bottom-up
Need more than the report?
Advisory on this market
Due diligence, site selection and market entry work, by the analysts who wrote this report.
See consulting servicesFrequently asked questions
USD 246.33 billion in 2025, rising to USD 1,098.47 billion by 2035. DC Market Insights estimates the market at USD 9.74 billion in 2020.
16.13% a year from 2025 to 2035. Growth was far faster, at 90.82% a year, between 2020 and 2025 as hyperscalers, AI labs and GPU clouds built out training clusters.
About USD 178,500 on average in 2025, up from USD 95,000 in 2020, according to DC Market Insights estimates covering servers from one-accelerator inference units to rack-scale compute trays.
GPU servers, with USD 193.12 billion or 78.4% of the market in 2025. Custom ASIC servers are the fastest-growing segment at 24.68% a year.
North America, with USD 141.62 billion or 57.5% of 2025 value. The Middle East and Africa grows fastest at 20.75% a year.
USD 30.16 billion in 2025, rising to USD 148.20 billion by 2035 at 17.26% a year (DC Market Insights estimate), mostly on GPU servers for private inference and fine-tuning.
Dell holds about 10% of the market (DC Market Insights estimate). Supermicro, Hewlett Packard Enterprise, Lenovo, Foxconn, Quanta Computer, Wiwynn, Inspur, Huawei, NVIDIA, AMD, Sanmina and Gigabyte also compete.
The United States, with USD 129.85 billion or 52.7% of 2025 spending, followed by China at USD 22.76 billion. India grows fastest among large country markets at 26.87% a year (DC Market Insights estimate).
Licences, delivery and payment
Which licence should I choose?
Single User is a view-only PDF for one person. Multi User adds a printable PDF and the Excel data for unlimited users at one location. Enterprise covers your whole company and includes 100 free analyst hours.
How and when will I receive the report?
By email, within 24–48 business hours of payment, in the formats of your licence.
How can I pay?
Securely through PayPal: with a PayPal account, a debit or credit card, or PayPal Pay Later where available. Prices are in US dollars.
Can I see a sample first?
Yes. Request a free sample and we will email it to you.
Can the report be tailored to my needs?
Yes. We can add countries, segments or data cuts. Talk to an analyst about the scope you need.
Can I get an invoice or pay against a purchase order?
Write to sales@dcmarketinsights.com and our team will help.