
GPU as a Service Market Size, Share & Forecast to 2035
Market at a glance
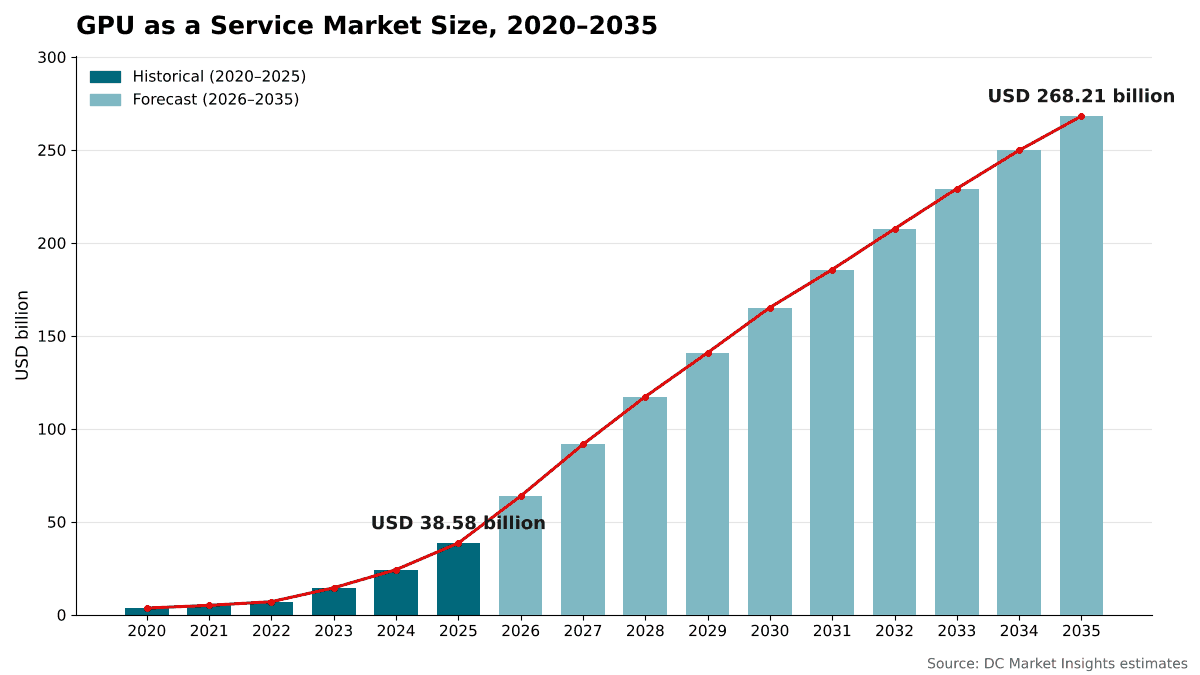
The GPU as a Service market was worth USD 38.58 billion in 2025 and is forecast to reach USD 268.21 billion by 2035, growing at a 21.4% CAGR. North America accounts for 58.6% of the market.
 By Amit Jain, Senior Consultant, ICT & Emerging Technologies
 Reviewed by Deepti Agrawal
Last updated 7 Oct 2026
Base year 2025 PDF + Excel
Reviewed by Deepti Agrawal
Last updated 7 Oct 2026
Base year 2025 PDF + Excel
Source: DC Market Insights analysis
Key findings
CoreWeave Backlog Reached USD 104.00 Billion by June 2026
Blackwell Reaches 86.0% of Rental Revenue by 2035
AWS Cut H100 Instance Prices by up to 45%
Enterprises Reach USD 87.44 Billion by 2035
What is inside the report
- 01Introduction
- 02Research Methodology
- 03Executive Summary
- 04Market Dynamics
- 05Pricing Analysis
- 06Standards and Regulation
- 07Supply Chain and Capacity Analysis
- 08Market Size and Forecast
- 09Market by Service Model
- 10Market by GPU Type
- 22chapters
- 2020-2024Historical period
- 2026-2035Forecast period
- 16Companies profiled
Regional insights
- North America58.6%
- Asia Pacific20.4%
- Europe14.1%
- Middle East and Africa3.9%
- Latin America3%
Segmentation
Companies profiled
- Amazon Web Services (AWS)
- Microsoft Azure
- Google Cloud
- Oracle Cloud Infrastructure
- CoreWeave
- Nebius
- Lambda
- Crusoe
- Nscale
- IREN
- Together AI
- Fluidstack
- Firmus
- GMI Cloud
- Yotta Data Services
- SoftBank Corp
Recent developments
Microsoft signed a five-year GPU capacity agreement with Nebius worth USD 17.40 billion, which could rise to USD 19.40 billion (Source: Data Center Dynamics news report).
CoreWeave expanded its agreement with OpenAI by up to USD 6.50 billion, bringing the total contract value to about USD 22.40 billion (Source: CoreWeave press release).
Nscale signed an expanded deal with Microsoft for about 200,000 NVIDIA GB300 GPUs across Europe and the United States (Source: Nscale press release).
IREN signed a five-year contract worth about USD 9.70 billion, including a 20% prepayment, to give Microsoft access to NVIDIA GB300 GPUs (Source: IREN press release).
CoreWeave reported second-quarter revenue of USD 2.58 billion and a revenue backlog of about USD 104.00 billion (Source: CoreWeave earnings release).
Crusoe raised over USD 3.00 billion in a funding round that values the company at about USD 30.00 billion (Source: Bloomberg Government news report).
Full analysis
The GPU as a Service Market covers the rental of graphics processing unit (GPU) compute capacity by the hour, by the month or under multi-year capacity contracts, sold as cloud instances, bare-metal servers or managed clusters by hyperscale clouds, specialist GPU clouds (neoclouds), sovereign and telecom clouds and GPU marketplaces. DC Market Insights values the global GPU as a Service Market at USD 38.58 billion in 2025 and forecasts USD 268.21 billion by 2035, a CAGR of 21.40%. The 2025 value is built from rented GPU-hours: an average rentable fleet of about 3.10 million H100-equivalent GPUs, running 8,760 hours at 74% billed utilization and a blended realized price of USD 1.92 per H100-equivalent GPU-hour, gives USD 38.58 billion. AI inference is the fastest-growing workload at 27.91% a year because every model that reaches production needs GPUs around the clock, and the Middle East and Africa is the fastest-growing region at 25.91% a year because sovereign AI programs there start from a small rented base.
Executive Summary
The Global GPU as a Service Market size was valued at USD 3.58 billion in 2020, reached USD 38.58 billion in 2025, and is anticipated to reach USD 268.21 billion by 2035, at a CAGR of 21.40% during the forecast period.
| Report attribute | Details |
|---|---|
| Historical Period | 2020-2024 |
| Base Year | 2025 |
| Forecast Period | 2026-2035 |
| GPU as a Service Market Size 2025 | USD 38.58 Billion |
| GPU as a Service Market, CAGR | 21.40% |
| GPU as a Service Market Size 2035 | USD 268.21 Billion |
DC Market Insights estimates that GPU rental revenue grew at 60.88% a year between 2020 and 2025, and by 59.1% in 2025 alone, as large language model training moved from research clusters to rented capacity. Listed GPU cloud specialists confirm the pace: CoreWeave reported 2025 revenue of USD 5.13 billion, up from USD 1.92 billion in 2024, and a revenue backlog of USD 66.80 billion at the end of 2025. Nebius reported fourth-quarter 2025 revenue of USD 227.70 million, up 547% year over year, and annualized run-rate revenue (ARR) of USD 1.25 billion at year-end (Source: Nebius shareholder letter filed with the US Securities and Exchange Commission).
DC Market Insights forecasts growth of 65.5% in 2026, to USD 63.86 billion, as Blackwell-generation capacity contracted in 2025 goes live, then a gradual slowdown to 21.40% a year over the decade. Growth slows because the realized price of each H100-equivalent GPU-hour keeps falling as newer GPUs deliver more compute per dollar, even while the rented fleet grows about 13 times between 2025 and 2035.
Market Scope: What Does the GPU as a Service Market Cover?
The GPU as a Service Market covers every contract under which a buyer pays a provider for time on GPUs that the provider owns or leases and operates in a data center. DC Market Insights sizes it at USD 38.58 billion in 2025, measured as provider revenue in current US dollars, with 2025 as the base year and forecasts to 2035.
Included. On-demand GPU virtual machines and bare-metal instances, reserved instances and capacity blocks, multi-year committed capacity contracts (including capacity that one cloud provider rents from another), spot and interruptible GPU capacity, managed training and inference clusters billed by GPU-hour, GPU capacity sold through marketplaces and aggregators, and the storage and networking charges billed with the GPU instance.
Excluded. Sales of GPUs, servers and data center equipment, colocation of GPUs owned by the customer, AI model application programming interfaces (APIs) priced per token, software-as-a-service applications, and GPUs that a cloud company uses for its own internal products. The hardware and facilities behind GPU clouds are sized in the AI Infrastructure Market report, and the chips themselves in the Data Center GPUs Market report.
How the segments fit together. The service-model, GPU-type, provider-type, workload, end-user and regional splits each divide the full USD 38.58 billion. DC Market Insights converts all GPUs into H100-equivalents, counting one Blackwell B200 as about 2.5 H100-equivalents and one Ampere A100 as about 0.35, so that fleets of different generations can be added together.
Market Drivers: What Drives the GPU as a Service Market?
Multi-year capacity contracts worth tens of billions of US dollars, hyperscale clouds that report being supply constrained and an AI training and inference workload that few buyers can host on their own explain why DC Market Insights forecasts the GPU as a Service Market to grow 65.5% in 2026.
CoreWeave Backlog Reached USD 104.00 Billion by June 2026
Specialist GPU clouds now sell most capacity years ahead. CoreWeave’s revenue backlog rose from USD 66.80 billion at the end of 2025 to about USD 104.00 billion at 30 June 2026, its active power reached 1.5 GW and its contracted power about 3.7 GW (Source: CoreWeave second-quarter 2026 results). Second-quarter 2026 revenue was USD 2.58 billion, against USD 1.21 billion a year earlier. Meta agreed to source USD 14.20 billion of AI infrastructure from CoreWeave in a contract that runs through December 2031, and CoreWeave’s agreements with OpenAI reached a total contract value of up to about USD 22.40 billion in September 2025. DC Market Insights estimates that committed and reserved capacity made up 63.8% of GPU rental revenue in 2025.
Hyperscale Clouds Report Capacity Shortages
Demand for rented GPUs runs ahead of supply at the largest clouds. Google Cloud revenue grew 82% to USD 24.80 billion in the second quarter of 2026, its backlog reached USD 514.00 billion, and Alphabet said it continues to be supply constrained. Amazon Web Services (AWS) grew 36.7% in the same quarter, its fastest growth in 18 quarters, and Microsoft’s Azure revenue surpassed USD 100.00 billion for the first time in fiscal 2026. Oracle Cloud Infrastructure (OCI) revenue rose 121% to USD 7.40 billion in the first quarter of fiscal 2027, with remaining performance obligations of USD 664.00 billion. DC Market Insights values GPU rental by hyperscale clouds at USD 24.07 billion in 2025, 62.4% of the market.
Hyperscalers Rent Capacity from Neoclouds
Hyperscale clouds now buy GPU capacity from specialists to meet their own customers’ demand. Microsoft signed a five-year agreement with Nebius worth USD 17.40 billion, which could rise to USD 19.40 billion, starting at a Vineland, New Jersey site with 300 MW of initial capacity. Microsoft also signed a five-year contract worth about USD 9.70 billion with IREN for NVIDIA GB300 GPUs, an expanded deal with Nscale for about 200,000 NVIDIA GB300 GPUs and a multibillion-dollar agreement with Lambda. DC Market Insights estimates that this hyperscaler and big tech offtake was worth USD 7.18 billion in 2025, 18.6% of the market.
Market Trends: How Is GPU as a Service Changing?
The GPU as a Service Market is moving from Hopper to Blackwell GPUs, from training to inference and from single-provider contracts to marketplaces that pool capacity across many clouds.
Blackwell Reaches 86.0% of Rental Revenue by 2035
DC Market Insights estimates that NVIDIA Hopper GPUs (H100 and H200) earned 58.3% of GPU rental revenue in 2025 and Blackwell-generation GPUs 21.4%. The largest contracts announced since late 2025 specify Blackwell systems: the Microsoft agreements with IREN and Nscale both specify NVIDIA GB300 GPUs, and Lambda’s Microsoft agreement includes GB300 NVL72 systems. DC Market Insights forecasts Blackwell and later generations to grow at 39.51% a year and reach 86.0% of revenue by 2035.
Inference Overtakes Training
A frontier model training run rents a large cluster for weeks or months, while serving the model rents GPUs for as long as the product is live. DC Market Insights estimates that AI model training earned 54.2% of GPU rental revenue in 2025 and AI inference 33.1%. Inference grows at 27.91% a year and reaches 55.8% of the market by 2035, against 33.5% for training, in the DC Market Insights forecast.
Marketplaces Pool GPUs Across Clouds
NVIDIA announced DGX Cloud Lepton in May 2025, a compute marketplace that connects developers with tens of thousands of GPUs from a global network of cloud providers, with partners including CoreWeave, Crusoe, Firmus, Foxconn, GMI Cloud, Lambda, Nebius, Nscale, SoftBank Corp. and Yotta Data Services. DC Market Insights values GPU marketplaces and aggregators at USD 1.35 billion in 2025 and forecasts USD 9.12 billion by 2035, with startups and developers taking 48.9% of marketplace revenue in 2025.
Market Challenges: What Holds the GPU as a Service Market Back?
Falling price per GPU-hour, customer concentration and the power needed for each new cluster are the three constraints that DC Market Insights expects to shape the GPU as a Service Market through 2030.
AWS Cut H100 Instance Prices by up to 45%
AWS cut on-demand prices for its P5 (H100) instances by up to 45%, its P5en instances by up to 26% and its P4d and P4de (A100) instances by up to 33% in June 2025. DC Market Insights models the blended realized price per H100-equivalent GPU-hour falling from USD 2.25 in 2023 to USD 1.92 in 2025 and USD 1.05 in 2035. Each new GPU generation resets the price of older capacity.
A Few Buyers Hold Most Committed Capacity
AI labs and model developers bought 41.5% of rented GPU capacity in 2025 by DC Market Insights estimates, and hyperscaler and big tech offtake another 18.6%. For neocloud specialists, offtake by hyperscalers and big tech made up 52.2% of 2025 revenue in the DC Market Insights matrix. A shift in one hyperscaler’s build-versus-rent decision moves the revenue of a whole provider group.
Power Limits How Fast Capacity Comes Online
The International Energy Agency (IEA) estimates that data centers used about 415 TWh of electricity in 2024, around 1.5% of world consumption, and projects about 945 TWh by 2030. BloombergNEF forecasts US data center power demand rising from almost 35 GW in 2024 to 78 GW by 2035. DC Market Insights ties its fleet forecast to power that providers have already contracted.
Market Opportunities: Where Are the New Revenue Pools?
DC Market Insights identifies the two largest new revenue pools in the GPU as a Service Market as enterprises, growing at 26.67% a year, and sovereign and telecom GPU clouds, growing at 26.88% a year.
Enterprises Reach USD 87.44 Billion by 2035
DC Market Insights estimates that enterprises spent USD 8.22 billion on rented GPU capacity in 2025, 21.3% of the market, and forecasts USD 87.44 billion by 2035, when they nearly match AI labs. In the DC Market Insights view, enterprises rent rather than build because inference workloads are uneven and GPU generations turn over quickly. Hyperscale clouds took 86.1% of enterprise GPU spending in 2025 in the DC Market Insights matrix.
Sovereign and Telecom GPU Clouds Grow Tenfold
Governments want domestic AI capacity under local law. The European Union’s InvestAI initiative aims to mobilize EUR 200.00 billion for AI, including a EUR 20.00 billion fund for AI gigafactories. DC Market Insights values sovereign and telecom GPU clouds at USD 2.43 billion in 2025 and USD 26.28 billion by 2035, with government and research buyers taking 26.7% of their 2025 revenue.
Pricing: How Much Does a GPU-Hour Cost?
An on-demand NVIDIA H100 GPU lists at USD 3.99 to about USD 6.16 per GPU-hour at Lambda and CoreWeave, and an AWS H100 capacity block at USD 5.19 per GPU-hour, while DC Market Insights estimates the blended realized price across all contracts at USD 1.92 per H100-equivalent GPU-hour in 2025. The gap reflects multi-year contracts, which are priced well below list, and older GPUs rented at lower rates.
| Published price (USD per GPU-hour) | Pricing basis | NVIDIA H100 | NVIDIA B200 |
|---|---|---|---|
| Lambda | On-demand, per GPU | 3.99 | 6.69 |
| CoreWeave | On-demand, 8-GPU instance divided by 8 | 6.16 | 8.60 |
| AWS | EC2 Capacity Blocks, US East (N. Virginia) | 5.19 | 12.36 |
CoreWeave lists an 8-GPU HGX H100 instance at USD 49.24 per hour and an 8-GPU HGX B200 instance at USD 68.80 per hour; AWS lists the p5.48xlarge capacity block at USD 41.53 per hour and the p6-b200.48xlarge at USD 98.84 per hour.
| DC Market Insights model | 2020 | 2025 | 2030 | 2035 |
|---|---|---|---|---|
| Realized price (USD per H100-equivalent GPU-hour) | 2.20 | 1.92 | 1.36 | 1.05 |
| Average rentable fleet (million H100-equivalents) | 0.30 | 3.10 | 19.00 | 40.50 |
| Billed utilization | 62% | 74% | 73% | 72% |
The realized price falls about 5.9% a year after 2025 as Blackwell and later GPUs deliver more H100-equivalents of compute for each dollar of rent, while billed utilization stays near 72%.
Standards and Regulation: Which Rules Shape GPU as a Service?
Four sets of rules shape who can rent GPUs and on what terms: the European Union Data Act, the EU Artificial Intelligence Act (AI Act), the EU InvestAI program and United States export controls on advanced AI chips.
EU Data Act (since 12 September 2025). The Data Act requires that customers of cloud and edge services be able to switch from one provider to another, and it will entirely remove switching charges, including data egress charges, from 12 January 2027.
EU AI Act (general-purpose AI obligations from 2 August 2025). The obligations for general-purpose AI (GPAI) models became applicable on 2 August 2025, adding documentation duties for model developers who train on rented GPU clusters.
InvestAI and AI gigafactories (February 2025). The EU initiative aims to mobilize EUR 200.00 billion for AI investment, including a new EUR 20.00 billion European fund for AI gigafactories.
US export controls. The US Department of Commerce announced the rescission of the AI Diffusion Rule in May 2025. DC Market Insights treats export rules as a regional allocation risk rather than a global size risk, because rented capacity can be placed in the countries where GPUs can be shipped.
Market Segmentation: Which Segment Leads the GPU as a Service Market?
DC Market Insights estimates that committed and reserved capacity leads the GPU as a Service Market with 63.8% of 2025 value, NVIDIA Hopper GPUs lead GPU types with 58.3%, hyperscale cloud providers lead provider types with 62.4%, AI model training leads workloads with 54.2% and AI labs lead buyers with 41.5%. AI inference is the fastest-growing segment among workloads at 27.91% a year, because inference demand rises with every user and application rather than with each new model.
By Service Model: Committed and Reserved Capacity Leads with 63.8%
| Service model | 2025 (USD billion) | Share 2025 | 2035 (USD billion) | CAGR 2025-2035 |
|---|---|---|---|---|
| Committed and Reserved Capacity | 24.61 | 63.8% | 156.10 | 20.29% |
| On-Demand Instances | 9.49 | 24.6% | 73.76 | 22.76% |
| Spot and Marketplace Capacity | 4.48 | 11.6% | 38.35 | 23.95% |
Committed capacity loses 5.6 points of share by 2035 as supply catches up with demand and inference buyers prefer flexible terms, but it remains the largest service model in 2035 at 58.2%.
By GPU Type: NVIDIA Hopper Leads with 58.3%
| GPU type | 2025 (USD billion) | Share 2025 | 2035 (USD billion) | CAGR 2025-2035 |
|---|---|---|---|---|
| NVIDIA Hopper (H100, H200) | 22.49 | 58.3% | 16.09 | -3.29% |
| NVIDIA Blackwell and Later | 8.26 | 21.4% | 230.66 | 39.51% |
| NVIDIA Ampere and Older | 5.63 | 14.6% | 1.61 | -11.77% |
| AMD Instinct and Other GPUs | 2.20 | 5.7% | 19.85 | 24.60% |
Hopper revenue declines to USD 16.09 billion by 2035 in the DC Market Insights forecast as its rental price falls and its fleet retires, while AMD Instinct and other GPUs gain 1.7 points of share as buyers add a second GPU supplier for inference.
By Provider Type: Hyperscale Cloud Providers Lead with 62.4%
| Provider type | 2025 (USD billion) | Share 2025 | 2035 (USD billion) | CAGR 2025-2035 |
|---|---|---|---|---|
| Hyperscale Cloud Providers | 24.07 | 62.4% | 147.79 | 19.90% |
| Neocloud GPU Specialists | 10.73 | 27.8% | 85.02 | 23.00% |
| Sovereign and Telecom GPU Clouds | 2.43 | 6.3% | 26.28 | 26.88% |
| GPU Marketplaces and Aggregators | 1.35 | 3.5% | 9.12 | 21.05% |
CoreWeave’s 2025 revenue of USD 5.13 billion equals 47.8% of the neocloud segment in DC Market Insights estimates. Neocloud specialists gain 3.9 points of share by 2035 on the strength of contracted backlogs.
By Workload: AI Model Training Leads with 54.2%
| Workload | 2025 (USD billion) | Share 2025 | 2035 (USD billion) | CAGR 2025-2035 |
|---|---|---|---|---|
| AI Model Training | 20.92 | 54.2% | 89.85 | 15.69% |
| AI Inference | 12.77 | 33.1% | 149.67 | 27.91% |
| Fine-Tuning and Other AI | 2.85 | 7.4% | 18.77 | 20.74% |
| HPC and Rendering | 2.04 | 5.3% | 9.92 | 17.14% |
High-performance computing (HPC) and rendering keep growing at 17.14% a year but lose share to AI workloads.
By End-user: AI Labs and Model Developers Lead with 41.5%
| End-user | 2025 (USD billion) | Share 2025 | 2035 (USD billion) | CAGR 2025-2035 |
|---|---|---|---|---|
| AI Labs and Model Developers | 16.01 | 41.5% | 88.50 | 18.65% |
| Enterprises | 8.22 | 21.3% | 87.44 | 26.67% |
| Hyperscaler and Big Tech Offtake | 7.18 | 18.6% | 34.33 | 16.94% |
| Startups and Developers | 4.32 | 11.2% | 33.26 | 22.64% |
| Government and Research | 2.85 | 7.4% | 24.68 | 24.09% |
DC Market Insights forecasts hyperscaler and big tech offtake to grow slowest, at 16.94% a year, because the largest buyers bring more capacity in-house once their own data centers are built.
DC Exclusive: The GPU-Hour Model and Provider × Buyer Matrix
At USD 11.08 billion in 2025, GPU capacity that hyperscale clouds rent to AI labs and model developers forms the single largest cell of the matrix and 28.7% of all GPU as a Service revenue.
| 2025, USD billion | AI Labs | Enterprises | Hyperscaler Offtake | Startups | Government and Research | Total |
|---|---|---|---|---|---|---|
| Hyperscale Cloud Providers | 11.08 | 7.08 | 1.20 | 2.75 | 1.96 | 24.07 |
| Neocloud GPU Specialists | 3.87 | 0.42 | 5.60 | 0.66 | 0.18 | 10.73 |
| Sovereign and Telecom GPU Clouds | 0.64 | 0.61 | 0.28 | 0.25 | 0.65 | 2.43 |
| GPU Marketplaces and Aggregators | 0.42 | 0.11 | 0.10 | 0.66 | 0.06 | 1.35 |
| Total | 16.01 | 8.22 | 7.18 | 4.32 | 2.85 | 38.58 |
Neocloud GPU specialists earn 52.2% of their revenue from hyperscaler and big tech offtake, and supply 78.0% of all offtake capacity, so their growth depends on how long the largest clouds keep renting rather than building. Enterprises buy 86.1% of their GPU capacity from hyperscale clouds, where their data already sits.
The matrix is a DC Market Insights model, not a survey of contracts. It is built from 77 inputs: 16 years of rentable fleet, billed utilization and realized price (48 inputs), 4 provider-type shares, 5 end-user shares and 20 provider-buyer affinity weights, checked against the disclosed revenue and backlog of 2 listed GPU cloud specialists. The model and its assumptions are explained on our research methodology page.
Regional Insights: Which Region Leads the GPU as a Service Market?
DC Market Insights estimates that North America leads the GPU as a Service Market with 58.6% of 2025 value, and the Middle East and Africa is the fastest-growing region at 25.91% a year. Asia Pacific gains the most share of any region, rising from 20.4% to 24.2% by 2035.
North America Leads with 58.6% Share
DC Market Insights values North American GPU rental at USD 22.61 billion in 2025 and USD 136.51 billion by 2035, a CAGR of 19.70%. The region hosts the frontier AI labs, the three largest hyperscale clouds and the largest neocloud campuses, including Nebius’s Vineland site and IREN’s Childress, Texas campus. North America loses 7.7 points of share by 2035 as other regions build domestic capacity, not because its volume falls.
Asia Pacific Holds 20.4% Share
DC Market Insights values Asia Pacific at USD 7.87 billion in 2025 and USD 64.91 billion by 2035, a CAGR of 23.49%. China is the largest market in the region at USD 2.93 billion, and India grows fastest at 29.99% a year from a small base. Japan follows at USD 1.31 billion in the DC Market Insights country allocation.
Europe Holds 14.1% Share
DC Market Insights values Europe at USD 5.44 billion in 2025 and USD 42.38 billion by 2035, a CAGR of 22.79%. The InvestAI gigafactory fund and the Data Act’s switching rules support domestic GPU clouds, and Nscale’s Microsoft deal includes GPUs in Narvik, Norway, Loughton, United Kingdom, and Sines, Portugal.
Middle East and Africa Holds 3.9% Share
DC Market Insights values the Middle East and Africa at USD 1.50 billion in 2025 and USD 15.02 billion by 2035, a CAGR of 25.91%, the fastest of any region. Saudi Arabia accounts for about a third of regional revenue in the DC Market Insights country allocation. Saudi capital is also flowing into GPU clouds: Aramco Ventures led US-based Together AI’s USD 800.00 million Series C round in July 2026.
Latin America Holds 3.0% Share
DC Market Insights values Latin America at USD 1.16 billion in 2025 and USD 9.39 billion by 2035, a CAGR of 23.26%. Brazil accounts for close to half of regional revenue, with demand mostly from enterprises and startups served by hyperscale cloud regions.
Country Analysis: Which Countries Spend the Most on GPU as a Service?
DC Market Insights estimates that the United States is the largest country market for GPU as a Service at USD 21.19 billion in 2025, 54.9% of global value, followed by China at USD 2.93 billion (7.6%) and the United Kingdom at USD 1.58 billion (4.1%). The 12 largest countries account for 86.9% of 2025 revenue.
| Rank | Country | Region | 2025 (USD billion) | Share 2025 | 2035 (USD billion) | CAGR 2025-2035 |
|---|---|---|---|---|---|---|
| 1 | United States | North America | 21.19 | 54.9% | 126.27 | 19.54% |
| 2 | China | Asia Pacific | 2.93 | 7.6% | 20.64 | 21.56% |
| 3 | United Kingdom | Europe | 1.58 | 4.1% | 11.10 | 21.53% |
| 4 | Canada | North America | 1.42 | 3.7% | 10.24 | 21.84% |
| 5 | Japan | Asia Pacific | 1.31 | 3.4% | 10.26 | 22.85% |
| 6 | Germany | Europe | 1.12 | 2.9% | 8.39 | 22.31% |
| 7 | France | Europe | 0.81 | 2.1% | 6.82 | 23.75% |
| 8 | India | Asia Pacific | 0.81 | 2.1% | 11.16 | 29.99% |
| 9 | South Korea | Asia Pacific | 0.73 | 1.9% | 6.36 | 24.17% |
| 10 | Australia | Asia Pacific | 0.61 | 1.6% | 5.39 | 24.34% |
| 11 | Brazil | Latin America | 0.52 | 1.3% | 4.39 | 23.78% |
| 12 | Saudi Arabia | Middle East and Africa | 0.48 | 1.2% | 5.29 | 27.12% |
India is the fastest-growing country market at 29.99% a year in DC Market Insights estimates, ahead of Saudi Arabia at 27.12%, and India passes Japan, Canada and the United Kingdom by 2035. The country figures are a DC Market Insights allocation of the regional totals, weighted by each country’s estimated share of rentable GPU capacity and of AI lab, enterprise and public-sector demand.
Forecast Scenarios: How Could the 2035 Forecast Change?
DC Market Insights forecasts the GPU as a Service Market at USD 268.21 billion by 2035 in the base case, with a range of USD 197.41 billion to USD 326.95 billion across the low and high scenarios.
| Scenario | Assumption from 2026 | 2035 (USD billion) | CAGR 2025-2035 |
|---|---|---|---|
| Low | Rentable fleet 20% below base in 2035 as more buyers build their own clusters; realized price 8% below base | 197.41 | 17.73% |
| Base | Rentable fleet reaches 40.50 million H100-equivalents; realized price falls to USD 1.05 per GPU-hour | 268.21 | 21.40% |
| High | Rentable fleet 15% above base as inference moves to rented capacity; realized price 6% above base | 326.95 | 23.83% |
Competitive Insights: Who Leads the GPU as a Service Market?
- Amazon Web Services (AWS)
- Microsoft Azure
- Google Cloud
- Oracle Cloud Infrastructure
- CoreWeave
- Nebius
- Lambda
- Crusoe
- Nscale
- IREN
- Together AI
- Fluidstack
- Firmus
- GMI Cloud
- Yotta Data Services
- SoftBank Corp.
Hyperscale cloud providers together hold 62.4% of the GPU as a Service Market in 2025, and CoreWeave, a listed GPU cloud specialist, holds about 13.3% (DC Market Insights estimate: CoreWeave’s 2025 revenue of USD 5.13 billion set against the USD 38.58 billion market; the hyperscale clouds do not report GPU rental revenue separately). CoreWeave’s revenue backlog reached about USD 104.00 billion in June 2026. Nebius ended 2025 with ARR of USD 1.25 billion and targets ARR of USD 7.00 billion to USD 9.00 billion and 800 MW to 1 GW of connected power by the end of 2026; it also signed a USD 3.00 billion, five-year agreement with Meta. Oracle’s infrastructure revenue rose 121% in the first quarter of fiscal 2027. Lambda raised USD 1.50 billion in Series E funding in November 2025, Crusoe raised over USD 3.00 billion at a valuation of about USD 30.00 billion in 2026, and Fluidstack raised USD 830.00 million at a USD 7.50 billion valuation and plans USD 50.00 billion of US AI infrastructure with Anthropic. Firmus, GMI Cloud, Yotta Data Services and SoftBank Corp. were named as NVIDIA DGX Cloud Lepton partners.
Recent Developments
- In September 2025, Microsoft signed a five-year GPU capacity agreement with Nebius worth USD 17.40 billion, which could rise to USD 19.40 billion (Source: Data Center Dynamics news report).
- In September 2025, CoreWeave expanded its agreement with OpenAI by up to USD 6.50 billion, bringing the total contract value to about USD 22.40 billion (Source: CoreWeave press release).
- In October 2025, Nscale signed an expanded deal with Microsoft for about 200,000 NVIDIA GB300 GPUs across Europe and the United States (Source: Nscale press release).
- In November 2025, IREN signed a five-year contract worth about USD 9.70 billion, including a 20% prepayment, to give Microsoft access to NVIDIA GB300 GPUs (Source: IREN press release).
- In August 2026, CoreWeave reported second-quarter revenue of USD 2.58 billion and a revenue backlog of about USD 104.00 billion (Source: CoreWeave earnings release).
- In September 2026, Crusoe raised over USD 3.00 billion in a funding round that values the company at about USD 30.00 billion (Source: Bloomberg Government news report).
We follow these contracts, price changes and capacity announcements as they happen in our data center industry updates.
Methodology: How We Built the GPU as a Service Market Model
DC Market Insights built this market bottom-up from rented GPU-hours. The rentable GPU fleet, converted into H100-equivalents, averages 0.30 million in 2020, 3.10 million in 2025, 19.00 million in 2030 and 40.50 million in 2035. Each year’s fleet is multiplied by 8,760 hours, by a billed utilization rate that rises from 62% in 2020 to 74% in 2025 and settles at 72%, and by a blended realized price per H100-equivalent GPU-hour of USD 2.20 in 2020, USD 1.92 in 2025 and USD 1.05 in 2035. The total was split by 3 service models, 4 GPU types, 4 provider types, 4 workloads, 5 end-user groups and 5 regions, and every split sums to its parent total. The result was checked top-down against the reported revenue of CoreWeave (USD 5.13 billion in 2025) and Nebius (USD 1.25 billion of ARR at the end of 2025), against published on-demand and capacity-block prices from Lambda, CoreWeave and AWS, and against the cloud revenue disclosures of Microsoft, Alphabet, Amazon and Oracle. Country values allocate each regional total by country weights for rentable capacity and demand. The analyst named on this page built the model, and the reviewer checked the arithmetic, the sources and the dates before publication.
Table of contents
- 01Introduction
- 1.1Market Definition and Scope
- 1.2Report Coverage and Segments
- 1.3Currency, Units and H100-Equivalent Conversion
- 1.4Stakeholders and Key Questions
- 02Research Methodology
- 2.1Bottom-Up GPU-Hour Model
- 2.2Top-Down Checks Against Provider Disclosures
- 2.3Primary and Secondary Sources
- 2.4Assumptions and Limitations
- 03Executive Summary
- 3.1Market Snapshot, 2025 and 2035
- 3.2Key Findings
- 3.3Analyst View
- 04Market Dynamics
- 4.1Market Drivers
- 4.2Market Trends
- 4.3Market Challenges
- 4.4Market Opportunities
- 05Pricing Analysis
- 5.1Published On-Demand and Capacity Block Prices
- 5.2Realized Price per H100-Equivalent GPU-Hour, 2020-2035
- 5.3Billed Utilization, 2020-2035
- 06Standards and Regulation
- 6.1EU Data Act Cloud Switching Rules
- 6.2EU AI Act General-Purpose AI Obligations
- 6.3InvestAI and AI Gigafactories
- 6.4US Export Controls
- 07Supply Chain and Capacity Analysis
- 7.1GPU Supply and Generations
- 7.2Data Center Power and Capacity
- 7.3Capacity Offtake Between Providers
- 08Market Size and Forecast
- 8.1Market Size, 2020-2035
- 8.2Rentable GPU Fleet, 2020-2035
- 8.3Year-on-Year Growth, 2021-2035
- 09Market by Service Model
- 9.1Committed and Reserved Capacity
- 9.2On-Demand Instances
- 9.3Spot and Marketplace Capacity
- 10Market by GPU Type
- 10.1NVIDIA Hopper (H100, H200)
- 10.2NVIDIA Blackwell and Later
- 10.3NVIDIA Ampere and Older
- 10.4AMD Instinct and Other GPUs
- 11Market by Provider Type
- 11.1Hyperscale Cloud Providers
- 11.2Neocloud GPU Specialists
- 11.3Sovereign and Telecom GPU Clouds
- 11.4GPU Marketplaces and Aggregators
- 12Market by Workload
- 12.1AI Model Training
- 12.2AI Inference
- 12.3Fine-Tuning and Other AI
- 12.4HPC and Rendering
- 13Market by End-user
- 13.1AI Labs and Model Developers
- 13.2Enterprises
- 13.3Hyperscaler and Big Tech Offtake
- 13.4Startups and Developers
- 13.5Government and Research
- 14DC Exclusive: GPU-Hour Model and Provider × Buyer Matrix
- 14.1Matrix Construction and Inputs
- 14.2Key Cells and Dependencies
- 15Market by Region
- 15.1North America: United States, Canada
- 15.2Asia Pacific: China, Japan, India, South Korea, Australia
- 15.3Europe: United Kingdom, Germany, France
- 15.4Middle East and Africa: Saudi Arabia
- 15.5Latin America: Brazil
- 16Country Analysis
- 16.1Top 12 Countries, 2025 and 2035
- 16.2Fastest-Growing Countries
- 17Regional Cross-Sections
- 17.1Regional Shares, 2025 and 2035
- 17.2Regional Growth Rates, 2025-2035
- 18Forecast Scenarios
- 18.1Low Scenario
- 18.2Base Scenario
- 18.3High Scenario
- 19Competitive Landscape
- 19.1Market Structure and Concentration
- 19.2Capacity Contracts and Backlogs
- 19.3Funding and Valuations
- 20Company Profiles
- 20.1Amazon Web Services (AWS)
- 20.2Microsoft Azure
- 20.3Google Cloud
- 20.4Oracle Cloud Infrastructure
- 20.5CoreWeave
- 20.6Nebius
- 20.7Lambda
- 20.8Crusoe
- 20.9Nscale
- 20.10IREN
- 20.11Together AI
- 20.12Fluidstack
- 20.13Firmus
- 20.14GMI Cloud
- 20.15Yotta Data Services
- 20.16SoftBank Corp.
- 21Recent Developments
- 21.1Capacity Agreements
- 21.2Results and Funding
- 22Analyst Recommendations
- 22.1For GPU Cloud Providers
- 22.2For Enterprise and AI Lab Buyers
- 22.3For Investors
- Fig. 1GPU as a Service Market Size, 2020-2035
- Fig. 2GPU as a Service Market by Region, 2025 and 2035
- Fig. 3GPU as a Service Market Share by Service Model, 2025
- Fig. 4GPU as a Service Market Share by GPU Type, 2025 and 2035
- Fig. 5GPU as a Service Market Share by Provider Type, 2025
- Fig. 6GPU as a Service Market Share by Workload, 2025 and 2035
- Fig. 7Realized Price per H100-Equivalent GPU-Hour, 2020-2035
- Fig. 8Forecast Scenarios, 2035
- Table 1Report Attributes
- Table 2Published GPU-Hour Prices
- Table 3Realized Price, Fleet and Utilization, 2020-2035
- Table 4Market by Service Model, 2025 and 2035
- Table 5Market by GPU Type, 2025 and 2035
- Table 6Market by Provider Type, 2025 and 2035
- Table 7Market by Workload, 2025 and 2035
- Table 8Market by End-user, 2025 and 2035
- Table 9Provider Type × End-user Matrix, 2025
- Table 10Market by Region, 2025 and 2035
- Table 11Top 12 Countries, 2025 and 2035
- Table 12Forecast Scenarios, 2035
About this report
Written by Amit Jain and reviewed by Deepti Agrawal, Senior Editor, Research. Figures are built top-down and bottom-up and reconciled before publication, with 2025 as the base year.
Read our methodologyHow we built this
- Historical period2020-2024
- Base year2025
- Forecast period2026-2035
- Sizing approachTop-down + bottom-up
Need more than the report?
Advisory on this market
Due diligence, site selection and market entry work, by the analysts who wrote this report.
See consulting servicesFrequently asked questions
USD 38.58 billion in 2025, rising to USD 268.21 billion by 2035. DC Market Insights estimates the market at USD 3.58 billion in 2020.
21.40% a year from 2025 to 2035. Growth was faster, at 60.88% a year, between 2020 and 2025 as AI model training moved to rented GPU capacity.
USD 3.99 to about USD 6.16 per on-demand NVIDIA H100 GPU-hour at Lambda and CoreWeave, and USD 5.19 for an AWS H100 capacity block. DC Market Insights estimates the blended realized price at USD 1.92 per H100-equivalent GPU-hour in 2025.
Committed and reserved capacity, with USD 24.61 billion or 63.8% of 2025 revenue. Spot and marketplace capacity grows fastest at 23.95% a year.
AI inference, at 27.91% a year, rising from USD 12.77 billion in 2025 to USD 149.67 billion by 2035, when it reaches 55.8% of the market.
USD 8.22 billion in 2025, or 21.3% of the market, rising to USD 87.44 billion by 2035 at 26.67% a year. Hyperscale clouds supply 86.1% of enterprise GPU capacity.
North America, with USD 22.61 billion or 58.6% of 2025 value. The Middle East and Africa grows fastest at 25.91% a year.
62.4% of 2025 revenue goes to hyperscale cloud providers such as AWS, Microsoft Azure, Google Cloud and Oracle, and about 13.3% to CoreWeave (DC Market Insights estimate). Nebius, Lambda, Crusoe, Nscale, IREN, Together AI and Fluidstack also compete.
Licences, delivery and payment
Which licence should I choose?
Single User is a view-only PDF for one person. Multi User adds a printable PDF and the Excel data for unlimited users at one location. Enterprise covers your whole company and includes 100 free analyst hours.
How and when will I receive the report?
By email, within 24–48 business hours of payment, in the formats of your licence.
How can I pay?
Securely through PayPal: with a PayPal account, a debit or credit card, or PayPal Pay Later where available. Prices are in US dollars.
Can I see a sample first?
Yes. Request a free sample and we will email it to you.
Can the report be tailored to my needs?
Yes. We can add countries, segments or data cuts. Talk to an analyst about the scope you need.
Can I get an invoice or pay against a purchase order?
Write to sales@dcmarketinsights.com and our team will help.