
Data Center Outsourcing Market Size, Share & Forecast to 2035
Market at a glance
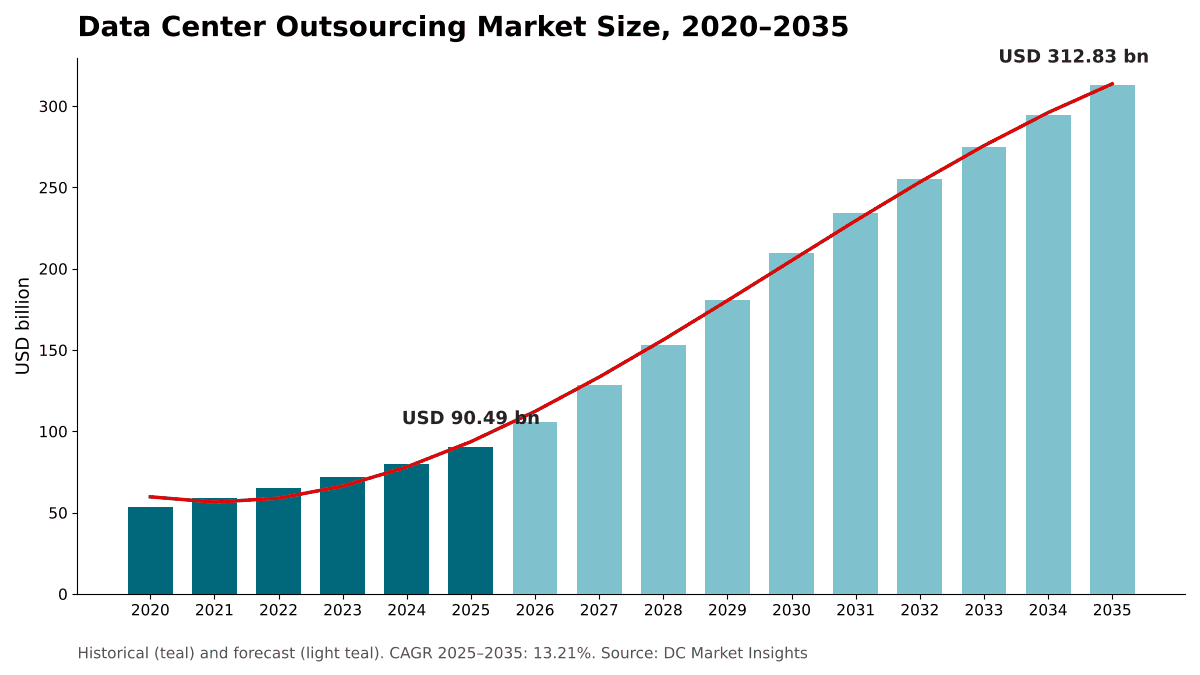
The Data Center Outsourcing market was worth USD 90.49 billion in 2025 and is forecast to reach USD 312.83 billion by 2035, growing at a 13.21% CAGR. North America accounts for 46.8% of the market.
 By Amit Jain, Senior Consultant, ICT & Emerging Technologies
 Reviewed by Deepti Agrawal
Last updated 7 Oct 2026
Base year 2025 PDF + Excel
Reviewed by Deepti Agrawal
Last updated 7 Oct 2026
Base year 2025 PDF + Excel
Source: DC Market Insights analysis
Key findings
Leased Capacity Takes 62 GW of New Deliveries Worldwide by 2030
Wholesale Leases Move from Megawatts to Gigawatts
Vacancy at 1.4% Leaves Little Space for New Tenants
AI and GPU Cloud Leases Add USD 44.53 Billion a Year by 2035
What is inside the report
- 01Introduction
- 02Research Methodology
- 03Executive Summary
- 04Market Dynamics
- 05Pricing Analysis
- 06Standards and Regulation
- 07Value Chain and Supply Analysis
- 08Market Size and Forecast
- 09Market by Service Type
- 10Market by Customer Type
- 21chapters
- 2020-2024Historical period
- 2026-2035Forecast period
- 15Companies profiled
Regional insights
- North America46.8%
- Asia Pacific25.1%
- Europe21.6%
- Latin America3.6%
- Middle East and Africa2.9%
Segmentation
Companies profiled
- Equinix
- Digital Realty
- NTT DATA
- Kyndryl
- Iron Mountain
- AirTrunk
- Aligned Data Centers
- Vantage Data Centers
- CyrusOne
- QTS Data Centers
- STACK Infrastructure
- Applied Digital
- ST Telemedia Global Data Centres
- Princeton Digital Group
- IBM
Recent developments
NTT DC REIT listed on the Singapore Exchange with six data center assets in the United States, Austria and Singapore and about 90 MW of IT load (Source: NTT DATA press release).
AI Infrastructure Partnership, MGX and BlackRock's Global Infrastructure Partners agreed to acquire Aligned Data Centers at an enterprise value of approximately USD 40.00 billion; the deal closed in July 2026 (Source: Aligned press release).
SoftBank Group agreed to acquire DigitalBridge for a total enterprise value of approximately USD 4.00 billion (Source: SoftBank Group press release).
Digital Realty held the final close of its US Hyperscale Data Center Fund with USD 3.25 billion of equity commitments (Source: Digital Realty press release).
AirTrunk announced two new hyperscale campuses in Johor Bahru, Malaysia, with more than 280 MW of combined IT load (Source: AirTrunk announcement).
Vantage Data Centers closed a USD 2.00 billion financing facility for early-stage development across its North American platform (Source: Vantage Data Centers announcement).
Full analysis
The Data Center Outsourcing Market covers the revenue that third parties earn for hosting, connecting and running data center capacity on behalf of other organizations: wholesale and hyperscale colocation, retail colocation, interconnection, managed hosting and infrastructure services, and outsourced facility management and operations. DC Market Insights values the global Data Center Outsourcing Market at USD 90.49 billion in 2025 and forecasts USD 312.83 billion by 2035, a CAGR of 13.21%. The 2025 value is built from capacity and price: about 32.7 GW of billable third-party capacity, priced at roughly USD 1.45 million per MW a year for wholesale space and USD 2.70 million per MW a year for retail space, gives USD 57.28 billion of colocation revenue; interconnection adds USD 4.67 billion, managed hosting and infrastructure services USD 23.40 billion, and facility management contracts on owner-occupied sites USD 5.14 billion. AI and GPU cloud providers are the fastest-growing customer segment at 23.48% a year because they lease almost all of their capacity rather than build it, and the Middle East and Africa is the fastest-growing region at 15.04% a year as sovereign AI programs draw wholesale operators into new markets.
Executive Summary
The Global Data Center Outsourcing Market size was valued at USD 53.30 billion in 2020, reached USD 90.49 billion in 2025, and is anticipated to reach USD 312.83 billion by 2035, at a CAGR of 13.21% during the forecast period.
| Report attribute | Details |
|---|---|
| Historical Period | 2020-2024 |
| Base Year | 2025 |
| Forecast Period | 2026-2035 |
| Data Center Outsourcing Market Size 2025 | USD 90.49 Billion |
| Data Center Outsourcing Market, CAGR | 13.21% |
| Data Center Outsourcing Market Size 2035 | USD 312.83 Billion |
The market grew at 11.17% a year between 2020 and 2025, and 2025 added 12.9% over 2024 as hyperscale cloud providers and AI companies signed large wholesale leases. DC Market Insights expects growth to peak in 2027 and 2028, when the capacity now under construction is energized and billed, and to settle near 6% a year by 2035 as the build cycle matures. DC Market Insights estimates that third parties owned about 41.2 GW, or 40% of global operational capacity, in 2025, and that share rises toward 51% by 2035 because most of the capacity added this decade is delivered through colocation and build-to-suit leases.
Market Scope: What Does the Data Center Outsourcing Market Cover?
The Data Center Outsourcing Market covers every service through which an organization hands the hosting, connection or operation of its data center infrastructure to a third party, valued as provider revenue in current US dollars, with 2025 as the base year and forecasts to 2035. DC Market Insights sizes it at USD 90.49 billion in 2025.
Included. Wholesale and hyperscale colocation, including build-to-suit leases of whole halls and campuses; retail colocation of cabinets, cages and suites below about 1 MW, with power and space; interconnection services such as cross-connects, internet exchange ports and cloud on-ramps; managed hosting, managed private cloud and data center infrastructure outsourcing delivered from provider or customer facilities; and critical facility management and operations contracts at owner-occupied data centers.
Excluded. Public cloud infrastructure as a service sold by the hyperscale cloud providers, application outsourcing, construction and design services, hardware sales, and the energy pass-through that some colocation contracts bill separately at cost.
How the segments fit together. Service type is the primary split. Customer type, deployment size and vertical re-cut the same USD 90.49 billion by who buys and how much each buyer contracts, so each of those splits also sums to the market total. A hyperscale cloud provider counts as a customer of this market when it leases capacity, and stays outside it when it builds and runs its own campus.
Market Drivers: What Drives the Data Center Outsourcing Market?
Three drivers explain most of the growth in the Data Center Outsourcing Market: leased capacity that takes about 60% of global additions to 2030, AI companies that rent rather than build, and enterprises that keep moving workloads out of their own rooms.
Leased Capacity Takes 62 GW of New Deliveries Worldwide by 2030
JLL expects global data center capacity to nearly double from 103 GW to 200 GW by 2030, and expects leased capacity delivered through colocation and build-to-suit models to contribute an additional 62 GW, against about 41 GW of owner-occupied capacity delivered between 2026 and 2030. DC Market Insights uses that 60.2% leased share of additions as the core input of its model, which lifts third-party capacity from about 41.2 GW in 2025 to about 99.6 GW in 2030. North American primary-market supply alone rose 33.7% year over year to 10,903 MW in the first half of 2026, according to CBRE, while vacancy fell to a record low of 1.4%.
AI and GPU Cloud Providers Rent Capacity at Gigawatt Scale
The newest buyers in the market lease almost everything. CoreWeave grew its total contracted power to approximately 3.7 GW and its active power to 1.5 GW by mid-2026, and in August 2025 it leased another 150 MW at an Applied Digital campus after a 250 MW lease signed in June 2025 worth around USD 7.00 billion to Applied Digital over a 15-year term. DC Market Insights estimates that AI and GPU cloud providers spent USD 6.15 billion on outsourced capacity in 2025 and forecasts USD 50.68 billion by 2035, growing 23.48% a year, the fastest of any customer type. The workload economics behind those leases are covered in the Data Center Transformation Market report.
Enterprises Move Workloads Out of Corporate Facilities
The Uptime Institute Global Data Center Survey 2025 found 45% of IT workloads still residing in corporate facilities, and its 2026 survey reports that third-party data center facilities and services now account for a larger share of IT workloads. Digital Realty reported record leasing across its 0 to 1 MW plus interconnection offering in 2025, the product line that serves enterprise moves.
Market Trends: How Is Data Center Outsourcing Changing?
The Data Center Outsourcing Market is shifting toward larger leases, joint-venture capital and interconnection-led retail campuses; deployments above 10 MW rise from 46.3% of value in 2025 to 63.4% in 2035.
Wholesale Leases Move from Megawatts to Gigawatts
Single campuses now plan in gigawatts. Aligned announced a 2 GW campus in Shippingport, Pennsylvania in September 2026, and AirTrunk says that its two new Johor Bahru campuses, with more than 280 MW of IT load, take it to more than 3.3 GW of operating and planned capacity. DC Market Insights forecasts wholesale and hyperscale colocation to grow at 17.62% a year, from USD 36.07 billion in 2025 to USD 182.75 billion by 2035, when it reaches 58.4% of the market.
Joint Ventures and Funds Finance the Build
Operators now raise outside equity for each wave of capacity. Equinix formed a joint venture for its xScale hyperscale data centers in which GIC and CPP Investments each control a 37.5% equity interest, and in 2026 it contributed its Hampton, Georgia asset as a first step to deploying USD 15.00 billion of capital with its partners. Digital Realty closed its US Hyperscale Data Center Fund with USD 3.25 billion of equity commitments in March 2026.
Interconnection Keeps Retail Colocation Sticky
Interconnection is the part of outsourcing that a customer cannot replicate in its own building. Equinix surpassed 500,000 interconnections in 2025 and added a record 9,700 net interconnections in the second quarter of 2026. DC Market Insights values interconnection services at USD 4.67 billion in 2025, growing 12.71% a year, faster than the retail colocation it sits on.
Market Challenges: What Holds the Data Center Outsourcing Market Back?
Power availability and skilled labor are the two constraints that DC Market Insights expects to cap the Data Center Outsourcing Market below its demand through 2028.
Vacancy at 1.4% Leaves Little Space for New Tenants
Buyers are committing to capacity years before it is finished. CBRE counted 7,481.1 MW under construction across North American primary markets in the first half of 2026, with commitments on 80.4% of it, up from 74.3% a year earlier. Asking rates for 250 to 500 kW requirements rose 4.3% in the first half alone. The International Energy Agency (IEA) expects data center electricity consumption to more than double from about 415 TWh in 2024 to around 945 TWh by 2030, so grid connection, not building shell, sets the pace of delivery.
Two-Thirds of Operators Struggle to Staff Sites
Nearly two-thirds of operators reported difficulty retaining staff, finding qualified candidates or both in the Uptime Institute 2025 survey, and more than half of 2026 respondents reported difficulty finding qualified candidates for open jobs. The shortage cuts both ways: it pushes owners to outsource facility operations, which lifts the facility management segment to 13.04% a year, but it also raises contract costs and slows how quickly operators can open new halls. The Data Center Staffing Market report sizes the labor side of that gap.
Market Opportunities: Where Are the New Revenue Pools?
The two largest new revenue pools in the Data Center Outsourcing Market are AI capacity leases, which add USD 44.53 billion of annual revenue by 2035, and new metros in India, Southeast Asia and the Gulf.
AI and GPU Cloud Leases Add USD 44.53 Billion a Year by 2035
AI and GPU cloud providers rise from 6.8% of the market in 2025 to 16.2% in 2035. Oracle and OpenAI agreed in July 2025 to develop 4.5 GW of additional Stargate capacity in the United States, an example of the scale that providers must now plan for.
India Grows Fastest Among Large Countries at 18.65%
AirTrunk plans to invest more than USD 30.00 billion in India by 2030. DC Market Insights forecasts India’s outsourcing market to grow from USD 2.26 billion in 2025 to USD 12.51 billion by 2035, the fastest rate among the 12 largest countries.
Pricing: How Much Does Outsourced Data Center Capacity Cost per kW?
Wholesale capacity earns about USD 1.45 million per MW a year in 2025, equal to about USD 121 per kW a month, and retail colocation about USD 2.70 million per MW a year, or about USD 225 per kW a month. These are DC Market Insights blended in-place averages across all regions, excluding energy pass-through and interconnection fees.
| Revenue per billable MW (USD million a year) | 2020 | 2025 | 2030 | 2035 |
|---|---|---|---|---|
| Wholesale and hyperscale colocation | 1.28 | 1.45 | 1.68 | 1.78 |
| Retail colocation | 2.45 | 2.70 | 3.13 | 3.29 |
| Retail share of billable MW | 30.0% | 24.0% | 19.8% | 15.5% |
Published asking rents bracket these averages. CBRE reports that Chicago had the highest rates among the four major North American markets it tracks in 2026, at USD 200 to USD 230 per kW a month for a 250 to 500 kW requirement, that rates across Europe’s four major markets ranged from USD 165 to USD 265 per kW a month, and that Singapore had the highest Asia Pacific asking rents at an average of USD 403 per kW a month, followed by Tokyo at USD 280 and Sydney at USD 188. JLL forecasts global lease rates to rise at a 5% CAGR through 2030. DC Market Insights models in-place prices rising more slowly, at 3% a year to 2030, because most billed capacity sits on leases signed at older rates.
Standards and Regulation: Which Rules Shape Data Center Outsourcing?
Four groups of rules decide how buyers outsource data center capacity: financial-sector third-party risk rules, EU energy reporting, information security standards and data center design and tier standards.
Digital Operational Resilience Act (DORA). The EU regulation entered into application on 17 January 2025 and establishes an EU-wide oversight framework for critical ICT third-party providers (CTPPs). The European Supervisory Authorities published the first list of designated CTPPs on 18 November 2025.
US third-party risk guidance. The Federal Reserve, FDIC and OCC issued final joint guidance on third-party relationships in June 2023, covering planning, due diligence and third-party selection, contract negotiation, ongoing monitoring and termination. The Monetary Authority of Singapore applies comparable Guidelines on Outsourcing to banks and merchant banks.
EU energy reporting. Under Commission Delegated Regulation (EU) 2024/1364, operators of data centers with an installed IT power demand of at least 500 kW report energy and sustainability indicators to a European database by 15 May every year. In September 2026 the European Commission proposed a common rating scheme, with the first sustainability labels for individual data centers expected in 2027.
Security and design standards. ISO/IEC 27001 is the world’s best-known standard for information security management systems. The Telecommunications Industry Association (TIA) published ANSI/TIA-942 Revision C in May 2024, and the Uptime Institute has issued more than 4,300 Tier Certifications in more than 120 countries.
Market Segmentation: Which Segment Leads the Data Center Outsourcing Market?
Wholesale and hyperscale colocation leads the Data Center Outsourcing Market with 39.9% of 2025 value, hyperscale cloud providers lead customers with 41.0%, and AI and GPU cloud providers are the fastest-growing segment at 23.48% a year because they lease nearly all of the capacity they use.
By Service Type: Wholesale and Hyperscale Colocation Leads with 39.9%
| Service type | 2025 (USD billion) | Share 2025 | 2035 (USD billion) | CAGR 2025-2035 |
|---|---|---|---|---|
| Wholesale and Hyperscale Colocation | 36.07 | 39.9% | 182.75 | 17.62% |
| Managed Hosting and Infrastructure Services | 23.40 | 25.9% | 35.31 | 4.20% |
| Retail Colocation | 21.21 | 23.4% | 61.81 | 11.29% |
| Facility Management and Operations | 5.14 | 5.7% | 17.51 | 13.04% |
| Interconnection Services | 4.67 | 5.2% | 15.45 | 12.71% |
Wholesale gains 18.5 points of share by 2035. Managed hosting and infrastructure services grow slowest at 4.20% a year because public cloud absorbs much of the work that used to sit in managed private environments; Kyndryl reported flat revenue of USD 15.10 billion for fiscal 2026.
By Customer Type: Hyperscale Cloud Providers Lead with 41.0%
| Customer type | 2025 (USD billion) | Share 2025 | 2035 (USD billion) | CAGR 2025-2035 |
|---|---|---|---|---|
| Hyperscale Cloud Providers | 37.11 | 41.0% | 148.60 | 14.88% |
| Enterprises | 30.31 | 33.5% | 65.69 | 8.04% |
| Network and Content Providers | 9.86 | 10.9% | 26.90 | 10.56% |
| Government and Public Sector | 7.06 | 7.8% | 20.96 | 11.50% |
| AI and GPU Cloud Providers | 6.15 | 6.8% | 50.68 | 23.48% |
Enterprises still spend USD 30.31 billion, but their share falls 12.5 points because their spending is split between colocation, managed hosting and public cloud. Government buyers grow faster than enterprises because DC Market Insights expects sovereign-cloud rules to push public workloads into certified domestic facilities.
By Deployment Size: Above 10 MW Leads with 46.3%
Contracts above 10 MW are worth USD 41.90 billion (46.3%) in 2025 and USD 198.34 billion by 2035, growing 16.82% a year. Contracts from 1 to 10 MW are worth USD 22.53 billion (24.9%) and grow 10.64% a year. Deployments below 1 MW, the core of retail colocation and managed hosting, are worth USD 26.06 billion (28.8%) and grow 7.27% a year. CBRE reported that asking rates for 10-plus-MW deployments in North American primary markets rose 6.7% in the first half of 2026, faster than the 4.3% for 250 to 500 kW requirements.
By Vertical: IT and Telecom Lead with 44.2%
IT and telecom companies, including cloud, content and network operators, account for USD 40.00 billion (44.2%) of 2025 demand and grow 14.72% a year. BFSI follows with USD 15.93 billion (17.6%) and grows 10.88% a year; DC Market Insights expects DORA and US third-party guidance to favor certified providers. Retail and e-commerce hold 9.1%, government and defense 8.9%, manufacturing 7.3%, others 6.5% and healthcare 6.4%. Healthcare grows fastest outside IT and telecom at 13.03% a year as imaging archives and clinical AI move into hosted environments.
DC Exclusive: The Lease-or-Build Capacity Model and Service × Customer Matrix
At USD 26.98 billion in 2025, wholesale colocation sold to hyperscale cloud providers is the single largest cell of the matrix and 29.8% of all data center outsourcing revenue. The matrix below cross-tabulates what is outsourced against who buys it.
| 2025, USD billion | Hyperscale Cloud | Enterprises | Network and Content | Government | AI and GPU Cloud | Total |
|---|---|---|---|---|---|---|
| Wholesale and Hyperscale Colocation | 26.98 | 1.73 | 1.87 | 1.02 | 4.47 | 36.07 |
| Retail Colocation | 3.10 | 9.77 | 5.21 | 1.93 | 1.20 | 21.21 |
| Interconnection Services | 1.16 | 1.55 | 1.47 | 0.28 | 0.21 | 4.67 |
| Managed Hosting and Infrastructure Services | 2.90 | 15.77 | 1.11 | 3.39 | 0.23 | 23.40 |
| Facility Management and Operations | 2.97 | 1.49 | 0.20 | 0.44 | 0.04 | 5.14 |
| Total | 37.11 | 30.31 | 9.86 | 7.06 | 6.15 | 90.49 |
Enterprises spend 52% of their outsourcing budget on managed hosting and infrastructure services and only 6% on wholesale space, while hyperscale cloud providers spend 73% on wholesale leases. AI and GPU cloud providers already put 73% of their spend into wholesale capacity, so the wholesale operators that can deliver dense, liquid-cooled halls capture most of the fastest-growing customer type. Network and content providers carry the highest interconnection share at 15%.
The lease-or-build capacity model behind these figures is a DC Market Insights model built from 46 inputs: 16 annual global capacity points (2020 to 2035), 6 historical leased-share points, 2 leased shares of new additions, 2 revenue-per-MW curves, a utilization curve, a retail-mix curve, an interconnection ratio, 2 managed-services inputs, 2 facility-management inputs, 5 customer-type splits, 5 regional splits and 3 company disclosures used as cross-checks. Its two key inputs can be checked by any reader: global capacity (103 GW in 2025) and the share of new capacity that is leased (62 GW of about 103 GW of deliveries from 2026 to 2030). The model and its assumptions are explained on our research methodology page.
Regional Insights: Which Region Leads the Data Center Outsourcing Market?
North America leads the Data Center Outsourcing Market with 46.8% of 2025 value, and the Middle East and Africa is the fastest-growing region at 15.04% a year, because DC Market Insights expects Gulf sovereign AI programs to pull wholesale operators into markets that had little leased capacity before.
North America Leads with 46.8% Share
North America is worth USD 42.35 billion in 2025 and USD 152.97 billion by 2035, a CAGR of 13.70%. JLL counts more than 66 GW of data center capacity under construction in North America, and North American primary-market vacancy stood at 1.4% in the first half of 2026. North America gains 2.1 points of share by 2035, the largest gain of any region.
Asia Pacific Holds 25.1% Share
Asia Pacific is worth USD 22.71 billion in 2025 and USD 79.15 billion by 2035, a CAGR of 13.30%. Cushman & Wakefield counts a regional pipeline of 26.5 GW, of which about 4.8 GW was under construction, and CBRE puts the regional vacancy rate at 7%. DC Market Insights expects Johor, Mumbai and Tokyo to add the most leased capacity.
Europe Holds 21.6% Share
Europe is worth USD 19.55 billion in 2025 and USD 57.87 billion by 2035, a CAGR of 11.46%, the slowest of the five regions. CBRE expects the European colocation segment to remain about 50% larger than hyperscaler self-build capacity at the end of 2026, and expects capacity prices in Frankfurt, London, Amsterdam, Paris and Dublin to rise 12% in 2026. DC Market Insights expects grid queues in those metros to cap volume growth.
Latin America Holds 3.6% Share
Latin America is worth USD 3.26 billion in 2025 and USD 12.20 billion by 2035, a CAGR of 14.11%. CBRE reports that inventory across Latin America’s four largest markets rose 41.3% year over year to 1,045.0 MW in the first quarter of 2026, and DC Market Insights expects São Paulo, Querétaro and Santiago to lead demand.
Middle East and Africa Holds 2.9% Share
The Middle East and Africa is worth USD 2.62 billion in 2025 and USD 10.64 billion by 2035, growing fastest at 15.04% a year from the smallest base. DC Market Insights attributes most of the new wholesale demand to Saudi Arabia and the United Arab Emirates, with Johannesburg, Lagos and Nairobi adding retail colocation demand.
Country Analysis: Which Countries Spend the Most on Data Center Outsourcing?
The United States is the largest country market for data center outsourcing at USD 37.64 billion in 2025, 41.6% of global value, followed by China at USD 8.33 billion (9.2%) and the United Kingdom at USD 4.62 billion (5.1%). The 12 largest countries account for 82.2% of 2025 spending.
| Rank | Country | Region | 2025 (USD billion) | Share 2025 | 2035 (USD billion) | CAGR 2025-2035 |
|---|---|---|---|---|---|---|
| 1 | United States | North America | 37.64 | 41.6% | 137.33 | 13.82% |
| 2 | China | Asia Pacific | 8.33 | 9.2% | 27.22 | 12.58% |
| 3 | United Kingdom | Europe | 4.62 | 5.1% | 13.14 | 11.03% |
| 4 | Germany | Europe | 3.98 | 4.4% | 11.26 | 10.96% |
| 5 | Japan | Asia Pacific | 3.89 | 4.3% | 11.89 | 11.82% |
| 6 | Canada | North America | 3.62 | 4.0% | 12.83 | 13.49% |
| 7 | France | Europe | 2.44 | 2.7% | 7.20 | 11.41% |
| 8 | India | Asia Pacific | 2.26 | 2.5% | 12.51 | 18.65% |
| 9 | Australia | Asia Pacific | 2.17 | 2.4% | 7.82 | 13.67% |
| 10 | Singapore | Asia Pacific | 1.90 | 2.1% | 5.32 | 10.84% |
| 11 | Netherlands | Europe | 1.81 | 2.0% | 5.01 | 10.71% |
| 12 | Brazil | Latin America | 1.72 | 1.9% | 6.57 | 14.34% |
India is the fastest-growing large country market at 18.65% a year, ahead of Brazil at 14.34%, and India passes Japan and Germany before 2035. Singapore grows only 10.84% a year because DC Market Insights expects power allocation to keep limiting new capacity. The country figures are a DC Market Insights allocation of the regional totals, weighted by each country’s estimated share of installed and new third-party capacity.
Forecast Scenarios: How Could the 2035 Forecast Change?
The Data Center Outsourcing Market reaches USD 312.83 billion by 2035 in the base case, with a range of USD 249.05 billion to USD 370.71 billion across the low and high scenarios.
| Scenario | Assumption from 2026 | 2035 (USD billion) | CAGR 2025-2035 |
|---|---|---|---|
| Low | Capacity additions 15% below base; leased share of additions 50% to 2030 and 45% after; wholesale prices rise 1.5% a year | 249.05 | 10.65% |
| Base | Capacity reaches 200 GW in 2030 and 275 GW in 2035; leased share of additions 60.2% to 2030 and 55% after | 312.83 | 13.21% |
| High | Capacity additions 12% above base; leased share of additions 68% to 2030 and 62% after; wholesale prices rise 4% a year | 370.71 | 15.14% |
The low case is what a hyperscale return to self-build looks like: the largest cloud providers take more of their pipeline in-house and AI companies slow their lease commitments. The high case assumes that grid connections keep pace with the capacity under construction and that AI companies keep leasing rather than building.
Competitive Insights: Who Leads the Data Center Outsourcing Market?
- Equinix
- Digital Realty
- NTT DATA
- Kyndryl
- Iron Mountain
- AirTrunk
- Aligned Data Centers
- Vantage Data Centers
- CyrusOne
- QTS Data Centers
- STACK Infrastructure
- Applied Digital
- ST Telemedia Global Data Centres
- Princeton Digital Group
- IBM
Equinix is the market leader with about 10.2% of the Data Center Outsourcing Market in 2025 (DC Market Insights estimate: Equinix’s 2025 revenue of USD 9.22 billion set against the USD 90.49 billion market). Equinix and Digital Realty together hold about 16% of the 2026 market, based on their 2026 revenue guidance of USD 10.21 billion to USD 10.29 billion (Source: Equinix filing with the US Securities and Exchange Commission) and USD 6.60 billion to USD 6.70 billion against DC Market Insights’ USD 105.92 billion estimate for 2026. Equinix grew revenue 16% year over year in the second quarter of 2026 and has 52 projects underway across 33 markets. Digital Realty signed fourth-quarter 2025 bookings expected to generate USD 400 million of annualized rental revenue and ended 2025 with a backlog of USD 817 million. Iron Mountain is energizing 400 MW of data center capacity over the 24 months from early 2026, and NTT DATA had about 1,500 MW of data center capacity as of March 2025. In the DC Market Insights assessment, private wholesale platforms such as Aligned, Vantage, AirTrunk, CyrusOne, QTS and STACK compete mainly for hyperscale and AI leases, while Kyndryl and IBM compete mainly in managed infrastructure services; Kyndryl reported fiscal 2026 signings of USD 13.50 billion.
Recent Developments
- In July 2025, NTT DC REIT listed on the Singapore Exchange with six data center assets in the United States, Austria and Singapore and about 90 MW of IT load (Source: NTT DATA press release).
- In October 2025, AI Infrastructure Partnership, MGX and BlackRock’s Global Infrastructure Partners agreed to acquire Aligned Data Centers at an enterprise value of approximately USD 40.00 billion; the deal closed in July 2026 (Source: Aligned press release).
- In December 2025, SoftBank Group agreed to acquire DigitalBridge for a total enterprise value of approximately USD 4.00 billion (Source: SoftBank Group press release).
- In March 2026, Digital Realty held the final close of its US Hyperscale Data Center Fund with USD 3.25 billion of equity commitments (Source: Digital Realty press release).
- In April 2026, AirTrunk announced two new hyperscale campuses in Johor Bahru, Malaysia, with more than 280 MW of combined IT load (Source: AirTrunk announcement).
- In September 2026, Vantage Data Centers closed a USD 2.00 billion financing facility for early-stage development across its North American platform (Source: Vantage Data Centers announcement).
We follow these deals, leases and capacity announcements as they happen in our data center industry updates.
Methodology: How We Built the Data Center Outsourcing Market Model
DC Market Insights built this market bottom-up from 16 annual global capacity points (2020 to 2035), anchored on 103 GW in 2025 and 200 GW in 2030. Third-party capacity was set at 35.2% of the global total in 2020, rising to 40.0% in 2025, and 60.2% of capacity added from 2026 to 2030 and 55% of capacity added after 2030 was assigned to leased models. Billable capacity takes the prior year’s leased base plus 35% of each year’s additions, at 86% to 89% utilization. Billable MW were split into retail and wholesale and priced with two revenue-per-MW curves; interconnection was added as 20.5% to 25.0% of retail revenue, managed hosting and infrastructure services as a separate revenue line growing 4.2% a year, and facility management as a share of owner-occupied capacity at about USD 0.19 million per MW a year in 2025. The total was split by 5 service types, 5 customer types, 3 deployment sizes, 7 verticals and 5 regions, and every split sums to the market total. The result was checked top-down against the disclosed revenue and 2026 guidance of Equinix and Digital Realty, against Kyndryl’s total revenue as a ceiling for its managed infrastructure business, and against published asking rents and capacity counts. The analyst named on this page built the model, and the reviewer checked the arithmetic, the sources and the dates before publication.
Table of contents
- 01Introduction
- 1.1Market Definition and Scope
- 1.2Research Objectives
- 1.3Currency, Base Year and Forecast Period
- 1.4Key Stakeholders
- 02Research Methodology
- 2.1Lease-or-Build Capacity Model
- 2.2Bottom-Up Revenue Build
- 2.3Top-Down Cross-Checks
- 2.4Data Sources and Fact Verification
- 2.5Assumptions and Limitations
- 03Executive Summary
- 3.1Market Snapshot, 2025 and 2035
- 3.2Key Findings
- 3.3Analyst View
- 04Market Dynamics
- 4.1Market Drivers
- 4.2Market Trends
- 4.3Market Challenges
- 4.4Market Opportunities
- 05Pricing Analysis
- 5.1Revenue per Billable MW, Wholesale and Retail
- 5.2Asking Rents by Metro
- 5.3Price Outlook to 2035
- 06Standards and Regulation
- 6.1Digital Operational Resilience Act (DORA)
- 6.2US Third-Party Risk Guidance
- 6.3EU Energy Efficiency Directive and Delegated Regulation (EU) 2024/1364
- 6.4ISO/IEC 27001, ANSI/TIA-942-C and Uptime Tier Certification
- 07Value Chain and Supply Analysis
- 7.1Land, Power and Development
- 7.2Capital Providers and Joint Ventures
- 7.3Operators and Service Providers
- 7.4Customers and Contract Models
- 08Market Size and Forecast
- 8.1Market Size, 2020-2035
- 8.2Global and Leased Capacity, 2020-2035
- 8.3Billable Capacity and Utilization
- 09Market by Service Type
- 9.1Wholesale and Hyperscale Colocation
- 9.2Retail Colocation
- 9.3Interconnection Services
- 9.4Managed Hosting and Infrastructure Services
- 9.5Facility Management and Operations
- 10Market by Customer Type
- 10.1Hyperscale Cloud Providers
- 10.2Enterprises
- 10.3Network and Content Providers
- 10.4Government and Public Sector
- 10.5AI and GPU Cloud Providers
- 11Market by Deployment Size
- 11.1Below 1 MW
- 11.21 to 10 MW
- 11.3Above 10 MW
- 12Market by Vertical
- 12.1IT and Telecom
- 12.2BFSI
- 12.3Retail and E-commerce
- 12.4Government and Defense
- 12.5Manufacturing
- 12.6Healthcare
- 12.7Others
- 13DC Exclusive: Lease-or-Build Capacity Model
- 13.1Service Type x Customer Type Matrix, 2025
- 13.2Leased Share of New Capacity
- 13.3Implications for Operators and Buyers
- 14Market by Region
- 14.1North America (United States, Canada)
- 14.2Europe (United Kingdom, Germany, France, Netherlands)
- 14.3Asia Pacific (China, Japan, India, Australia, Singapore)
- 14.4Latin America (Brazil)
- 14.5Middle East and Africa
- 15Country Analysis
- 15.1Top 12 Countries, 2025 and 2035
- 15.2Fastest-Growing Country Markets
- 16Regional Cross-Sections
- 16.1Regional Share Shifts, 2025 to 2035
- 16.2Regional Growth Comparison, 2025-2035
- 17Forecast Scenarios
- 17.1Low Scenario
- 17.2Base Scenario
- 17.3High Scenario
- 18Competitive Landscape
- 18.1Market Share Analysis, 2025
- 18.2Retail and Interconnection Leaders
- 18.3Wholesale and Hyperscale Platforms
- 18.4Managed Infrastructure Service Providers
- 19Recent Developments
- 19.1Mergers and Acquisitions
- 19.2Funds and Joint Ventures
- 19.3Capacity Announcements
- 20Company Profiles
- 20.1Equinix
- 20.2Digital Realty
- 20.3NTT DATA
- 20.4Kyndryl
- 20.5Iron Mountain
- 20.6AirTrunk
- 20.7Aligned Data Centers
- 20.8Vantage Data Centers
- 20.9CyrusOne
- 20.10QTS Data Centers
- 20.11STACK Infrastructure
- 20.12Applied Digital
- 20.13ST Telemedia Global Data Centres
- 20.14Princeton Digital Group
- 20.15IBM
- 21Analyst Recommendations
- 21.1For Colocation Operators
- 21.2For Enterprise Buyers
- 21.3For Investors
- Fig. 1Data Center Outsourcing Market Size, 2020-2035
- Fig. 2Data Center Outsourcing Market by Service Type, 2025 and 2035
- Fig. 3Data Center Outsourcing Market by Region, 2025 and 2035
- Fig. 4Global and Leased Data Center Capacity, 2020-2035
- Fig. 5Revenue per Billable MW, 2020-2035
- Fig. 6Data Center Outsourcing Market by Customer Type, 2025 and 2035
- Fig. 7Forecast Scenarios, 2035
- Table 1Report Attributes
- Table 2Revenue per Billable MW, 2020, 2025, 2030 and 2035
- Table 3Market by Service Type, 2025 and 2035
- Table 4Market by Customer Type, 2025 and 2035
- Table 5Market by Deployment Size, 2025 and 2035
- Table 6Market by Vertical, 2025 and 2035
- Table 7Service Type x Customer Type Matrix, 2025
- Table 8Market by Region, 2025 and 2035
- Table 9Top 12 Countries, 2025 and 2035
- Table 10Forecast Scenarios, 2035
- Table 11Model Inputs and Sources
About this report
Written by Amit Jain and reviewed by Deepti Agrawal, Senior Editor, Research. Figures are built top-down and bottom-up and reconciled before publication, with 2025 as the base year.
Read our methodologyHow we built this
- Historical period2020-2024
- Base year2025
- Forecast period2026-2035
- Sizing approachTop-down + bottom-up
Need more than the report?
Advisory on this market
Due diligence, site selection and market entry work, by the analysts who wrote this report.
See consulting servicesFrequently asked questions
USD 90.49 billion in 2025, rising to USD 312.83 billion by 2035. DC Market Insights estimates the market at USD 53.30 billion in 2020.
13.21% a year from 2025 to 2035, up from 11.17% a year between 2020 and 2025, as leased capacity takes about 60% of the capacity added worldwide to 2030.
Wholesale and hyperscale colocation, with USD 36.07 billion or 39.9% of the market in 2025. It is also the fastest-growing service type at 17.62% a year and reaches USD 182.75 billion by 2035.
About USD 121 per kW a month for wholesale capacity and about USD 225 per kW a month for retail colocation in 2025, according to DC Market Insights blended in-place averages that exclude energy pass-through.
Hyperscale cloud providers, with USD 37.11 billion or 41.0% of 2025 spending. AI and GPU cloud providers grow fastest at 23.48% a year, from USD 6.15 billion to USD 50.68 billion by 2035.
North America, with USD 42.35 billion or 46.8% of 2025 value. The Middle East and Africa grows fastest at 15.04% a year.
Equinix leads with about 10.2% of the market (DC Market Insights estimate based on its 2025 revenue of USD 9.22 billion). Digital Realty, NTT DATA, Kyndryl, Iron Mountain, AirTrunk, Aligned, Vantage, CyrusOne, QTS and STACK also compete.
USD 37.64 billion in the United States, or 41.6% of 2025 spending, followed by China at USD 8.33 billion. India grows fastest among large country markets at 18.65% a year (DC Market Insights estimate).
Licences, delivery and payment
Which licence should I choose?
Single User is a view-only PDF for one person. Multi User adds a printable PDF and the Excel data for unlimited users at one location. Enterprise covers your whole company and includes 100 free analyst hours.
How and when will I receive the report?
By email, within 24–48 business hours of payment, in the formats of your licence.
How can I pay?
Securely through PayPal: with a PayPal account, a debit or credit card, or PayPal Pay Later where available. Prices are in US dollars.
Can I see a sample first?
Yes. Request a free sample and we will email it to you.
Can the report be tailored to my needs?
Yes. We can add countries, segments or data cuts. Talk to an analyst about the scope you need.
Can I get an invoice or pay against a purchase order?
Write to sales@dcmarketinsights.com and our team will help.