
Data Center Refrigerant Market Size, Share & Forecast to 2035
Market at a glance
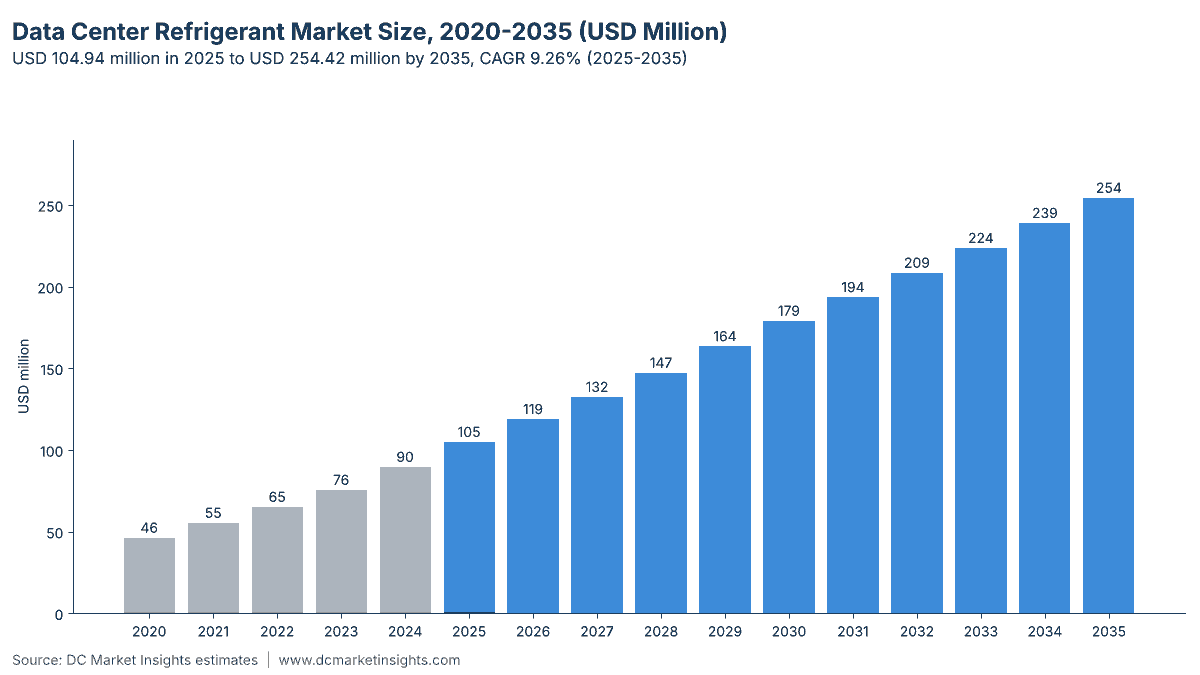
The Data Center Refrigerant market was worth USD 104.9 million in 2025 and is forecast to reach USD 254.4 million by 2035, growing at a 9.26% CAGR.
 By Amit Jain, Senior Consultant, ICT & Emerging Technologies
 Reviewed by Deepti Agrawal
Last updated 11 Oct 2026
Base year 2025 PDF + Excel
Reviewed by Deepti Agrawal
Last updated 11 Oct 2026
Base year 2025 PDF + Excel
Key findings
1. New capacity adds about 2,000 tonnes of charge a year
HFO chillers become the default for large sites
Liquid cooling removes refrigerant from most AI heat
Retrofit of legacy R-410A units: USD 36.25 million by 2035
What is inside the report
- 01Introduction
- 02Research Methodology
- 03Executive Summary
- 04Market Dynamics
- 05Pricing Analysis
- 06Standards and Regulation
- 07Market Analysis by Refrigerant Type
- 08Market Analysis by Application
- 09Market Analysis by Sales Channel
- 10Market Analysis by Data Center Type
- 23chapters
- 2020-2024Historical period
- 2026-2035Forecast period
- 14Companies profiled
Segmentation
Companies profiled
- Chemours
- Solstice Advanced Materials
- Arkema
- Daikin Industries
- Orbia (Koura)
- SRF Limited
- Navin Fluorine International
- Gujarat Fluorochemicals
- Dongyue Group
- Zhejiang Juhua
- AGC
- A-Gas
- Hudson Technologies
- Linde
Recent developments
Regulation (EU) 2024/573 was published in the Official Journal of the European Union, setting GWP limits for chillers and air conditioning from 2027 (Source: STULZ).
Chemours and Navin Fluorine International agreed to manufacture Chemours' Opteon two-phase immersion cooling fluid, with capacity beginning in 2026 (Source: Chemours).
the EPA GWP limit of 700 for chillers with exiting fluid at or above -30 °C took effect (Source: EPA).
Chemours reported 56% growth in Opteon refrigerant sales for 2025 (Source: Chemours).
Schneider Electric launched its first compliant 11 kW InRow cooling unit on R-32 ahead of the 1 January 2027 deadline (Source: Schneider Electric).
the EPA published a draft analysis of HFC allocation data for 2022-2025 (Source: EPA).
Full analysis
The Data Center Refrigerant Market covers the refrigerant gases that data centers buy to charge and service their mechanical cooling plant: hydrofluorocarbon (HFC), hydrofluoroolefin (HFO) and natural refrigerants filled into chillers, direct expansion (DX) computer room air conditioners (CRAC) and in-row units, and pumped two-phase cooling loops. DC Market Insights values the global Data Center Refrigerant Market at USD 104.94 million in 2025 and forecasts USD 254.42 million by 2035, a compound annual growth rate (CAGR) of 9.26%. The build receipt: about 12.0 GW of new information technology (IT) capacity in 2025 needed about 2,000 tonnes of new refrigerant charge worth USD 39.87 million at original equipment manufacturer (OEM) bulk prices, and the 23,239 tonnes already installed in operating sites took 1,394 tonnes of service top-up worth USD 48.80 million plus USD 16.27 million of retrofit and recharge gas, which adds up to USD 104.94 million. Natural refrigerants grow fastest at 25.50% a year because the European Union (EU) F-gas Regulation sets lower global warming potential (GWP) ceilings each phase, and the Middle East and Africa is the fastest-growing region at 12.46% a year as new campuses there rely on mechanical cooling in hot climates.
Executive Summary
The Global Data Center Refrigerant Market size was valued at USD 46.34 million in 2020, reached USD 104.94 million in 2025, and is anticipated to reach USD 254.42 million by 2035, at a CAGR of 9.26% during the forecast period.
| Report attribute | Details |
|---|---|
| Historical Period | 2020-2024 |
| Base Year | 2025 |
| Forecast Period | 2026-2035 |
| Data Center Refrigerant Market Size 2025 | USD 104.94 Million |
| Data Center Refrigerant Market, CAGR | 9.26% |
| Data Center Refrigerant Market Size 2035 | USD 254.42 Million |
DC Market Insights estimates that refrigerant spending by data centers grew 17.76% a year between 2020 and 2025, faster than new capacity, because the blended contractor price of refrigerant rose from about USD 22 per kg to about USD 35 per kg as the United States (US) American Innovation and Manufacturing (AIM) Act phase-down and the EU F-gas quota cut HFC supply. Value rose 17.1% in 2025 over the USD 89.65 million of 2024. From 2025 to 2035 the forecast slows to 9.26% a year: new capacity more than doubles to 27 GW a year, but AI halls cool most of their heat with liquid loops and dry coolers, so only about 30% of AI hall heat runs through vapour-compression plant against 80% in a conventional hall. Service gas stays the largest channel at USD 48.80 million in 2025, 46.5% of value, because every operating chiller and CRAC unit leaks and is topped up each year.
Market Scope: What Does the Data Center Refrigerant Market Cover?
The Data Center Refrigerant Market is measured as the value of refrigerant sold for data center cooling, at OEM bulk prices for factory and site charge and at contractor prices for service gas, in current US dollars. It totals USD 104.94 million in 2025.
Included
- HFC refrigerants such as R-410A, R-407C and R-134a in chillers and CRAC units (USD 65.06 million in 2025).
- HFO refrigerants and HFO blends such as R-1234ze, R-1233zd, R-513A and R-515B (USD 23.09 million).
- Low-GWP mildly flammable (A2L) blends R-32 and R-454B that replace R-410A (USD 13.64 million).
- Natural refrigerants: ammonia, carbon dioxide and propane in chillers serving data centers (USD 3.15 million).
- Refrigerant in pumped two-phase direct-to-chip loops and pumped refrigerant economisers (USD 2.02 million).
Excluded
- Water, propylene glycol and dielectric coolants, which DC Market Insights sizes in the Data Center Cooling Fluids Market.
- Cooling equipment, piping, manifolds and labour; manifolds are covered in the Data Center Liquid Cooling Manifolds Market.
- Refrigerant in office HVAC (heating, ventilation and air conditioning) on data center campuses and in semiconductor fabs.
How the segments fit together
Each kilogram is counted once. Refrigerant type, application, sales channel and data center type are four views of the same USD 104.94 million, and each split sums to the total in every year from 2020 to 2035. The DC Exclusive matrix crosses application with sales channel.
Market Drivers: What Drives the Data Center Refrigerant Market?
1. New capacity adds about 2,000 tonnes of charge a year
DC Market Insights estimates 12.0 GW of new IT capacity in 2025, rising to 22 GW in 2030 and 27 GW in 2035. With cooling plant sized at 1.2 kW per kW of IT for redundancy and a large air-cooled chiller holding about 0.16 kg of refrigerant per kW, the new-build charge rises from about 2,000 tonnes in 2025 to 3,743 tonnes in 2035. The charge figure comes from manufacturer data: Airedale’s I-Chill IZ4 R-1234ze chiller range lists 140 kg across two circuits for a 966 kW unit (Airedale technical manual), and Carrier sells its AquaForce 30XF air-cooled screw chiller from 390 to 2,100 kW on R-1234ze (Carrier).
2. Regulation forces a refrigerant change in every new unit
The US Environmental Protection Agency (EPA) Technology Transitions rule sets a GWP limit of 700 for data center, computer room air conditioning and IT equipment cooling systems installed from 1 January 2027, after a 700 limit for chillers from 1 January 2026 (EPA, page updated August 2026). Schneider Electric states that R-410A and R-407C, used by most data center air conditioners today, are well above this limit (Schneider Electric, April 2026). Each switch moves spending from HFCs at about USD 31 per kg to HFO and A2L gases at USD 33-49 per kg, which DC Market Insights models as a 14% rise in the blended contractor price between 2025 and 2035.
3. The installed bank keeps service demand rising
The installed refrigerant bank in data centers grows from 23,239 tonnes in 2025 to 45,309 tonnes in 2035 as the installed IT base rises from 116 GW to about 314 GW. A 6% annual top-up rate on that bank gives 1,394 tonnes of service gas in 2025 and 2,719 tonnes in 2035, worth USD 48.80 million and USD 108.74 million at contractor prices.
Market Trends: What Are the Key Trends in the Data Center Refrigerant Market?
HFO chillers become the default for large sites
HFO and HFO blend refrigerants grow 18.12% a year, from USD 23.09 million in 2025 to USD 122.12 million in 2035. STULZ has moved its chillers to R-1234ze with a GWP of 1 and its medium multi-scroll chillers from R-410A to R-454B with a GWP of 466 (STULZ).
Pumped two-phase cooling arrives with AI racks
Pumped two-phase cooling is the fastest-growing application at 35.70% a year, from USD 2.02 million in 2025 to USD 42.77 million in 2035, as DC Market Insights expects 10% of AI hall capacity to use two-phase cold plates by 2035 against 2% in 2025. Solstice Advanced Materials lists cold-plate liquid cooling among its two-phase applications for data centers (Solstice Advanced Materials).
Pumped refrigerant economisers cut compressor hours
Vertiv’s Liebert DSE system uses pumped refrigerant economisation, and Digital Realty reported more than four years of use of the technology when Vertiv launched 250 kW and 400 kW versions in December 2017 (DCD, December 2017). DC Market Insights counts the refrigerant in these systems within DX Precision Air Conditioning, which reaches USD 68.08 million by 2035.
Market Challenges: What Holds Back the Data Center Refrigerant Market?
Liquid cooling removes refrigerant from most AI heat
In an AI hall, DC Market Insights assumes only 30% of the heat passes through vapour-compression plant, against 80% in a conventional hall. As AI halls rise from 35% to 66% of new capacity, the mechanical share of new heat falls from 62.5% in 2025 to 47.0% in 2035, which cuts about USD 22 million from the 2035 new-build charge compared with a constant mix.
Price swings in the HFC market
The EPA’s July 2026 draft analysis of HFC allocation data notes that standard contractor-sized cylinders of R-410A were being sold at one-third of the expected cost in 2024, and that US HFC consumption has been much closer to the yearly limit under the AIM Act (EPA, July 2026). A 10% fall in the blended price would remove USD 10.49 million from the 2025 value.
Market Opportunities: Where Are the Opportunities in the Data Center Refrigerant Market?
Retrofit of legacy R-410A units: USD 36.25 million by 2035
Retrofit and recharge gas grows from USD 16.27 million in 2025 to USD 36.25 million in 2035 as operators recover high-GWP charge from older CRAC units and refill with R-513A or R-454B. Suppliers that pair reclaim services with new gas sales can reach this pool.
Two-phase fluids for AI racks: USD 42.77 million by 2035
Chemours agreed in May 2025 that Navin Fluorine International will manufacture its Opteon two-phase immersion cooling fluid, with an ultra-low GWP of 10 and capacity beginning in 2026 (Chemours, May 2025). Pumped two-phase refrigerants for cold plates add USD 40.75 million of new value between 2025 and 2035 in the DC Market Insights model.
Pricing: How Much Does Data Center Refrigerant Cost per kg?
DC Market Insights estimates a blended contractor price of USD 35.00 per kg in 2025, and OEM bulk buyers pay about 55% of that, or USD 19.25 per kg. New-build refrigerant content was about USD 3,323 per MW of new IT capacity in 2025.
| Year | Blended contractor price (USD/kg) | OEM bulk price (USD/kg) | New-build refrigerant per MW of IT (USD) |
|---|---|---|---|
| 2020 | 22.00 | 12.10 | 2,681 |
| 2025 | 35.00 | 19.25 | 3,323 |
| 2030 | 37.50 | 20.62 | 3,447 |
| 2035 | 40.00 | 22.00 | 4,053 |
Public price anchors: a Washington State contract catalogue lists R-410A at USD 349.00 for a 25 lb cylinder (USD 30.78 per kg), R-134a at USD 349.90 for 30 lb (USD 25.71 per kg), R-513A at USD 519.90 for 30 lb (USD 38.20 per kg), R-454B at USD 439.90 for 20 lb (USD 48.49 per kg) and R-32 at USD 300.00 for 20 lb (USD 33.07 per kg) (Washington State Department of Enterprise Services). A US electrical distributor lists a 20 lb R-454B cylinder at USD 823.59, or USD 90.78 per kg (Elliott Electric Supply).
Standards and Regulation: Which Rules Govern Data Center Refrigerants?
- US AIM Act Technology Transitions (40 CFR Part 84, Subpart B): GWP limit of 700 for data center, computer room air conditioning and IT equipment cooling systems from 1 January 2027; 700 for chillers with exiting fluid at or above -30 °C from 1 January 2026 (EPA).
- EU F-gas Regulation (EU) 2024/573: published on 20 February 2024; chillers above 12 kW limited to fluorinated gases with GWP below 750 from 2027, and split air conditioning above 12 kW to GWP below 750 from 2029 and below 150 from 2033 (STULZ summary of the regulation).
- ASHRAE Standard 34 safety classes: A1 (non-flammable) for R-513A and R-515B and A2L (mildly flammable) for R-1234ze, R-32 and R-454B, which drive room-size and leak-detection rules (Solstice Advanced Materials).
- Kigali Amendment to the Montreal Protocol: the global HFC phase-down that the AIM Act and F-gas quotas implement.
Market Segmentation: Which Refrigerant Type Leads the Data Center Refrigerant Market?
HFC refrigerants lead with USD 65.06 million, 62.0% of 2025 value, but their value falls 3.45% a year to USD 45.80 million in 2035 as new units switch gas. Chillers are the largest application, service and top-up the largest channel and hyperscale data centers the largest buyer type.
By Refrigerant Type
| Refrigerant Type | 2025 (USD million) | Share 2025 | 2035 (USD million) | CAGR 2025-2035 |
|---|---|---|---|---|
| HFC Refrigerants (R-410A and R-134a) | 65.06 | 62.0% | 45.80 | -3.45% |
| HFO and HFO Blend Refrigerants | 23.09 | 22.0% | 122.12 | 18.12% |
| Low-GWP A2L Blends (R-32 and R-454B) | 13.64 | 13.0% | 55.97 | 15.16% |
| Natural Refrigerants | 3.15 | 3.0% | 30.53 | 25.50% |
By Application
Chillers account for USD 60.66 million, 57.8% of 2025 value, because large sites run central chilled-water plant. DX precision air conditioning follows with USD 42.26 million, as each kW of DX cooling holds about 0.55 kg of refrigerant in long split-system pipework.
| Application | 2025 (USD million) | Share 2025 | 2035 (USD million) | CAGR 2025-2035 |
|---|---|---|---|---|
| Chillers | 60.66 | 57.8% | 143.57 | 9.00% |
| DX Precision Air Conditioning | 42.26 | 40.3% | 68.08 | 4.88% |
| Pumped Two-Phase Cooling | 2.02 | 1.9% | 42.77 | 35.70% |
By Sales Channel
Service and top-up gas leads with USD 48.80 million in 2025. OEM factory charge grows fastest at 10.62% a year, reaching USD 109.43 million in 2035.
| Sales Channel | 2025 (USD million) | Share 2025 | 2035 (USD million) | CAGR 2025-2035 |
|---|---|---|---|---|
| OEM Factory Charge | 39.87 | 38.0% | 109.43 | 10.62% |
| Service and Top-Up | 48.80 | 46.5% | 108.74 | 8.34% |
| Retrofit and Recharge | 16.27 | 15.5% | 36.25 | 8.34% |
By Data Center Type
Hyperscale data centers spend USD 35.68 million in 2025 and grow 12.37% a year; enterprise sites grow only 3.23% a year as workloads move to colocation and cloud.
| Data Center Type | 2025 (USD million) | Share 2025 | 2035 (USD million) | CAGR 2025-2035 |
|---|---|---|---|---|
| Hyperscale Data Centers | 35.68 | 34.0% | 114.49 | 12.37% |
| Colocation Data Centers | 31.48 | 30.0% | 81.41 | 9.97% |
| Enterprise Data Centers | 31.48 | 30.0% | 43.25 | 3.23% |
| Edge Data Centers | 6.30 | 6.0% | 15.27 | 9.26% |
DC Exclusive: The Refrigerant Spend Matrix by Application and Sales Channel
The DC Market Insights Refrigerant Spend Matrix is a DC Market Insights model built from 21 inputs. It shows that 62.0% of 2025 refrigerant value is bought after the cooling plant is installed, as service top-up or retrofit gas, so the operator’s maintenance contract, not the OEM order, decides most of the spending.
| Application (2025, USD million) | OEM Factory Charge | Service and Top-Up | Retrofit and Recharge | Total |
|---|---|---|---|---|
| Chillers | 23.56 | 27.83 | 9.27 | 60.66 |
| DX Precision Air Conditioning | 14.29 | 20.97 | 7.00 | 42.26 |
| Pumped Two-Phase Cooling | 2.02 | 0.00 | 0.00 | 2.02 |
Regional Insights: Which Region Leads the Data Center Refrigerant Market?
North America leads with USD 42.50 million, 40.5% of 2025 value, and the Middle East and Africa grows fastest at 12.46% a year to USD 15.27 million in 2035, because new Gulf campuses run mechanical cooling for most of the year.
| Region | 2025 (USD million) | Share 2025 | 2035 (USD million) | CAGR 2025-2035 |
|---|---|---|---|---|
| North America | 42.50 | 40.5% | 94.14 | 8.28% |
| Europe | 25.19 | 24.0% | 50.88 | 7.28% |
| Asia Pacific | 28.33 | 27.0% | 81.41 | 11.13% |
| Latin America | 4.20 | 4.0% | 12.72 | 11.72% |
| Middle East and Africa | 4.72 | 4.5% | 15.27 | 12.46% |
North America
North American refrigerant spending reaches USD 94.14 million in 2035 at 8.28% a year. The 1 January 2027 EPA limit of GWP 700 for new data center cooling moves the region’s new-build charge to R-454B, R-32 and HFOs; Schneider Electric launched an 11 kW InRow unit on R-32 in April 2026 (Schneider Electric).
Europe
Europe spends USD 25.19 million in 2025, 24.0% of value, with the highest price per kg under the F-gas quota. The 2027 GWP 750 limit for chillers above 12 kW pushes new plant to R-1234ze, and Europe grows 7.28% a year, the slowest region, as free cooling covers most hours.
Asia Pacific
Asia Pacific grows 11.13% a year from USD 28.33 million to USD 81.41 million, led by China at USD 10.20 million in 2025 and India, the fastest-growing large country at 18.24% a year.
Latin America
Latin America grows 11.72% a year to USD 12.72 million in 2035, with Brazil at USD 1.89 million in 2025 and still largely on R-410A and R-134a plant.
Middle East and Africa
The Middle East and Africa spends USD 4.72 million in 2025 and USD 15.27 million in 2035, as high ambient temperatures keep chillers running more hours and raise top-up demand.
Country Analysis: Which Countries Spend the Most on Data Center Refrigerant?
The United States spends USD 37.83 million, 36.0% of 2025 value, followed by China at USD 10.20 million. India is the fastest-growing large country at 18.24% a year.
| Rank | Country | Region | 2025 (USD million) | 2035 (USD million) | CAGR 2025-2035 |
|---|---|---|---|---|---|
| 1 | United States | North America | 37.83 | 82.84 | 8.15% |
| 2 | China | Asia Pacific | 10.20 | 26.87 | 10.17% |
| 3 | Germany | Europe | 5.04 | 10.18 | 7.28% |
| 4 | Japan | Asia Pacific | 4.82 | 12.21 | 9.74% |
| 5 | Canada | North America | 4.67 | 11.30 | 9.24% |
| 6 | United Kingdom | Europe | 4.53 | 8.65 | 6.68% |
| 7 | France | Europe | 2.77 | 5.60 | 7.29% |
| 8 | Australia | Asia Pacific | 2.55 | 7.33 | 11.14% |
| 9 | Netherlands | Europe | 2.27 | 4.32 | 6.65% |
| 10 | India | Asia Pacific | 1.98 | 10.58 | 18.24% |
| 11 | Singapore | Asia Pacific | 1.98 | 4.88 | 9.44% |
| 12 | Brazil | Latin America | 1.89 | 5.60 | 11.47% |
Forecast Scenarios: What Is the Range for Data Center Refrigerant Spending in 2035?
DC Market Insights puts 2035 refrigerant spending between USD 181.59 million and USD 331.78 million, with a base case of USD 254.42 million.
| Scenario | 2035 (USD million) | Assumptions |
|---|---|---|
| Low | 181.59 | 4% top-up rate, prices 10% lower, 15% less new mechanical cooling |
| Base | 254.42 | 6% top-up rate, USD 40 per kg contractor price in 2035 |
| High | 331.78 | 8% top-up rate, prices 10% higher, 10% more new mechanical cooling |
Under the low-case assumptions the 2025 value would be USD 79.81 million, so the top-up rate is the single largest uncertainty in the model.
Competitive Insights: Who Are the Leading Companies in the Data Center Refrigerant Market?
Chemours, Solstice Advanced Materials, Arkema, Daikin Industries and Orbia (Koura) together hold about 55% of 2025 value (DC Market Insights estimate, based on their HFO patents, OEM approvals and HFC production). Leading companies:
- Chemours
- Solstice Advanced Materials
- Arkema
- Daikin Industries
- Orbia (Koura)
- SRF Limited
- Navin Fluorine International
- Gujarat Fluorochemicals
- Dongyue Group
- Zhejiang Juhua
- AGC
- A-Gas
- Hudson Technologies
- Linde
Chemours reported record 2025 Thermal and Specialized Solutions (TSS) net sales of USD 2.1 billion, up 13% from 2024, with Opteon refrigerants growing 56% on the US AIM Act stationary air conditioning transition (Chemours, February 2026). Solstice Advanced Materials was created in 2025 through the spin-off of Honeywell’s former Advanced Materials business and sells Solstice ze (R-1234ze), Solstice zd (R-1233zd) and Solstice N15 (R-515B, GWP 293) for data center chillers (Solstice Advanced Materials). Navin Fluorine International will manufacture Chemours’ two-phase immersion fluid from 2026 (Chemours).
Recent Developments in the Data Center Refrigerant Market
- In February 2024, Regulation (EU) 2024/573 was published in the Official Journal of the European Union, setting GWP limits for chillers and air conditioning from 2027 (Source: STULZ).
- In May 2025, Chemours and Navin Fluorine International agreed to manufacture Chemours’ Opteon two-phase immersion cooling fluid, with capacity beginning in 2026 (Source: Chemours).
- In January 2026, the EPA GWP limit of 700 for chillers with exiting fluid at or above -30 °C took effect (Source: EPA).
- In February 2026, Chemours reported 56% growth in Opteon refrigerant sales for 2025 (Source: Chemours).
- In April 2026, Schneider Electric launched its first compliant 11 kW InRow cooling unit on R-32 ahead of the 1 January 2027 deadline (Source: Schneider Electric).
- In July 2026, the EPA published a draft analysis of HFC allocation data for 2022-2025 (Source: EPA).
More reports on cooling and data center infrastructure are listed in the industry directory, including the Data Center Cooling Fluids Market.
Methodology: How Did DC Market Insights Size the Data Center Refrigerant Market?
DC Market Insights built the estimate bottom-up from 16 annual capacity cohorts from 2020 to 2035, split into conventional and AI halls. New-build refrigerant equals new IT MW × 1.2 kW of cooling plant per kW × the share of heat on vapour-compression plant × charge per kW (0.16 kg for chillers, 0.55 kg for DX units, 0.40 kg for pumped two-phase loops) × the OEM bulk price. Installed-base refrigerant equals the installed bank × a 6% top-up rate at contractor price plus a 2.5% retrofit and recharge rate.
The 2025 model in numbers: 12.0 GW × 1.2 × 62.5% mechanical share gives 9.0 GW of new vapour-compression plant and about 2,000 tonnes of charge worth USD 39.87 million; the 23,239-tonne installed bank × 6% gives 1,394 tonnes of top-up worth USD 48.80 million; retrofit gas adds USD 16.27 million; total USD 104.94 million.
Three bound checks hold:
- Ceiling 1: the 2025 value of USD 104.94 million is 5.1% of Chemours’ 2025 TSS net sales of USD 2,066 million, one supplier’s refrigerant segment.
- Ceiling 2: pricing all 3,975 tonnes bought in 2025 at the highest public anchor, USD 90.78 per kg, gives USD 360.85 million, above the estimate.
- Floor: the 2,000 tonnes of new charge alone at the lowest public anchor price (R-134a, USD 25.71 per kg) × 55% OEM discount gives USD 28.28 million, below the estimate.
Every dated claim in this analysis is held in a fact ledger with its primary source. The full approach is described on the research methodology page.
Table of contents
- 01Introduction
- 1.1Market Definition and Scope
- 1.2Included and Excluded Refrigerants
- 1.3Currency, Pricing Basis and Years Considered
- 02Research Methodology
- 2.1Bottom-Up Capacity Cohort Model
- 2.2Charge per kW and Mechanical Cooling Share
- 2.3Bound Checks and Data Sources
- 2.4Assumptions and Limitations
- 03Executive Summary
- 3.1Market Size, 2020, 2025 and 2035
- 3.2Key Findings
- 3.3Analyst Viewpoint
- 04Market Dynamics
- 4.1Drivers
- 4.2Trends
- 4.3Challenges
- 4.4Opportunities
- 05Pricing Analysis
- 5.1Blended Contractor and OEM Prices per kg
- 5.2Refrigerant Content per MW of IT
- 5.3Public Price Anchors
- 06Standards and Regulation
- 6.1US AIM Act Technology Transitions
- 6.2EU F-gas Regulation (EU) 2024/573
- 6.3ASHRAE 34 Safety Classes
- 07Market Analysis by Refrigerant Type
- 7.1HFC Refrigerants (R-410A and R-134a)
- 7.2HFO and HFO Blend Refrigerants
- 7.3Low-GWP A2L Blends (R-32 and R-454B)
- 7.4Natural Refrigerants
- 08Market Analysis by Application
- 8.1Chillers
- 8.2DX Precision Air Conditioning
- 8.3Pumped Two-Phase Cooling
- 09Market Analysis by Sales Channel
- 9.1OEM Factory Charge
- 9.2Service and Top-Up
- 9.3Retrofit and Recharge
- 10Market Analysis by Data Center Type
- 10.1Hyperscale Data Centers
- 10.2Colocation Data Centers
- 10.3Enterprise Data Centers
- 10.4Edge Data Centers
- 11DC Exclusive: Refrigerant Spend Matrix
- 11.1Application by Sales Channel, 2025
- 12North America Market Analysis
- 12.1United States
- 12.2Canada
- 13Europe Market Analysis
- 13.1Germany
- 13.2United Kingdom
- 13.3France
- 13.4Netherlands
- 14Asia Pacific Market Analysis
- 14.1China
- 14.2Japan
- 14.3India
- 14.4Australia
- 14.5Singapore
- 15Latin America Market Analysis
- 15.1Brazil
- 16Middle East and Africa Market Analysis
- 16.1Gulf Cooperation Council
- 16.2South Africa
- 17Country Analysis
- 17.1Top 12 Countries by Spending
- 18Forecast Scenarios
- 18.1Low, Base and High Cases, 2035
- 19Competitive Landscape
- 19.1Market Concentration
- 19.2Company Positioning
- 20Company Profiles
- 20.1Chemours
- 20.2Solstice Advanced Materials
- 20.3Arkema
- 20.4Daikin Industries
- 20.5Orbia (Koura)
- 20.6SRF Limited
- 20.7Navin Fluorine International
- 21Recent Developments
- 21.1Regulation
- 21.2Products and Partnerships
- 22Conclusion and Analyst Recommendations
- 23Appendix
- 23.1Fact Ledger and Sources
- 23.2Abbreviations
- Fig. 1Data Center Refrigerant Market Size, 2020-2035 (USD Million)
- Table 1Report Attributes
- Table 2Price per kg and per MW, 2020-2035
- Table 3Market by Refrigerant Type
- Table 4Market by Application
- Table 5Market by Sales Channel
- Table 6Market by Data Center Type
- Table 7Refrigerant Spend Matrix, 2025
- Table 8Market by Region
- Table 9Top 12 Countries
- Table 10Forecast Scenarios, 2035
About this report
Written by Amit Jain and reviewed by Deepti Agrawal, Senior Editor, Research. Figures are built top-down and bottom-up and reconciled before publication, with 2025 as the base year.
Read our methodologyHow we built this
- Historical period2020-2024
- Base year2025
- Forecast period2026-2035
- Sizing approachTop-down + bottom-up
Need more than the report?
Advisory on this market
Due diligence, site selection and market entry work, by the analysts who wrote this report.
See consulting servicesFrequently asked questions
USD 104.94 million in 2025, rising to USD 254.42 million by 2035. DC Market Insights estimates the market at USD 46.34 million in 2020, with about 3,975 tonnes of refrigerant bought for data center cooling in 2025.
9.26% a year from 2025 to 2035, slower than the 17.76% a year of 2020 to 2025, when HFC phase-down rules lifted the blended contractor price from about USD 22 to USD 35 per kg.
HFC refrigerants such as R-410A and R-134a, with USD 65.06 million or 62.0% of 2025 value. Natural refrigerants grow fastest at 25.50% a year and HFO blends reach USD 122.12 million by 2035.
About USD 35.00 per kg at contractor prices and USD 19.25 per kg for OEM bulk buyers in 2025, according to DC Market Insights estimates. Public anchors range from USD 25.71 per kg for R-134a to USD 48.49 per kg for R-454B.
North America, with USD 42.50 million or 40.5% of 2025 value. The Middle East and Africa grows fastest at 12.46% a year, and India is the fastest-growing large country at 18.24% a year.
Chemours, Solstice Advanced Materials, Arkema, Daikin Industries and Orbia (Koura) hold about 55% of 2025 value together (DC Market Insights estimate). Chemours reported 2025 TSS net sales of USD 2.1 billion with Opteon refrigerants up 56%.
700, for data center, computer room air conditioning and IT equipment cooling systems installed from 1 January 2027 under the EPA Technology Transitions rule; chillers have faced the same limit since 1 January 2026.
About 0.16 kg per kW of cooling for a large air-cooled R-1234ze chiller, or 140 kg for a 966 kW unit. DX precision units hold about 0.55 kg per kW in split-system pipework (DC Market Insights estimate).
Licences, delivery and payment
Which licence should I choose?
Single User is a view-only PDF for one person. Multi User adds a printable PDF and the Excel data for unlimited users at one location. Enterprise covers your whole company and includes 100 free analyst hours.
How and when will I receive the report?
By email, within 24–48 business hours of payment, in the formats of your licence.
How can I pay?
Securely through PayPal: with a PayPal account, a debit or credit card, or PayPal Pay Later where available. Prices are in US dollars.
Can I see a sample first?
Yes. Request a free sample and we will email it to you.
Can the report be tailored to my needs?
Yes. We can add countries, segments or data cuts. Talk to an analyst about the scope you need.
Can I get an invoice or pay against a purchase order?
Write to sales@dcmarketinsights.com and our team will help.