
Data Center Precision Air Conditioning Market Size, Share & Forecast to 2035
Market at a glance
The Data Center Precision Air Conditioning market was worth USD 4,880.0 million in 2025 and is forecast to reach USD 10.00 billion by 2035, growing at a 7.43% CAGR. North America accounts for 40.5% of the market.
 By Amit Jain, Senior Consultant, ICT & Emerging Technologies
 Reviewed by Deepti Agrawal
Last updated 11 Oct 2026
Base year 2025 PDF + Excel
Reviewed by Deepti Agrawal
Last updated 11 Oct 2026
Base year 2025 PDF + Excel
Source: DC Market Insights analysis
Key findings
New Capacity of 12.0 GW a Year Adds USD 2.75 Billion of New-Build Spend
Fan Walls Grow to USD 2.73 Billion by 2035
Air Content per AI MW Falls 26% by 2035
Service and Maintenance Grows to USD 2.35 Billion by 2035
What is inside the report
- 01Introduction
- 02Research Methodology
- 03Executive Summary
- 04Scope Comparison: Why Market Estimates Differ
- 05Market Dynamics
- 06Pricing Analysis
- 07Standards and Regulation
- 08Supply Chain and Value Chain Analysis
- 09Market Size and Forecast, 2020-2035
- 10Market by Product Type
- 23chapters
- 2020-2024Historical period
- 2026-2035Forecast period
- 15Companies profiled
Regional insights
- North America40.5%
- Asia Pacific27.5%
- Europe23.5%
- Middle East and Africa4.3%
- Latin America4.2%
Segmentation
Companies profiled
- Vertiv
- Schneider Electric
- STULZ
- Carrier
- Trane Technologies
- Johnson Controls
- Daikin Applied
- Modine (Airedale)
- Munters
- Shenzhen Envicool
- Mitsubishi Electric
- Nortek Air Solutions
- Data Aire
- Petra Engineering
- Canovate
Recent developments
Schneider Electric completed the acquisition of a controlling interest in Motivair, maker of ChilledDoor rear-door heat exchangers (Source: Schneider Electric press release).
Vertiv announced the global launch of a chilled-water rear-door heat exchanger for AI and HPC applications (Source: Vertiv press release).
Modine announced a new USD 100 million investment to expand capacity for its North American data centers business, including Airedale cooling products (Source: Modine press release).
Daikin Applied signed an agreement to acquire DDC Solutions of San Diego (Source: Daikin Applied press release).
Carrier launched the AiroVision 39CV computer room air handler for medium to large data centers (Source: Carrier press release).
Munters won an order worth about SEK 2.0 billion from a US colocation provider for a modular AI cooling solution (Source: Munters press release).
Full analysis
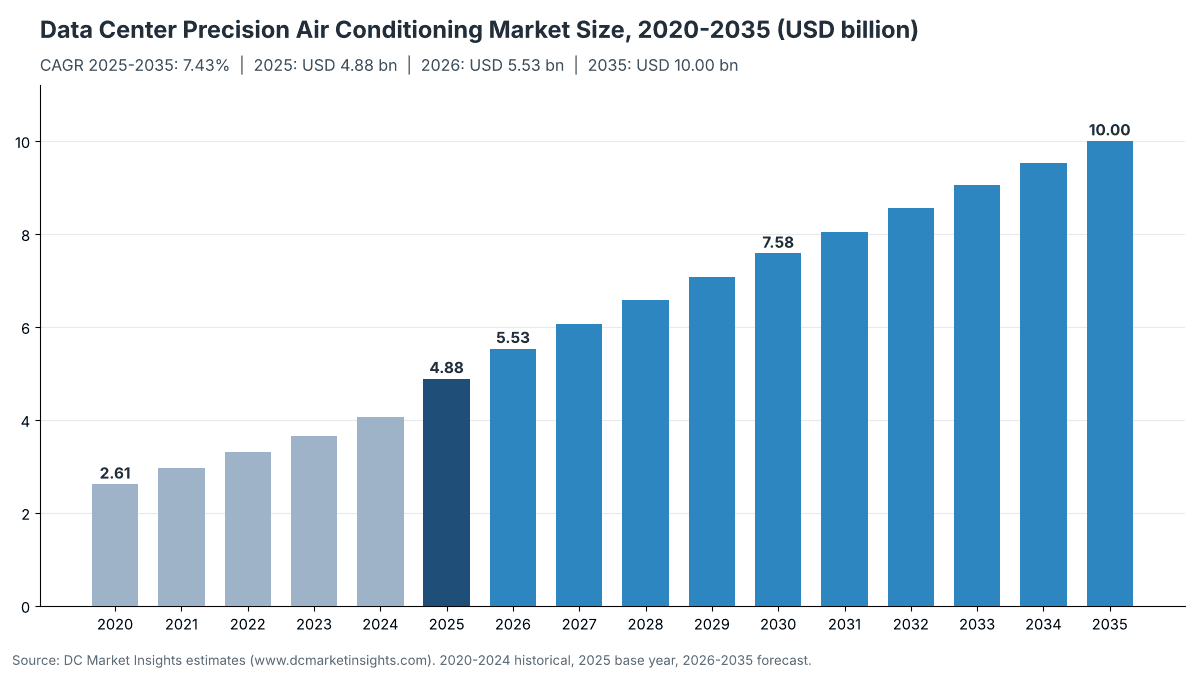
The Data Center Precision Air Conditioning Market is valued at USD 5.53 billion in 2026 and is projected to reach USD 10.00 billion by 2035, up from USD 4.88 billion in 2025, a CAGR of 7.43% from 2025 to 2035 (DC Market Insights estimate). The market covers the computer room air conditioners (CRAC), computer room air handlers (CRAH), in-row and rack-based coolers, fan walls and rear-door heat exchangers that hold the air entering information technology (IT) equipment inside a set temperature and humidity band in a data center. The build receipt: about 7.8 GW of new conventional IT capacity at roughly USD 290,000 of precision air content per MW and 4.2 GW of new artificial intelligence (AI) capacity at about USD 115,000 per MW give USD 2.75 billion of new-build spend in 2025, and replacement of ageing units plus service contracts on an installed base of about 116 GW add USD 2.14 billion. Rear-door heat exchangers are the fastest-growing product at 13.12% a year because liquid-cooled AI racks still shed 25% to 30% of their heat to air, and the Middle East and Africa is the fastest-growing region at 11.61% a year as sovereign AI campuses in Saudi Arabia and the United Arab Emirates start from a small base.
Key Market Statistics: How Big Is the Data Center Precision Air Conditioning Market in 2026?
DC Market Insights values the Data Center Precision Air Conditioning Market at USD 5.53 billion in 2026, 13.2% above the USD 4.88 billion of 2025.
- Market size 2025: USD 4.88 billion (USD 4,884.87 million)
- Market size 2026: USD 5.53 billion (USD 5,531.51 million)
- Market size 2030: USD 7.58 billion (USD 7,580.97 million)
- Market size 2035: USD 10.00 billion (USD 9,999.92 million)
- CAGR 2025-2035: 7.43% in the base case, 5.22% in the low case and 9.46% in the high case
- Largest product: perimeter CRAC and CRAH units, 54.2% of 2025 value (USD 2.65 billion)
- Fastest-growing product: rear-door heat exchangers, 13.12% a year
- Leading region: North America, 40.5% of 2025 value (USD 1.98 billion)
- Fastest-growing region: Middle East and Africa, 11.61% a year
- Largest country: the United States, USD 1.74 billion in 2025 (35.6% of global value)
- Market leader: Vertiv, followed by Schneider Electric and STULZ (DC Market Insights assessment)
Executive Summary
The Global Data Center Precision Air Conditioning Market size was valued at USD 2.61 billion in 2020, reached USD 4.88 billion in 2025, and is anticipated to reach USD 10.00 billion by 2035, at a CAGR of 7.43% during the forecast period.
| Report attribute | Details |
|---|---|
| Historical Period | 2020-2024 |
| Base Year | 2025 |
| Forecast Period | 2026-2035 |
| Data Center Precision Air Conditioning Market Size 2025 | USD 4.88 Billion |
| Data Center Precision Air Conditioning Market Size 2026 | USD 5.53 Billion |
| Data Center Precision Air Conditioning Market, CAGR | 7.43% |
| Data Center Precision Air Conditioning Market Size 2035 | USD 10.00 Billion |
The market grew at 13.32% a year between 2020 and 2025, and 2025 alone added 20.6% over the USD 4.05 billion of 2024 as annual completions jumped from 8.8 GW to 12.0 GW. Growth slows to 7.43% a year from 2025 to 2035 for one reason: AI halls move most of their heat into liquid, so precision air content per new AI MW falls from about USD 115,000 in 2025 to about USD 85,000 in 2035, against USD 290,000 to USD 325,000 per MW in a conventional hall. The installed base keeps the market growing all the same. It rises from about 116 GW in 2025 to about 313 GW in 2035, and replacement and service rise from 43.8% of the market in 2025 to 55.0% in 2035.
Market Scope: What Does the Data Center Precision Air Conditioning Market Cover?
The Data Center Precision Air Conditioning Market covers every air-side unit that cools and dehumidifies the air supplied to IT equipment in a data center, valued at factory and installed equipment price plus service in current US dollars. DC Market Insights sizes it at USD 4.88 billion in 2025 and USD 5.53 billion in 2026.
Included. Perimeter CRAC units with direct expansion (DX) refrigerant circuits, chilled-water CRAH units, in-row and rack-mounted coolers, fan walls and thermal walls, rear-door heat exchangers, pumped-refrigerant and hybrid economizer units sold as close-control equipment, their unit controls, and the replacement, retrofit, maintenance and repair of those units.
The scope runs from a 3.5 kW rack cooler in an edge room to a hall of fan walls in a hyperscale campus, and from new-build orders to service contracts on the installed base.
Excluded. Chillers, cooling towers, dry coolers and other heat rejection plant, liquid cooling equipment such as coolant distribution units, cold plates and immersion tanks, comfort air conditioning for offices, and air conditioners for telecom shelters and base stations.
How the segments fit together. The sales type split adds new-build equipment, replacement and retrofit, and service and maintenance to the USD 4.88 billion total. The product, cooling medium and data center type splits re-cut the same total by unit form, by how the unit removes heat and by buyer.
Why Do Data Center Precision Air Conditioning Market Estimates Differ?
Public estimates for this market name range widely because they use different scopes; DC Market Insights counts only air-side precision units and their service, which gives USD 5.53 billion in 2026.
Broader definitions add chillers, cooling towers and dry coolers, which are the heat rejection plant behind a chilled-water CRAH rather than precision air conditioning. Some also add liquid cooling equipment such as coolant distribution units, direct-to-chip cold plates and immersion cooling tanks, comfort air conditioning in data center offices, and telecom shelter air conditioners. Each of these can double or triple a published total. Narrower definitions count only perimeter CRAC units and leave out fan walls, rear-door heat exchangers and service, which can halve it.
| Element | In this report | Why |
|---|---|---|
| Perimeter CRAC and CRAH units | Yes, USD 2,646.73 million in 2025 | Core close-control equipment |
| In-row and rack-based coolers | Yes, USD 917.12 million | Close-control units placed next to the load |
| Fan walls and thermal walls | Yes, USD 923.66 million | Air handlers that replace perimeter units in large halls |
| Rear-door heat exchangers | Yes, USD 397.36 million | Air-side units that remove residual heat from dense racks |
| Service and maintenance of these units | Yes, USD 696.00 million | Recurring spend on the same equipment |
| Chillers, cooling towers and dry coolers | No | Heat rejection plant, sized in a separate market |
| Coolant distribution units, cold plates and immersion tanks | No | Liquid cooling equipment |
| Comfort and telecom shelter air conditioning | No | Not used to cool data center IT equipment |
The buyer groups inside the scope include hyperscale cloud operators, colocation providers, enterprises and small and medium-sized enterprises (SMEs) that run their own server rooms, and edge operators. Enterprise and SME server rooms, which mostly use DX units, account for USD 1.05 billion of 2025 spending.
Market Drivers: What Drives the Data Center Precision Air Conditioning Market?
Three drivers explain most of the growth in the Data Center Precision Air Conditioning Market: a capacity build that more than doubles annual completions from 12.0 GW to 27.0 GW, the residual air load of liquid-cooled AI racks, and efficiency rules that force older units out.
New Capacity of 12.0 GW a Year Adds USD 2.75 Billion of New-Build Spend
The Data Center Precision Air Conditioning Market is still mainly a build market: 56.2% of 2025 spending went into new halls. BloombergNEF (BNEF) counted 23.1 GW of capacity under construction globally across 831 sites at the end of September 2025, and the United States alone hosts 15.9 GW of it. DC Market Insights models annual completions rising from 12.0 GW in 2025 to 22.0 GW in 2030 and 27.0 GW in 2035, which lifts new-build precision air spending from USD 2.75 billion to USD 4.50 billion. Google, Amazon, Microsoft and Meta plan USD 725 billion of capital expenditure in 2026, up 77% from USD 410 billion in 2025, according to a Tom’s Hardware tally of company guidance.
Liquid-Cooled AI Racks Still Send 25% to 30% of Their Heat to Air
Liquid cooling shrinks the air load of an AI hall but does not remove it. Vertiv states that direct-to-chip liquid cooling removes about 70% to 75% of the heat generated in the rack, leaving 25% to 30% for air-cooling systems. NVIDIA describes its GB200 and GB300 NVL72 systems as rack-scale and liquid-cooled and cites a full-rack power density of 120 kW, so 30% residual heat on such a rack is about 36 kW of air cooling, more than a whole conventional rack. DC Market Insights uses an air share of 30% in 2025 falling to 22% in 2035, which still gives USD 1.51 billion of AI-hall precision air spending in 2035, more than three times the USD 483.00 million of 2025.
Efficiency and Refrigerant Rules Retire Older Units
Replacement and retrofit is worth USD 1.44 billion in 2025, 29.6% of the market, and rules on efficiency and refrigerants keep it growing at 8.12% a year. Germany’s Energy Efficiency Act (EnEfG) requires data centers that start operating from 1 July 2026 to reach a power usage effectiveness (PUE) of 1.2 or better, and existing sites 1.5 from July 2027 and 1.3 from July 2030. In the United States, the Environmental Protection Agency (EPA) sets a global warming potential (GWP) limit of 700 for data center, computer room air conditioning and IT equipment cooling systems from 1 January 2027, which rules out R-410A in new DX units. Both rules favour units with electronically commutated fans, variable-speed compressors and economizer modes over units installed a decade ago.
Market Trends: How Is Data Center Precision Air Conditioning Changing?
Three trends are reshaping the product mix of the Data Center Precision Air Conditioning Market: fan walls take share in large halls, rear-door heat exchangers move into the mainstream, and suppliers are buying liquid cooling to sell air and liquid as one package.
Fan Walls Grow to USD 2.73 Billion by 2035
Fan walls and thermal walls are worth USD 923.66 million in 2025 and USD 2.73 billion in 2035, a CAGR of 11.47%, which lifts their share from 18.9% to 27.3%. Hyperscale and AI halls favour a wall of large chilled-water coils and fans along the hall edge over many perimeter cabinets because it frees white space and runs at the warmer supply temperatures that the American Society of Heating, Refrigerating and Air-Conditioning Engineers (ASHRAE) allows. Carrier launched the AiroVision 39CV CRAH for medium to large data centers in January 2026 under its QuantumLeap portfolio, a sign that chiller makers want the air side of the order as well.
Rear-Door Heat Exchangers Reach 13.6% of Value by 2035
Rear-door heat exchangers grow from USD 397.36 million in 2025 to USD 1.36 billion in 2035, the fastest product CAGR at 13.12%. A rear door removes heat at the rack exhaust, so it suits AI racks whose residual air load is too dense for room-level units. Vertiv announced the global launch of a chilled-water rear-door heat exchanger for AI and high-performance computing (HPC) in March 2025, and Schneider Electric owns ChilledDoor maker Motivair.
Air and Liquid Are Sold Together
The leading suppliers spent 2025 and 2026 buying liquid cooling so that one vendor can supply both the precision air units and the liquid loop of an AI hall. Schneider Electric completed its acquisition of a controlling interest in Motivair in February 2025, Daikin Applied acquired Chilldyne in November 2025, and Eaton completed its acquisition of Boyd Thermal in March 2026. DC Market Insights expects bundled orders to keep pricing for the air side firm, with blended content per conventional MW rising from USD 290,000 in 2025 to USD 325,000 in 2035.
Market Challenges: What Holds the Data Center Precision Air Conditioning Market Back?
Two challenges cap growth at 7.43% a year: liquid cooling takes a growing share of the heat in new AI halls, and enterprise server rooms keep shrinking as workloads move to cloud and colocation.
Air Content per AI MW Falls 26% by 2035
Precision air content per new AI MW falls from about USD 115,000 in 2025 to about USD 85,000 in 2035, a drop of 26%, as more heat moves to cold plates. AI halls take 66% of new capacity by 2035, up from 35% in 2025, so the shift pulls new-build growth down to 5.06% a year, well below the 8.45% a year growth in completions. The Uptime Institute’s 2025 survey found greater adoption of racks in the 10 kW to 30 kW range and few sites above 30 kW, so the move to liquid is gradual outside AI campuses.
Enterprise Spending Grows Only 2.73% a Year
Enterprise data centers spend USD 1.05 billion on precision air conditioning in 2025 but only USD 1.38 billion in 2035, a CAGR of 2.73%, and their share falls from 21.6% to 13.8%. Enterprise rooms rely on DX units, so DX grows only 1.26% a year, from USD 1.07 billion to USD 1.22 billion. Each refrigerant change, such as the US move to GWP below 700 from January 2027, also forces suppliers to redesign DX ranges for a shrinking customer base.
Market Opportunities: Where Are the New Revenue Pools?
The two largest new revenue pools are service on a fast-growing installed base, worth USD 2.35 billion by 2035, and air-side equipment for AI halls, worth USD 1.51 billion of new-build spend by 2035.
Service and Maintenance Grows to USD 2.35 Billion by 2035
Service and maintenance is the fastest-growing sales type at 12.94% a year, from USD 696.00 million in 2025 to USD 2.35 billion in 2035, because the installed base nearly triples from about 116 GW to about 313 GW and service per installed MW rises from USD 6,000 to USD 7,500 a year. Vertiv completed its acquisition of PurgeRite, a provider of mechanical flushing, purging and filtration services for data centers, in December 2025, adding fluid service capacity that applies to chilled-water CRAH loops as well as liquid cooling.
AI Halls Add USD 1.51 Billion of Air-Side Spending by 2035
New AI halls buy USD 483.00 million of precision air equipment in 2025 and USD 1.51 billion in 2035, as AI capacity under construction moves from 4.2 GW a year to 17.8 GW a year. Most of it goes to fan walls and rear-door heat exchangers, which together take 65% of AI-hall air spending in 2025 and 74% in 2035. Munters won an order worth about SEK 2.0 billion (Swedish kronor) from a US colocation provider for a modular AI cooling solution in April 2026, the size of order that AI campuses now place.
Pricing: How Much Does Precision Air Conditioning Cost per MW?
A conventional data center hall carries about USD 290,000 of precision air conditioning content per MW of IT load in 2025, and an AI hall about USD 115,000 per MW. These are DC Market Insights estimates covering CRAC, CRAH, in-row, fan wall and rear-door units with controls at factory and installed price, before chillers and heat rejection.
| Precision air content (USD thousand) | 2020 | 2025 | 2030 | 2035 |
|---|---|---|---|---|
| Conventional hall, per MW of new IT load | 260.0 | 290.0 | 310.0 | 325.0 |
| AI hall, per MW of new IT load | 130.0 | 115.0 | 95.0 | 85.0 |
| Service, per installed MW per year | 5.0 | 6.0 | 6.75 | 7.5 |
| AI share of new capacity | 3% | 35% | 60% | 66% |
Public prices anchor the model. An APC InRow DX ACRD301S 30 kW air-cooled in-row unit is on sale at USD 17,582.99 (regular USD 25,690) at a US reseller, or about USD 586 per kW. The chilled-water APC InRow RC ACRC301S is listed at USD 20,050.06 against a manufacturer’s suggested retail price (MSRP) of USD 20,730 on a government reseller site. A Vertiv VRC self-contained 3.5 kW rack cooler for edge rooms is on sale at USD 5,093.99. In July 2024, Sedgwick County, Kansas, approved USD 283,417.49 for three Vertiv CRAC units with their outdoor units for its 911 center data center. Volume buyers pay far less per kW than these single-unit prices: DC Market Insights uses about USD 190 per kW of unit capacity for perimeter CRAH units, USD 170 for fan walls, USD 450 for in-row units and USD 250 for rear doors, a blended USD 242 per kW, and 1.2 kW of installed unit capacity per kW of IT load for redundancy, which gives USD 290,000 per MW.
Standards and Regulation: Which Rules Shape Data Center Precision Air Conditioning?
Five sets of rules decide how precision air units are specified: ASHRAE thermal and energy standards, the European EN 50600 series, EU and German energy efficiency law, refrigerant rules, and national PUE targets in Asia.
ASHRAE TC 9.9 Thermal Guidelines. The recommended inlet range of 18 °C to 27 °C (65 °F to 80 °F) sets the supply air temperature that units must hold; Lawrence Berkeley National Laboratory guidance tells operators to select it as the default.
ANSI/ASHRAE Standard 90.4-2025. The American National Standards Institute (ANSI) and ASHRAE Energy Standard for Data Centers set the mechanical load component limits that cooling designs must meet in US building codes.
EN 50600-2-3. The European data center standard addresses environmental control within data centres, including temperature and humidity control and its availability classes.
EU Delegated Regulation 2024/1364. The first phase of the EU data center rating scheme requires operators of data centres with installed IT power demand of at least 500 kW to report key indicators including PUE, which puts cooling energy on the public record.
Germany EnEfG. PUE of 1.2 or better for data centers starting operation from 1 July 2026, 1.5 for existing sites from July 2027 and 1.3 from July 2030.
Refrigerant rules. The US EPA GWP limit of 700 for data center and CRAC cooling applies from 1 January 2027. The EU F-gas Regulation 2024/573, published on 20 February 2024, phases down high-GWP gases in split and chiller systems from 2027.
China and Singapore. China’s 2024 data center green and low-carbon action plan requires new and expanded large and hyperscale data centers to reach a PUE within 1.25 by the end of 2025, and 1.2 at national hub nodes. Singapore’s Infocomm Media Development Authority (IMDA) notes that data centers can save 2% to 5% of energy for every 1 °C increase in operating temperature.
Market Segmentation: Which Segment Leads the Data Center Precision Air Conditioning Market?
Perimeter CRAC and CRAH units lead the Data Center Precision Air Conditioning Market with 54.2% of 2025 value, chilled-water units lead by cooling medium with 69.9%, and colocation data centers lead buyers with 38.5%. The fastest-growing segment is rear-door heat exchangers at 13.12% a year, ahead of service and maintenance at 12.94%, because AI racks need cooling at the rack exhaust and the installed base grows faster than new builds.
By Product Type: Perimeter CRAC and CRAH Units Lead with 54.2%
| Product type | 2025 (USD million) | Share 2025 | 2035 (USD million) | CAGR 2025-2035 |
|---|---|---|---|---|
| Perimeter CRAC and CRAH Units | 2,646.73 | 54.2% | 4,239.02 | 4.82% |
| In-Row and Rack-Based Coolers | 917.12 | 18.8% | 1,663.43 | 6.13% |
| Fan Walls and Thermal Walls | 923.66 | 18.9% | 2,734.71 | 11.47% |
| Rear-Door Heat Exchangers | 397.36 | 8.1% | 1,362.76 | 13.12% |
Perimeter units lose 11.8 points of share by 2035, to 42.4%, while fan walls gain 8.4 points and rear doors 5.5 points, because new hyperscale and AI halls buy fewer, larger air handlers.
By Cooling Medium: Chilled Water Leads with 69.9%
| Cooling medium | 2025 (USD million) | Share 2025 | 2035 (USD million) | CAGR 2025-2035 |
|---|---|---|---|---|
| Chilled Water | 3,413.47 | 69.9% | 7,806.89 | 8.62% |
| Direct Expansion (DX) | 1,074.39 | 22.0% | 1,218.06 | 1.26% |
| Pumped Refrigerant and Hybrid Economizer | 397.01 | 8.1% | 974.97 | 9.40% |
Chilled water reaches 78.1% of value by 2035 because every fan wall and rear door runs on water, while pumped-refrigerant economizers grow 9.40% a year in perimeter units that must meet tighter PUE limits without a chiller plant.
By Data Center Type: Colocation Data Centers Lead with 38.5%
| Data center type | 2025 (USD million) | Share 2025 | 2035 (USD million) | CAGR 2025-2035 |
|---|---|---|---|---|
| Colocation Data Centers | 1,878.41 | 38.5% | 3,971.25 | 7.77% |
| Hyperscale Data Centers | 1,636.11 | 33.5% | 3,889.76 | 9.05% |
| Enterprise Data Centers | 1,054.86 | 21.6% | 1,380.31 | 2.73% |
| Edge Data Centers | 315.49 | 6.5% | 758.60 | 9.17% |
Edge data centers grow fastest among buyers at 9.17% a year from a small base, and hyperscale operators close most of the gap with colocation by 2035 as AI campuses come online.
By Sales Type: New-Build Equipment Leads with 56.2%
| Sales type | 2025 (USD million) | Share 2025 | 2035 (USD million) | CAGR 2025-2035 |
|---|---|---|---|---|
| New-Build Equipment | 2,745.00 | 56.2% | 4,498.20 | 5.06% |
| Replacement and Retrofit | 1,443.87 | 29.6% | 3,151.86 | 8.12% |
| Service and Maintenance | 696.00 | 14.2% | 2,349.86 | 12.94% |
New-build equipment falls below half of the market by 2035, at 45.0%, as replacement and service on the installed base reach a combined USD 5.50 billion.
DC Exclusive: The Precision Air Content per MW Model and Product × Data Center Type Matrix
At USD 1.02 billion in 2025, perimeter CRAC and CRAH units in colocation data centers are the single largest cell of the matrix and 21.0% of all precision air conditioning spending. The matrix below cross-tabulates what is bought against who buys it. It is a DC Market Insights model, not a shipment count: it is built from 41 inputs, namely 32 capacity cohorts (16 years of conventional and AI halls), 3 price curves, 2 lifecycle rates and 4 mix tables, and then tested against 3 bound checks.
| 2025, USD million | Colocation | Hyperscale | Enterprise | Edge |
|---|---|---|---|---|
| Perimeter CRAC and CRAH Units | 1,023.50 | 830.39 | 614.18 | 178.66 |
| In-Row and Rack-Based Coolers | 355.72 | 292.62 | 207.23 | 61.55 |
| Fan Walls and Thermal Walls | 354.11 | 343.88 | 170.27 | 55.40 |
| Rear-Door Heat Exchangers | 145.08 | 169.22 | 63.18 | 19.88 |
| Total | 1,878.41 | 1,636.11 | 1,054.86 | 315.49 |
Hyperscale operators spend 10.3% of their precision air budget on rear-door heat exchangers and 21.0% on fan walls, the highest shares of any buyer, because their AI halls cool residual heat at the rack and hall edge. Enterprise data centers spend 58.2% of theirs on perimeter units, the highest share of any buyer, because most enterprise rooms still run raised-floor DX cooling.
The content per MW model has two inputs any reader can check: new capacity delivered each year (12.0 GW in 2025) and the share built for AI (35% in 2025). Multiplying each by its content per MW gives new-build spend; adding replacement at 4.5% of installed content a year and service per installed MW gives the market. The model and its assumptions are explained on our research methodology page.
Regional Insights: Which Region Leads the Data Center Precision Air Conditioning Market?
North America leads the Data Center Precision Air Conditioning Market with 40.5% of 2025 value, and the Middle East and Africa is the fastest-growing region at 11.61% a year, because sovereign AI campuses in Saudi Arabia and the United Arab Emirates add large sites to a small base.
North America Leads with 40.5% Share
North American operators spent USD 1.98 billion on data center precision air conditioning in 2025, and the region is forecast to reach USD 3.80 billion in 2035, a CAGR of 6.74%. The United States hosted 15.9 GW of the 23.1 GW under construction worldwide in late 2025, according to BloombergNEF, and STULZ opened a new manufacturing facility in Texas in March 2026 to serve that demand.
Asia Pacific Holds 27.5% Share
Asia Pacific is worth USD 1.34 billion in 2025 and USD 3.00 billion by 2035, a CAGR of 8.37%. India’s data center capacity reached almost 1.5 GW in 2025, up from 375 MW in 2020, according to its IT Ministry, and China’s PUE limit of 1.25 for new large sites pushes buyers toward economizer and fan wall designs.
Europe Holds 23.5% Share
Europe is worth USD 1.15 billion in 2025 and USD 2.05 billion by 2035, a CAGR of 5.97%. CBRE reported net absorption of 218 MW in Frankfurt and 208 MW in London in June 2026, and Germany’s PUE limit of 1.2 for new sites from July 2026 is the strictest in the region.
Middle East and Africa Holds 4.3% Share
The Middle East and Africa is worth USD 210.05 million in 2025 and USD 629.99 million by 2035, the fastest regional CAGR at 11.61%. HUMAIN broke ground on two data centers in Riyadh and Dammam with an initial 100 MW each in August 2025, and Stargate UAE is planned as a 1 GW cluster with a first 200 MW data center in 2026; desert heat makes precision air content per MW higher than in Europe.
Latin America Holds 4.2% Share
Latin America is worth USD 205.16 million in 2025 and USD 520.00 million by 2035, a CAGR of 9.75%. Brazil had 706 MW of data center inventory by August 2026 and 660 MW under construction, and Querétaro held 186 MW of operational capacity in May 2025, 79% of Mexico’s total.
Country Analysis: Which Countries Spend the Most on Data Center Precision Air Conditioning?
The United States is the largest country market for data center precision air conditioning at USD 1.74 billion in 2025, 35.6% of global value, followed by China at USD 510.47 million (10.5%) and Germany at USD 241.07 million (4.9%). The 12 largest countries account for 78.9% of 2025 spending.
| Rank | Country | Region | 2025 (USD million) | Share 2025 | 2035 (USD million) | CAGR 2025-2035 |
|---|---|---|---|---|---|---|
| 1 | United States | North America | 1,740.97 | 35.6% | 3,305.97 | 6.62% |
| 2 | China | Asia Pacific | 510.47 | 10.5% | 1,049.99 | 7.48% |
| 3 | Germany | Europe | 241.07 | 4.9% | 430.50 | 5.97% |
| 4 | Canada | North America | 237.41 | 4.9% | 494.00 | 7.60% |
| 5 | United Kingdom | Europe | 229.59 | 4.7% | 389.50 | 5.43% |
| 6 | Japan | Asia Pacific | 201.50 | 4.1% | 390.00 | 6.83% |
| 7 | France | Europe | 137.75 | 2.8% | 246.00 | 5.97% |
| 8 | Australia | Asia Pacific | 134.33 | 2.7% | 300.00 | 8.37% |
| 9 | India | Asia Pacific | 120.90 | 2.5% | 420.00 | 13.26% |
| 10 | Netherlands | Europe | 114.79 | 2.3% | 184.50 | 4.86% |
| 11 | Singapore | Asia Pacific | 94.03 | 1.9% | 180.00 | 6.71% |
| 12 | Brazil | Latin America | 92.32 | 1.9% | 234.00 | 9.75% |
India is the fastest-growing large country market at 13.26% a year, ahead of Brazil at 9.75% and Australia at 8.37%, as hyperscale and colocation operators add capacity in tropical climates that need cooling all year. The country figures are a DC Market Insights allocation of the regional totals, weighted by each country’s estimated share of installed and new data center capacity, and the North American rows sum to the regional total.
Forecast Scenarios: How Could the 2035 Forecast Change?
The Data Center Precision Air Conditioning Market reaches USD 10.00 billion by 2035 in the base case, with a range of USD 8.13 billion to USD 12.06 billion across the low and high scenarios.
| Scenario | Assumption from 2026 | 2035 (USD billion) | CAGR 2025-2035 |
|---|---|---|---|
| Low | Capacity additions 15% below base; content and service rates 8% lower | 8.13 | 5.22% |
| Base | Additions rise to 27.0 GW a year; AI share of new capacity reaches 66% | 10.00 | 7.43% |
| High | Additions 15% above base; content and service rates 8% higher | 12.06 | 9.46% |
The low case reflects a pause in AI capital spending and a faster move of residual heat to liquid. The high case assumes that hotter climates and tighter PUE rules lift air-side content per MW and that operators replace pre-2015 units sooner.
Competitive Insights: Who Leads the Data Center Precision Air Conditioning Market?
- Vertiv
- Schneider Electric
- STULZ
- Carrier
- Trane Technologies
- Johnson Controls
- Daikin Applied
- Modine (Airedale)
- Munters
- Shenzhen Envicool
- Mitsubishi Electric
- Nortek Air Solutions
- Data Aire
- Petra Engineering
- Canovate
The Data Center Precision Air Conditioning Market is moderately concentrated: DC Market Insights estimates that Vertiv, Schneider Electric and STULZ together hold about 40% of the market. The estimate sets the full room, row and rack ranges of these three suppliers and their installed base of service contracts against the USD 4.88 billion market. Vertiv reported 2025 net sales of USD 10.23 billion, up from USD 8.01 billion in 2024, across power, thermal and services. Schneider Electric’s 2025 revenues grew 9% organically and passed EUR 40 billion, with triple-digit growth in pure data center demand in the fourth quarter. STULZ employs about 8,200 people in 35 subsidiaries with 10 production sites. Shenzhen Envicool reported 2025 revenue of RMB 6.07 billion (Chinese yuan), up 32.23%. Modine’s data center sales rose 158% year on year in the fourth quarter of its fiscal year to March 2026, and Carrier’s fourth-quarter 2025 orders rose nearly 50%, driven by key data center wins. Johnson Controls linked its second-quarter fiscal 2026 results to strength in data centers.
Recent Developments
- In February 2025, Schneider Electric completed the acquisition of a controlling interest in Motivair, maker of ChilledDoor rear-door heat exchangers (Source: Schneider Electric press release).
- In March 2025, Vertiv announced the global launch of a chilled-water rear-door heat exchanger for AI and HPC applications (Source: Vertiv press release).
- In July 2025, Modine announced a new USD 100 million investment to expand capacity for its North American data centers business, including Airedale cooling products (Source: Modine press release).
- In August 2025, Daikin Applied signed an agreement to acquire DDC Solutions of San Diego (Source: Daikin Applied press release).
- In January 2026, Carrier launched the AiroVision 39CV computer room air handler for medium to large data centers (Source: Carrier press release).
- In April 2026, Munters won an order worth about SEK 2.0 billion from a US colocation provider for a modular AI cooling solution (Source: Munters press release).
We follow these deals, launches and deployments as they happen in our data center industry updates. Buyers planning a cooling program can compare unit spending with refrigerant demand in the Data Center Refrigerant Market report and with regional demand in the Asia Pacific Data Center Cooling Market report.
Methodology: How We Built the Data Center Precision Air Conditioning Market Model
DC Market Insights built this market bottom-up from 16 annual capacity cohorts (2020 to 2035), each split into conventional and AI halls. New-build spend multiplies each cohort by its precision air content per MW: USD 290,000 in a conventional hall in 2025, from about USD 242 per kW of unit capacity and 1.2 kW of units per kW of IT load, and USD 115,000 in an AI hall, where 30% of the heat goes to air. Installed-base spend adds replacement and retrofit at 4.5% of installed content a year and service at USD 6,000 per installed MW a year in 2025. The installed base of about 116 GW in 2025 retires at 1.05% a year. The total was split by 4 product types, 3 cooling media, 4 data center types, 3 sales types and 5 regions, and every split sums to the market total.
Because no supplier discloses data center precision air conditioning sales, the result was tested against three bounds. Ceiling one: at an average all-in development cost of USD 17.6 million per MW reported by Cushman & Wakefield, 12.0 GW of new capacity represents about USD 211.20 billion of construction, and modeled new-build precision air spending of USD 2.75 billion is 1.3% of that. Ceiling two: the whole market is 1.0% of the USD 0.5 trillion of 2024 data center investment reported by the International Energy Agency (IEA), and less than half of Vertiv’s USD 10.23 billion of 2025 net sales. Floor: Shenzhen Envicool alone reported RMB 6.07 billion of 2025 revenue across all of its businesses, under USD 1 billion, well below the modeled USD 4.88 billion market served by more than a dozen suppliers. The analyst named on this page built the model, and the reviewer checked the arithmetic, the sources and the dates before publication.
Table of contents
- 01Introduction
- 1.1Market Definition and Scope
- 1.2Included and Excluded Equipment
- 1.3Currency, Pricing Basis and Years Considered
- 02Research Methodology
- 2.1Bottom-Up Precision Air Content per MW Model
- 2.2Capacity Cohorts: Conventional and AI Halls
- 2.3Bound Checks and Data Sources
- 2.4Assumptions and Limitations
- 03Executive Summary
- 3.1Market Snapshot, 2025, 2026 and 2035
- 3.2Key Market Statistics
- 3.3Analyst Viewpoint
- 04Scope Comparison: Why Market Estimates Differ
- 4.1Air-Side Units versus Chillers and Heat Rejection
- 4.2Precision Air versus Liquid Cooling
- 05Market Dynamics
- 5.1Drivers
- 5.2Trends
- 5.3Challenges
- 5.4Opportunities
- 06Pricing Analysis
- 6.1Precision Air Content per MW, Conventional and AI Halls
- 6.2In-Row, CRAC, CRAH and Rack Cooler Price Points
- 6.3Service Pricing per Installed MW
- 07Standards and Regulation
- 7.1ASHRAE TC 9.9 Thermal Guidelines and Standard 90.4
- 7.2EN 50600-2-3
- 7.3EU Energy Efficiency Directive and Delegated Regulation 2024/1364
- 7.4Germany Energy Efficiency Act (EnEfG)
- 7.5Refrigerant Rules: US EPA Technology Transitions and EU F-gas Regulation
- 7.6China and Singapore Efficiency Targets
- 08Supply Chain and Value Chain Analysis
- 8.1Compressor, Fan and Coil Suppliers
- 8.2Precision Cooling Manufacturers
- 8.3Mechanical Contractors and Service Providers
- 09Market Size and Forecast, 2020-2035
- 9.1Historical Market Size, 2020-2024
- 9.2Forecast, 2026-2035
- 9.3New-Build and Installed-Base Spend
- 10Market by Product Type
- 10.1Perimeter CRAC and CRAH Units
- 10.2In-Row and Rack-Based Coolers
- 10.3Fan Walls and Thermal Walls
- 10.4Rear-Door Heat Exchangers
- 11Market by Cooling Medium
- 11.1Chilled Water
- 11.2Direct Expansion (DX)
- 11.3Pumped Refrigerant and Hybrid Economizer
- 12Market by Data Center Type
- 12.1Colocation Data Centers
- 12.2Hyperscale Data Centers
- 12.3Enterprise Data Centers
- 12.4Edge Data Centers
- 13Market by Sales Type
- 13.1New-Build Equipment
- 13.2Replacement and Retrofit
- 13.3Service and Maintenance
- 14DC Exclusive: Product × Data Center Type Matrix
- 14.1Results by Cell, 2025
- 14.2Model Inputs and Bound Checks
- 15North America Market
- 15.1United States
- 15.2Canada
- 16Europe Market
- 16.1Germany
- 16.2United Kingdom
- 16.3France
- 16.4Netherlands
- 16.5Rest of Europe
- 17Asia Pacific Market
- 17.1China
- 17.2Japan
- 17.3Australia
- 17.4India
- 17.5Singapore
- 17.6Rest of Asia Pacific
- 18Latin America Market
- 18.1Brazil
- 18.2Mexico
- 18.3Rest of Latin America
- 19Middle East and Africa Market
- 19.1Saudi Arabia
- 19.2United Arab Emirates
- 19.3Rest of Middle East and Africa
- 20Country Analysis: Top 12 Countries
- 20.1Country Ranking, 2025
- 20.2Fastest-Growing Large Countries
- 21Forecast Scenarios
- 21.1Low, Base and High Cases, 2035
- 21.2Scenario Assumptions
- 22Competitive Landscape
- 22.1Market Concentration
- 22.2Company Profiles: Vertiv, Schneider Electric, STULZ, Carrier, Trane Technologies, Johnson Controls, Daikin Applied, Modine, Munters, Shenzhen Envicool
- 22.3Recent Developments
- 23Analyst Recommendations
- 23.1For Data Center Operators
- 23.2For Cooling Suppliers
- 23.3For Investors
- Fig. 1Data Center Precision Air Conditioning Market Size, 2020-2035
- Fig. 2Market Share by Product Type, 2025 and 2035
- Fig. 3Market Share by Region, 2025
- Fig. 4Precision Air Content per MW, 2020-2035
- Fig. 5Forecast Scenarios, 2035
- Table 1Report Attributes
- Table 2Scope Comparison
- Table 3Precision Air Content per MW, 2020-2035
- Table 4Market by Product Type, 2025 and 2035
- Table 5Market by Cooling Medium, 2025 and 2035
- Table 6Market by Data Center Type, 2025 and 2035
- Table 7Market by Sales Type, 2025 and 2035
- Table 8Product × Data Center Type Matrix, 2025
- Table 9Top 12 Countries, 2025 and 2035
- Table 10Forecast Scenarios, 2035
About this report
Written by Amit Jain and reviewed by Deepti Agrawal, Senior Editor, Research. Figures are built top-down and bottom-up and reconciled before publication, with 2025 as the base year.
Read our methodologyHow we built this
- Historical period2020-2024
- Base year2025
- Forecast period2026-2035
- Sizing approachTop-down + bottom-up
Need more than the report?
Advisory on this market
Due diligence, site selection and market entry work, by the analysts who wrote this report.
See consulting servicesFrequently asked questions
USD 5.53 billion in 2026, up 13.2% from USD 4.88 billion in 2025, according to DC Market Insights estimates. The market is projected to reach USD 10.00 billion by 2035.
7.43% a year from 2025 to 2035, after 13.32% a year between 2020 and 2025, when annual data center completions rose to 12.0 GW.
USD 4.88 billion of 2025 spending covers the CRAC and CRAH units, in-row coolers, fan walls and rear-door heat exchangers that hold IT inlet air in the 18 °C to 27 °C band, plus their service. Chillers and liquid cooling are excluded.
54.2% of 2025 value, or USD 2.65 billion, goes to perimeter CRAC and CRAH units. Rear-door heat exchangers grow fastest at 13.12% a year, to USD 1.36 billion by 2035.
About USD 290,000 per MW in a conventional hall and USD 115,000 per MW in an AI hall in 2025, according to DC Market Insights estimates, because liquid-cooled AI racks send only 25% to 30% of their heat to air.
40.5% of 2025 value, or USD 1.98 billion, is spent in North America. The Middle East and Africa grows fastest at 11.61% a year, and India is the fastest large country at 13.26%.
About 40% of the market is held by Vertiv, Schneider Electric and STULZ together (DC Market Insights estimate). Carrier, Trane Technologies, Johnson Controls, Daikin Applied, Modine, Munters and Shenzhen Envicool also compete.
No: AI-hall precision air spending rises from USD 483.00 million in 2025 to USD 1.51 billion in 2035, because direct-to-chip cooling still leaves 25% to 30% of rack heat for air systems such as fan walls and rear doors.
USD 5.53 billion in 2026 is the DC Market Insights figure for air-side precision units and their service only. Estimates that add chillers, cooling towers, liquid cooling or comfort air conditioning come out two to three times larger.
Rear-door heat exchangers at 13.12% a year, ahead of service and maintenance at 12.94% and fan walls at 11.47%, as AI halls and a 313 GW installed base reshape demand by 2035.
Licences, delivery and payment
Which licence should I choose?
Single User is a view-only PDF for one person. Multi User adds a printable PDF and the Excel data for unlimited users at one location. Enterprise covers your whole company and includes 100 free analyst hours.
How and when will I receive the report?
By email, within 24–48 business hours of payment, in the formats of your licence.
How can I pay?
Securely through PayPal: with a PayPal account, a debit or credit card, or PayPal Pay Later where available. Prices are in US dollars.
Can I see a sample first?
Yes. Request a free sample and we will email it to you.
Can the report be tailored to my needs?
Yes. We can add countries, segments or data cuts. Talk to an analyst about the scope you need.
Can I get an invoice or pay against a purchase order?
Write to sales@dcmarketinsights.com and our team will help.