
BFSI Data Center Market Size, Share & Forecast to 2035
Market at a glance
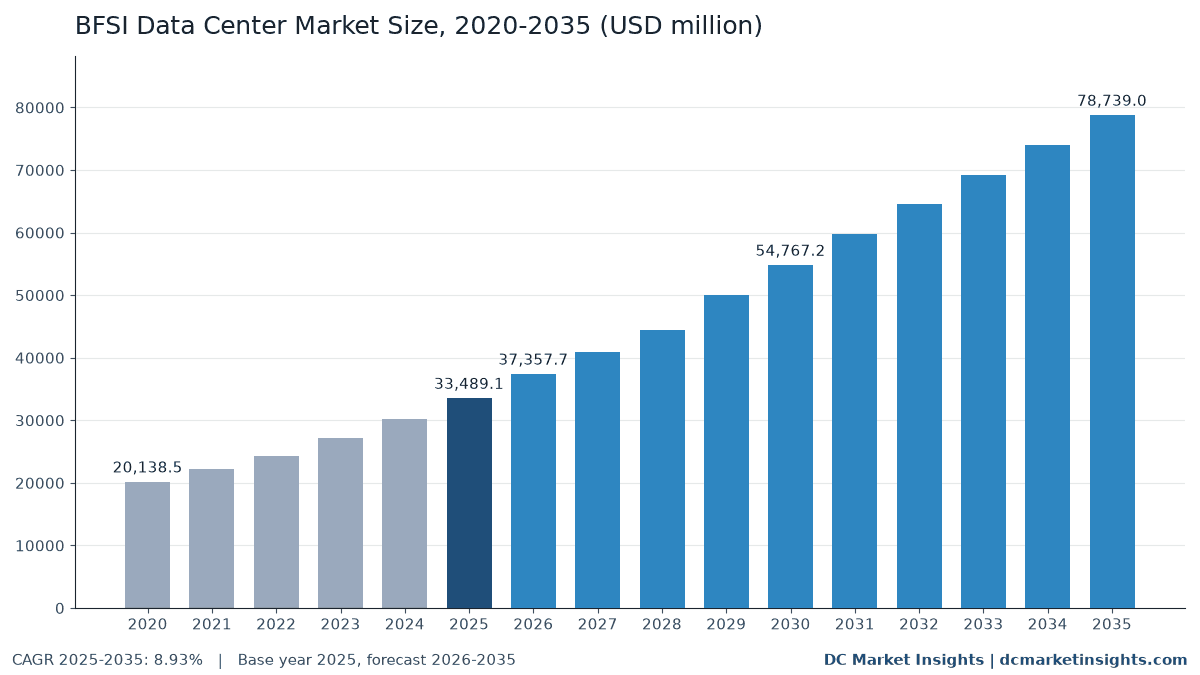
The BFSI Data Center market was worth USD 33.49 billion in 2025 and is forecast to reach USD 78.74 billion by 2035, growing at a 8.93% CAGR.
 By Amit Jain, Senior Consultant, ICT & Emerging Technologies
 Reviewed by Deepti Agrawal
Last updated 22 Oct 2026
Base year 2025 PDF + Excel
Key findings
DORA Puts 19 Critical ICT Providers, Including Two Colocation Operators, Under Supervision
Big Banks Close Their Own Halls After Consolidation
Private Cloud Regions Inside Low-Latency Halls for Exchanges
What is inside the report
- 01Introduction
- 02Executive Summary
- 03Market Scope
- 04Why Market Estimates Differ
- 05Market Drivers
- 06Market Trends
- 07Market Challenges and Restraints
- 08Market Opportunities
- 09Pricing Analysis
- 10Standards and Regulation
- 18chapters
- 2020-2024Historical period
- 2026-2035Forecast period
- 17Companies profiled
Segmentation
Companies profiled
- Equinix
- Digital Realty (InterXion)
- CyrusOne
- NTT DATA
- Iron Mountain Data Centers
- IBM
- Kyndryl
- Dell Technologies
- Hewlett Packard Enterprise
- Cisco Systems
- NVIDIA
- Amazon Web Services
- Microsoft
- Google Cloud
- Oracle
- Schneider Electric
- Vertiv
Recent developments
JPMorgan Chase set its 2026 technology budget at about USD 19.8 billion (Source: JPMorgan Chase annual report).
APRA confirmed that the amended CPS 230 and CPG 230 commence on 1 July 2026 (Source: APRA).
Bank of America reported USD 13 billion of technology spending for 2025, over USD 4 billion of it on new initiatives (Source: Bank of America annual report).
CME Group reported that Google Cloud is developing a private cloud region and a colocation facility in Aurora, Illinois (Source: CME Group 10-K).
the HKMA issued its Practice Guide on Cloud Adoption, replacing its 2022 cloud guidance (Source: HKMA).
the European Supervisory Authorities designated 19 critical ICT third-party providers under DORA, including Equinix (EMEA) and InterXion (Source: ESMA).
Full analysis
The BFSI Data Center Market is valued at USD 37.36 billion in 2026 and is projected to reach USD 78.74 billion by 2035, up from USD 33.49 billion in 2025, a CAGR of 8.93% from 2025 to 2035 (DC Market Insights estimate). Banking, financial services and insurance (BFSI) firms are rebuilding where their systems run rather than adding plain floor space: JPMorgan Chase reports that 98% of its production applications now run in strategic data centers or the public cloud, and it has set a technology budget of about USD 19.8 billion for 2026 (JPMorgan Chase annual report letters, April 2026). The second force is supervision of the landlords themselves. On 18 November 2025 the European Supervisory Authorities named 19 critical information and communication technology (ICT) third-party providers under the Digital Operational Resilience Act (DORA), and two of them, Equinix (EMEA) and InterXion, are colocation operators. The build receipt: 5,900 megawatts (MW) of IT load in use by BFSI firms in 2025 x USD 5.68 million of spending per MW = USD 33.49 billion, and half of that load is already leased, so colocation services grow fastest among components at 11.14% a year, while Asia Pacific leads regional growth at 11.38% because India and Indonesia force payment and market data onshore.
Key Market Statistics: How Much Do Banks and Insurers Spend on Data Centers in 2026?
DC Market Insights values BFSI data center spending at USD 37.36 billion in 2026, 11.55% above 2025, as new AI racks and leased capacity are added faster than old bank-owned halls close.
- Market size 2025: USD 33.49 billion
- Market size 2026: USD 37.36 billion
- Market size 2030: USD 54.77 billion
- Market size 2035: USD 78.74 billion
- CAGR 2025-2035: 8.93% (low case 6.78%, high case 10.55%)
- Largest component: IT hardware, USD 23.55 billion or 70.3% of 2025 value
- Fastest component: colocation services, 11.14% a year to USD 21.37 billion by 2035
- Fastest workload: AI and data analytics, 15.11% a year
- Leading region: North America, USD 13.73 billion or 41.0% of 2025 value; fastest region: Asia Pacific at 11.38%
- Largest country: United States, USD 12.39 billion in 2025; fastest large country: India at 16.74%
- Market leader in leased capacity: Equinix, among the top five colocation providers that hold about 38% of BFSI colocation spending (DC Market Insights estimate)
Executive Summary: What Drives the BFSI Data Center Market to 2035?
The Global BFSI Data Center Market size was valued at USD 20.14 billion in 2020, reached USD 33.49 billion in 2025, and is anticipated to reach USD 78.74 billion by 2035, at a CAGR of 8.93% during the forecast period. Spending grew 10.71% a year from 2020 to 2025 as banks refreshed core systems, moved disaster recovery into leased halls and began buying graphics processing unit (GPU) clusters.
| Attribute | Value |
|---|---|
| Historical period | 2020-2024 |
| Base year | 2025 |
| Forecast period | 2026-2035 |
| Market size 2025 | USD 33.49 billion |
| Market size 2026 | USD 37.36 billion |
| CAGR 2025-2035 | 8.93% |
| Market size 2035 | USD 78.74 billion |
Growth slows from 10.71% to 8.93% a year because the large banks have finished their data center consolidation and now send part of new demand to public cloud, which this estimate excludes. What keeps the market rising is the BFSI IT load in use, which climbs from 5,900 MW in 2025 to 12,100 MW in 2035, and the share of it running AI racks, which rises from 8% to 28%. Each AI MW carries about USD 8.5 million a year of hardware against USD 3.6 million for a conventional MW.
What Does the BFSI Data Center Market Include?
The BFSI Data Center Market covers USD 33.49 billion of 2025 spending by banks, insurers, capital-market firms, exchanges and payment companies on the data center capacity they own or lease.
Included: IT hardware (servers, storage, network switches and GPU systems) installed in BFSI-owned and colocated halls; colocation and wholesale rent, power and cross-connect fees paid by BFSI tenants; electrical and mechanical equipment for owned sites (uninterruptible power supply (UPS) systems, switchgear, chillers); construction, renovation and tenant fit-out.
Excluded: public cloud infrastructure and software services bought by BFSI firms, banking software licences, IT services labour, electricity bills of owned sites, branch IT, automated teller machines and staff devices.
How the segments fit together: component, end user, workload and institution size each split the same total. Every region and country value is spending in the place where the hall sits.
Why Do BFSI Data Center Market Estimates Differ?
Published figures for the BFSI data center market differ by more than 1.5 times because some include cloud bills and services, while DC Market Insights counts USD 37.36 billion in 2026 of owned and leased data center capacity only.
Broader definitions add public cloud infrastructure and platform services that banks rent from hyperscale providers, the banking software that runs on it, managed IT outsourcing contracts and the electricity that owned sites burn. Each of these is a real BFSI cost, but none of them is data center capacity bought by the bank, and adding cloud would count the same hyperscale halls twice. Also out of scope are branch networks, automated teller machines and trading-floor desktops. In scope are buyers of every size: global systemically important banks, regional lenders, community banks, credit unions, small insurers and digital-only banks and fintechs that rent a few racks.
| Element | Included here | Why |
|---|---|---|
| IT hardware in owned and leased halls | Yes, USD 23.55 billion in 2025 | Bought and run by the BFSI firm |
| Colocation and wholesale rent | Yes, USD 7.43 billion in 2025 | Capacity the BFSI firm controls |
| Electrical, mechanical and construction | Yes, USD 2.50 billion in 2025 | Owned-site build and fit-out |
| Public cloud services | No | Counted in hyperscale capacity |
| Software, IT services, electricity | No | Not data center capacity |
Market Drivers: What Is Pushing BFSI Data Center Spending Up?
The BFSI data center market adds USD 45.25 billion between 2025 and 2035, led by three drivers: supervision of colocation landlords, exchanges moving into private cloud regions, and bank AI clusters.
DORA Puts 19 Critical ICT Providers, Including Two Colocation Operators, Under Supervision
DORA has applied since 17 January 2025 to more than 20 types of financial entities, according to the European Securities and Markets Authority (ESMA). On 18 November 2025 the European Supervisory Authorities designated 19 critical ICT third-party providers, including Equinix (EMEA) B.V. and InterXion HeadQuarters B.V. (ESMA, November 2025). For a bank, a supervised colocation provider is easier to defend to its own regulator than a small one, so European BFSI leasing concentrates in large campuses. DC Market Insights puts European BFSI data center spending at USD 9.04 billion in 2025, rising to USD 18.50 billion by 2035.
Exchanges Trade Owned Halls for Private Cloud Regions: CME, Nasdaq and LSEG
CME Group signed a 10-year partnership with Google Cloud in November 2021, with a USD 1 billion Google equity investment in CME. Its 10-K for 2025 states that Google Cloud is developing a new private cloud region and a colocation facility in Aurora, Illinois, while CME still leases its largest data center there from CyrusOne until 2031 (CME Group 10-K, February 2026). Nasdaq expects to move more markets to Amazon Web Services (AWS) over the next several years, according to its 2025 10-K, and the London Stock Exchange Group (LSEG) committed to minimum cloud spending of USD 2.8 billion with Microsoft in December 2022. These moves keep the matching engines in leased low-latency halls; DC Market Insights values capital markets and exchanges at USD 5.69 billion in 2025.
Bank AI Clusters: BNY’s DGX SuperPOD and JPMorgan’s 65,000 LLM Suite Users
BNY said in March 2024 that it was the first major bank to deploy an NVIDIA (the US graphics chip designer) DGX SuperPOD with DGX H100 systems (DGX: NVIDIA’s eight-GPU AI server line). JPMorgan Chase reported in April 2026 that more than 65,000 corporate and investment bank staff use LLM Suite, its generative AI platform. DC Market Insights estimates that BFSI AI racks draw 472 MW in 2025 and 3,388 MW in 2035, and that AI hardware spending rises from USD 4.01 billion to USD 22.02 billion.
Market Trends: How Are Banks Changing the Way They Use Data Centers?
In the BFSI data center market, the leased share of IT load rises from 38% in 2020 to 50% in 2025 and 64% in 2035, the single biggest change in how the money is spent.
Big Banks Close Their Own Halls After Consolidation
JPMorgan Chase’s consumer bank wrote in its April 2025 annual report letter that “the migration to new data centers” was largely behind it (Source: JPMorgan Chase), and Bank of America spent USD 13 billion on technology in 2025, over USD 4 billion of it on new initiatives, according to its annual report. Spending moves from building to running: DC Market Insights puts electrical and mechanical work for owned BFSI sites at USD 1.65 billion in 2025, only 4.9% of the market.
Onshore Data Rules Keep Payment and Market Data in India
The Reserve Bank of India (RBI) required in April 2018 that all payment-system data be stored only in India, with six months to comply (RBI circular, 6 April 2018). In March 2023 the Securities and Exchange Board of India (SEBI) required market data, including disaster recovery copies, to reside in India with cloud bought only from providers empanelled by the Ministry of Electronics and Information Technology (MeitY). India is the fastest large country at 16.74% a year, from USD 870.72 million in 2025 to USD 4.09 billion by 2035.
Payment Networks Scale Their Processing Cores
Visa ran four global data centers in the United States, the United Kingdom and Singapore in fiscal 2025, when 329 billion Visa-brand transactions, an average of 901 million a day, were processed, according to its 10-K. Mastercard switched 175.5 billion transactions in 2025, up 9%. Payments and fintech spending grows 12.65% a year to USD 11.02 billion by 2035, the fastest end user.
Market Challenges and Restraints: What Holds BFSI Data Center Spending Back?
Two restraints could cut about USD 14.17 billion from the 2035 BFSI data center market base case in the low scenario: duplicate-site rules that make every MW cost more, and concentration rules that slow moves to one provider.
Four-Hour Downtime Caps Force Second Sites
The Monetary Authority of Singapore (MAS) Notice FSM-N05 of May 2024, issued under the Financial Services and Markets (FSM) Act 2022, limits unscheduled downtime of each critical banking system to 4 hours in any 12 months and sets a recovery time objective of no more than 4 hours (MAS Notice FSM-N05). Rules like this make banks pay for two halls per critical system. DC Market Insights values disaster recovery and backup at USD 5.36 billion in 2025, money that adds resilience but no new capacity, which is why that workload grows only 6.69% a year.
Concentration and Access Rules Slow Provider Changes
The UK critical third parties regime took effect on 1 January 2025, according to the Bank of England, Office of the Superintendent of Financial Institutions (OSFI) Guideline B-10 has required access to records stored outside Canada since 1 May 2024, and the Australian Prudential Regulation Authority (APRA) applied Cross-industry Prudential Standard (CPS) 230 from 1 July 2025, with an amended version from 1 July 2026. Each switch of provider needs exit plans and supervisor notice, so contracts run longer: DC Market Insights assumes the blended colocation rate rises only from USD 210 to USD 230 per kilowatt (kW) a month by 2035.
Market Opportunities: Where Is the New Money in BFSI Data Centers?
Two BFSI data center openings are worth USD 34.62 billion together by 2035: low-latency halls for exchanges and onshore AI capacity for regional banks.
Private Cloud Regions Inside Low-Latency Halls for Exchanges
CME’s Aurora plan shows the model: a cloud provider builds a dedicated region beside the matching engine, inside a leased campus. DC Market Insights values trading and market data workloads at USD 4.35 billion in 2025 and USD 8.66 billion by 2035, and expects at least two more exchange groups to sign similar agreements before 2030. The High-Frequency Trading Server Market report covers the servers inside these halls.
Onshore AI Halls for Regional Banks in Saudi Arabia, India and Indonesia
The Saudi Central Bank (SAMA) Cyber Security Framework says that in principle only cloud services located in Saudi Arabia should be used, and Indonesia’s Financial Services Authority (OJK) Regulation 11/2022 requires banks to seek approval to place data centers abroad. Regional and mid-size institutions cannot send AI training data offshore, so they rent GPU racks locally: DC Market Insights puts AI and data analytics at USD 25.96 billion by 2035 and regional institutions at USD 30.71 billion.
Pricing Analysis: What Does a BFSI Data Center MW Cost?
DC Market Insights estimates total BFSI data center spending of USD 5.68 million per MW in use in 2025, rising to USD 6.51 million in 2035 as AI racks take a larger share.
| Year | BFSI IT load in use (MW) | Blended colocation rate per kW-month | IT hardware per conventional MW-year | IT hardware per AI MW-year | Total spend per MW |
|---|---|---|---|---|---|
| 2020 | 4,300 | USD 190 | USD 3.30 million | USD 7.00 million | USD 4.68 million |
| 2025 | 5,900 | USD 210 | USD 3.60 million | USD 8.50 million | USD 5.68 million |
| 2030 | 8,600 | USD 222 | USD 3.50 million | USD 7.50 million | USD 6.37 million |
| 2035 | 12,100 | USD 230 | USD 3.40 million | USD 6.50 million | USD 6.51 million |
Public price anchors: CME agreed in March 2016 to sell its Aurora, Illinois data center to CyrusOne for USD 130 million and lease it back, according to CME; LSEG’s minimum Microsoft cloud commitment of USD 2.8 billion runs over a 10-year agreement, about USD 280 million a year; Bank of America’s technology spending was USD 12 billion in 2024 and USD 13 billion in 2025. New owned capacity costs DC Market Insights about USD 10.5 million per MW in 2025 for building, electrical and mechanical work.
Which Rules Shape Where Banks Put Their Data Centers?
Eleven rules from nine jurisdictions decide where at least USD 22.30 billion of 2025 BFSI data center spending can sit.
In the European Union, DORA has applied since 17 January 2025 and its oversight of critical providers began with the 19 designations of November 2025. In the United Kingdom, the Prudential Regulation Authority (PRA) supervisory statement SS2/21 on outsourcing has applied since 31 March 2022, and the critical third parties regime since 1 January 2025. In the United States, the Federal Reserve, the Federal Deposit Insurance Corporation and the Office of the Comptroller of the Currency issued joint third-party guidance on 6 June 2023. In Asia Pacific, the RBI payment-data rule of April 2018, the SEBI cloud framework of March 2023, MAS Notice FSM-N05 and APRA CPS 230 apply, and the Hong Kong Monetary Authority (HKMA) issued a Practice Guide on Cloud Adoption on 8 January 2026. Banco Central do Brasil Resolution CMN 4,893 of February 2021 requires notice of relevant cloud and data storage contracts within ten days. Energy rules matter too: the International Energy Agency (IEA) puts global data center electricity use at about 415 terawatt-hours in 2024.
How Is the BFSI Data Center Market Segmented?
In the BFSI Data Center Market, IT hardware is the largest component at USD 23.55 billion in 2025, banking the largest end user at USD 19.42 billion, and core banking the largest workload at USD 12.39 billion.
By Component
IT hardware holds 70.3% of 2025 value; colocation services grow fastest at 11.14% as the leased share of BFSI MW rises.
| Component | 2025 (USD million) | Share 2025 | 2035 (USD million) | CAGR 2025-2035 |
|---|---|---|---|---|
| IT Hardware | USD 23,552.80 million | 70.3% | USD 51,642.80 million | 8.17% |
| Colocation Services | USD 7,434.00 million | 22.2% | USD 21,373.44 million | 11.14% |
| Electrical and Mechanical Infrastructure | USD 1,645.00 million | 4.9% | USD 3,657.60 million | 8.32% |
| Construction and Fit-Out | USD 857.25 million | 2.6% | USD 2,065.20 million | 9.19% |
By End User
Banking leads with 58.0%; payments and fintech grows fastest at 12.65% as card and real-time payment volumes rise.
| End User | 2025 (USD million) | Share 2025 | 2035 (USD million) | CAGR 2025-2035 |
|---|---|---|---|---|
| Banking | USD 19,423.64 million | 58.0% | USD 43,306.46 million | 8.35% |
| Capital Markets and Exchanges | USD 5,693.14 million | 17.0% | USD 11,810.86 million | 7.57% |
| Insurance | USD 5,023.36 million | 15.0% | USD 12,598.25 million | 9.63% |
| Payments and Fintech | USD 3,348.91 million | 10.0% | USD 11,023.47 million | 12.65% |
By Workload
Core banking and transaction processing holds 37.0% of 2025 value, but AI and data analytics overtakes it by 2035 with USD 25.96 billion.
| Workload | 2025 (USD million) | Share 2025 | 2035 (USD million) | CAGR 2025-2035 |
|---|---|---|---|---|
| Core Banking and Transaction Processing | USD 12,390.94 million | 37.0% | USD 22,834.32 million | 6.30% |
| AI and Data Analytics | USD 6,356.22 million | 19.0% | USD 25,960.26 million | 15.11% |
| Disaster Recovery and Backup | USD 5,358.25 million | 16.0% | USD 10,236.08 million | 6.69% |
| Trading and Market Data | USD 4,353.58 million | 13.0% | USD 8,661.29 million | 7.12% |
| Digital Channels and Other Workloads | USD 5,030.06 million | 15.0% | USD 11,047.09 million | 8.19% |
By Institution Size
Global systemically important institutions spend USD 13.73 billion in 2025; digital-only banks and fintechs grow fastest at 13.90% from a small base.
| Institution Size | 2025 (USD million) | Share 2025 | 2035 (USD million) | CAGR 2025-2035 |
|---|---|---|---|---|
| Global Systemically Important Institutions | USD 13,730.51 million | 41.0% | USD 29,133.44 million | 7.81% |
| Regional and Mid-Size Institutions | USD 12,725.84 million | 38.0% | USD 30,708.23 million | 9.21% |
| Community Banks Credit Unions and Small Insurers | USD 4,353.58 million | 13.0% | USD 9,054.99 million | 7.60% |
| Digital-Only Banks and Fintechs | USD 2,679.12 million | 8.0% | USD 9,842.38 million | 13.90% |
DC Exclusive: BFSI Data Residency and Resilience Rule Timeline, 11 Rules in 9 Jurisdictions
The BFSI data center rule timeline is a DC Market Insights model built from 11 inputs (dated rules), with the spending each rule governs estimated from the DC Market Insights country and region values, so a provider can see where a compliant hall is a sales requirement rather than an option.
| Rule | Jurisdiction | Date in force | What it requires | 2025 BFSI data center spending governed |
|---|---|---|---|---|
| Saudi Central Bank (SAMA) Cyber Security Framework 3.4.3 | Saudi Arabia | 24 May 2017 | Cloud services in principle located in Saudi Arabia; outside the Kingdom only with explicit SAMA approval | inside Middle East and Africa USD 1.27 billion |
| Reserve Bank of India (RBI) Storage of Payment System Data | India | 6 Apr 2018 | All payment-system data stored only in India, six months to comply | USD 870.72 million |
| Banco Central do Brasil Resolution CMN 4,893 | Brazil | 26 Feb 2021 | Relevant processing, storage and cloud contracts notified to the central bank within ten days, with the countries where data sit | USD 535.82 million |
| Securities and Exchange Board of India (SEBI) cloud framework | India | 6 Mar 2023 | Market data, including disaster recovery copies, must reside in India; only MeitY-empanelled providers | USD 870.72 million |
| US interagency guidance on third-party relationships | United States | 6 Jun 2023 | One risk framework for every outside provider, data center operators included | USD 12.39 billion |
| Office of the Superintendent of Financial Institutions (OSFI) Guideline B-10 | Canada | 1 May 2024 | OSFI must get immediate access to records stored outside Canada | USD 1.00 billion |
| Monetary Authority of Singapore (MAS) Notice FSM-N05 | Singapore | 9 May 2024 | Critical systems down no more than 4 hours in 12 months; recovery time objective of 4 hours | USD 636.29 million |
| UK critical third parties regime (PRA and FCA) | United Kingdom | 1 Jan 2025 | Direct oversight of providers that HM Treasury designates as critical | USD 2.18 billion |
| EU Digital Operational Resilience Act (DORA) | European Union | 17 Jan 2025 | ICT risk, testing and third-party rules for more than 20 types of financial entities | inside Europe USD 9.04 billion |
| DORA critical ICT third-party provider designations | European Union | 18 Nov 2025 | 19 providers named, including Equinix (EMEA) and InterXion, under direct supervision | inside Europe USD 9.04 billion |
| Australian Prudential Regulation Authority (APRA) CPS 230 | Australia | 1 Jul 2025 (amended version 1 Jul 2026) | Operational risk and material service provider rules for banks and insurers | USD 602.80 million |
The pattern is clear: rules before 2023 fixed where data must sit (Saudi Arabia, India, Brazil), and rules from 2023 onward supervise who runs the hall (United States, Canada, United Kingdom, European Union, Australia). The second group covers about USD 23.04 billion of 2025 spending (the United Kingdom counted inside Europe), so provider due diligence, not floor space, now decides most BFSI leasing.
Regional Insights: Which Region Spends Most on BFSI Data Centers?
North America leads the BFSI Data Center Market with USD 13.73 billion, 41.0% of 2025 value, and Asia Pacific grows fastest at 11.38% a year to USD 23.62 billion by 2035.
North America
USD 13.73 billion in 2025, growing 7.96% a year. CME’s Aurora campus, where Google Cloud is building a private region, and JPMorgan Chase’s USD 19.8 billion 2026 technology budget anchor the region.
Europe
USD 9.04 billion in 2025, growing 7.42%. DORA and the 19 critical provider designations of November 2025 steer bank leasing toward supervised operators such as Equinix and InterXion.
Asia Pacific
USD 8.04 billion in 2025, the fastest region at 11.38%. India’s onshore payment and market data rules, Singapore’s 4-hour downtime cap and Australia’s CPS 230 all require local or duplicated capacity.
Latin America
USD 1.41 billion in 2025, growing 9.92%. Brazil, at USD 535.82 million, requires banks to notify the central bank within ten days of hiring relevant cloud or data storage services, naming the countries where the data sit.
Middle East and Africa
USD 1.27 billion in 2025, growing 10.53%. The SAMA rule that cloud services should in principle be located in Saudi Arabia keeps Gulf bank workloads in-country.
Country Analysis: Which Countries Lead BFSI Data Center Spending?
The United States leads BFSI data center spending with USD 12.39 billion in 2025, and India is the fastest large country at 16.74% a year.
| Rank | Country | Region | 2025 (USD million) | 2035 (USD million) | CAGR 2025-2035 |
|---|---|---|---|---|---|
| 1 | United States | North America | USD 12,390.95 million | USD 26,141.36 million | 7.75% |
| 2 | United Kingdom | Europe | USD 2,176.79 million | USD 4,251.91 million | 6.92% |
| 3 | Japan | Asia Pacific | USD 1,741.43 million | USD 3,622.00 million | 7.60% |
| 4 | China | Asia Pacific | USD 1,674.45 million | USD 4,566.86 million | 10.55% |
| 5 | Germany | Europe | USD 1,473.52 million | USD 2,992.08 million | 7.34% |
| 6 | Canada | North America | USD 1,004.67 million | USD 2,283.43 million | 8.56% |
| 7 | France | Europe | USD 971.18 million | USD 2,047.22 million | 7.74% |
| 8 | India | Asia Pacific | USD 870.72 million | USD 4,094.43 million | 16.74% |
| 9 | Switzerland | Europe | USD 669.78 million | USD 1,259.82 million | 6.52% |
| 10 | Singapore | Asia Pacific | USD 636.29 million | USD 1,732.26 million | 10.53% |
| 11 | Australia | Asia Pacific | USD 602.80 million | USD 1,417.30 million | 8.93% |
| 12 | Brazil | Latin America | USD 535.82 million | USD 1,496.04 million | 10.81% |
India’s growth comes from the RBI and SEBI localisation rules plus a banking system that the RBI’s November 2022 study found had only two private banks with a certified green data center, which signals a refresh backlog. China (USD 1.67 billion) and Singapore (USD 636.29 million) follow at about 10.5% a year.
Forecast Scenarios: How Big Could the BFSI Data Center Market Be in 2035?
DC Market Insights sets a 2035 BFSI Data Center Market range of USD 64.57 billion to USD 91.34 billion around the base case of USD 78.74 billion.
| Scenario | 2035 (USD million) | CAGR 2025-2035 | Assumption |
|---|---|---|---|
| Low | USD 64,566.01 million | 6.78% | Faster public cloud migration; AI share of BFSI MW at 20% in 2035 |
| Base | USD 78,739.04 million | 8.93% | BFSI MW 12,100 in 2035, 64% leased, AI share 28% |
| High | USD 91,337.29 million | 10.55% | More onshore AI halls under residency rules; colocation rate 10% higher |
Competitive Insights: Who Supplies Data Centers to Banks and Insurers?
In the BFSI data center market, the top five colocation providers hold about 38% of the USD 7.43 billion BFSI colocation spending in 2025 (DC Market Insights estimate, based on their share of leased BFSI MW in the main financial hubs).
- Equinix
- Digital Realty (InterXion)
- CyrusOne
- NTT DATA
- Iron Mountain Data Centers
- IBM
- Kyndryl
- Dell Technologies
- Hewlett Packard Enterprise
- Cisco Systems
- NVIDIA
- Amazon Web Services
- Microsoft
- Google Cloud
- Oracle
- Schneider Electric
- Vertiv
Equinix had over 10,500 customers and more than 500,000 interconnections at the end of 2025, and names financial services companies as a core customer group in its 10-K. Digital Realty, which owns InterXion, had more than 5,000 customers and lists the financial services sector among its demand sources. CyrusOne owns the Aurora data center that CME leases until 2031. Intercontinental Exchange (ICE) keeps about 250,000 square feet of production, non-production and disaster recovery facilities, according to its 2025 10-K. In hardware, Dell Technologies, Hewlett Packard Enterprise, Cisco Systems and NVIDIA supply most of the USD 23.55 billion of IT hardware; Schneider Electric and Vertiv lead in power and cooling for owned sites. Amazon Web Services, Microsoft and Google Cloud now compete for the same exchange workloads through private regions, a role the Data Center Outsourcing Market report tracks from the service side.
Recent Developments in the BFSI Data Center Market
Six dated events between November 2025 and April 2026 set the rules for the USD 3.87 billion the BFSI data center market adds in 2026.
- In April 2026, JPMorgan Chase set its 2026 technology budget at about USD 19.8 billion (Source: JPMorgan Chase annual report).
- In April 2026, APRA confirmed that the amended CPS 230 and CPG 230 commence on 1 July 2026 (Source: APRA).
- In March 2026, Bank of America reported USD 13 billion of technology spending for 2025, over USD 4 billion of it on new initiatives (Source: Bank of America annual report).
- In February 2026, CME Group reported that Google Cloud is developing a private cloud region and a colocation facility in Aurora, Illinois (Source: CME Group 10-K).
- In January 2026, the HKMA issued its Practice Guide on Cloud Adoption, replacing its 2022 cloud guidance (Source: HKMA).
- In November 2025, the European Supervisory Authorities designated 19 critical ICT third-party providers under DORA, including Equinix (EMEA) and InterXion (Source: ESMA).
Research Methodology: How DC Market Insights Sized the BFSI Data Center Market
The BFSI data center model multiplies 5,900 MW of BFSI IT load in 2025 by spending per MW for each component, giving USD 33.49 billion.
BFSI IT load is about 12.8% of the roughly 46 gigawatts (GW) of enterprise and colocation capacity inside the 116 GW installed worldwide in 2025 (DC Market Insights capacity base). IT hardware = conventional MW x USD 3.60 million + AI MW (472) x USD 8.50 million = USD 23.55 billion. Colocation = 2,950 leased MW x USD 210 per kW-month x 12 = USD 7.43 billion. Owned sites add USD 1.65 billion of electrical and mechanical work and USD 857.25 million of construction and fit-out. Splits by end user, workload, institution size, region and country are DC Market Insights shares, and every split sums to the total each year.
Bound checks: (1) the market is 5.9% of the USD 570.04 billion 2025 data center market in DC Market Insights’ global model, inside the 5-8% range that a single enterprise vertical can hold; (2) BFSI colocation of USD 7.43 billion is 10.0% of the USD 74.46 billion Data Center Colocation Market in 2025; (3) as a floor, JPMorgan Chase (USD 19.8 billion for 2026) and Bank of America (USD 13 billion in 2025) alone budget USD 32.8 billion for technology, and a 12% data center share of those two budgets is USD 3.9 billion, 11.8% of the market. Leased capacity in shared buildings is covered in the Multi-Tenant Data Center Market report. Full method: DC Market Insights research methodology.
Table of contents
- 01Introduction
- 1.1Report Description
- 1.2Key Market Statistics, 2025, 2026, 2030 and 2035
- 02Executive Summary
- 2.1Market Snapshot, 2025, 2026 and 2035
- 2.2Market Size Chart, 2020-2035
- 03Market Scope
- 3.1Included
- 3.2Excluded
- 3.3How the Segments Fit Together
- 04Why Market Estimates Differ
- 4.1Scope Table: In and Out of This Estimate
- 05Market Drivers
- 5.1DORA Puts 19 Critical ICT Providers, Including Two Colocation Operators, Under Supervision
- 5.2Exchanges Trade Owned Halls for Private Cloud Regions: CME, Nasdaq and LSEG
- 5.3Bank AI Clusters: BNY's DGX SuperPOD and JPMorgan's 65,000 LLM Suite Users
- 06Market Trends
- 6.1Big Banks Close Their Own Halls After Consolidation
- 6.2Onshore Data Rules Keep Payment and Market Data in India
- 6.3Payment Networks Scale Their Processing Cores
- 07Market Challenges and Restraints
- 7.1Four-Hour Downtime Caps Force Second Sites
- 7.2Concentration and Access Rules Slow Provider Changes
- 08Market Opportunities
- 8.1Private Cloud Regions Inside Low-Latency Halls for Exchanges
- 8.2Onshore AI Halls for Regional Banks in Saudi Arabia, India and Indonesia
- 09Pricing Analysis
- 9.1Spending per MW, 2020-2035
- 9.2Public Price Anchors
- 10Standards and Regulation
- 10.1EU Digital Operational Resilience Act (DORA), 2025
- 10.2UK PRA SS2/21 and Critical Third Parties Regime
- 10.3US Interagency Third-Party Guidance, 2023
- 10.4RBI and SEBI Data Localisation Rules
- 10.5MAS Notice FSM-N05 and APRA CPS 230
- 10.6HKMA Practice Guide on Cloud Adoption, 2026
- 10.7Banco Central do Brasil Resolution CMN 4,893
- 11Market Segmentation
- 11.1By Component
- 11.2IT Hardware
- 11.3Colocation Services
- 11.4Electrical and Mechanical Infrastructure
- 11.5Construction and Fit-Out
- 11.6By End User
- 11.7Banking
- 11.8Capital Markets and Exchanges
- 11.9Insurance
- 11.10Payments and Fintech
- 11.11By Workload
- 11.12Core Banking and Transaction Processing
- 11.13AI and Data Analytics
- 11.14Disaster Recovery and Backup
- 11.15Trading and Market Data
- 11.16Digital Channels and Other Workloads
- 11.17By Institution Size
- 11.18Global Systemically Important Institutions
- 11.19Regional and Mid-Size Institutions
- 11.20Community Banks Credit Unions and Small Insurers
- 11.21Digital-Only Banks and Fintechs
- 12DC Exclusive: BFSI Data Residency and Resilience Rule Timeline
- 12.1Saudi Central Bank (SAMA) Cyber Security Framework 3.4.3
- 12.2Reserve Bank of India (RBI) Storage of Payment System Data
- 12.3Banco Central do Brasil Resolution CMN 4,893
- 12.4Securities and Exchange Board of India (SEBI) cloud framework
- 12.5US interagency guidance on third-party relationships
- 12.6Office of the Superintendent of Financial Institutions (OSFI) Guideline B-10
- 12.7Monetary Authority of Singapore (MAS) Notice FSM-N05
- 12.8UK critical third parties regime (PRA and FCA)
- 12.9EU Digital Operational Resilience Act (DORA)
- 12.10DORA critical ICT third-party provider designations
- 12.11Australian Prudential Regulation Authority (APRA) CPS 230
- 13Regional Insights
- 13.1North America
- 13.2Europe
- 13.3Asia Pacific
- 13.4Latin America
- 13.5Middle East and Africa
- 14Country Analysis
- 14.1United States
- 14.2United Kingdom
- 14.3Japan
- 14.4China
- 14.5Germany
- 14.6Canada
- 14.7France
- 14.8India
- 14.9Switzerland
- 14.10Singapore
- 14.11Australia
- 14.12Brazil
- 15Forecast Scenarios, 2035
- 15.1Low Scenario
- 15.2Base Scenario
- 15.3High Scenario
- 16Competitive Insights
- 16.1Equinix
- 16.2Digital Realty (InterXion)
- 16.3CyrusOne
- 16.4NTT DATA
- 16.5Iron Mountain Data Centers
- 16.6IBM
- 16.7Kyndryl
- 16.8Dell Technologies
- 16.9Hewlett Packard Enterprise
- 16.10Cisco Systems
- 16.11NVIDIA
- 16.12Amazon Web Services
- 16.13Microsoft
- 16.14Google Cloud
- 16.15Oracle
- 16.16Schneider Electric
- 16.17Vertiv
- 16.18Colocation Concentration, 2025
- 17Recent Developments
- 17.1JPMorgan Chase 2026 Technology Budget, April 2026
- 17.2APRA Amended CPS 230, April 2026
- 17.3Bank of America 2025 Technology Spending, March 2026
- 17.4CME Group and Google Cloud Aurora Region, February 2026
- 17.5HKMA Practice Guide on Cloud Adoption, January 2026
- 17.6DORA Critical Provider Designations, November 2025
- 18Research Methodology
- 18.1Model Inputs
- 18.2Bound Checks
- Fig. 1BFSI Data Center Market Size, 2020-2035 (USD million)
- Table 1Market Snapshot, 2025, 2026 and 2035
- Table 2Scope Table: In and Out of This Estimate
- Table 3Spending per MW, 2020-2035
- Table 4Market by Component, 2025 and 2035
- Table 5Market by End User, 2025 and 2035
- Table 6Market by Workload, 2025 and 2035
- Table 7Market by Institution Size, 2025 and 2035
- Table 8BFSI Data Residency and Resilience Rule Timeline
- Table 9Top 12 Countries, 2025 and 2035
- Table 102035 Forecast Scenarios
About this report
Written by Amit Jain and reviewed by Deepti Agrawal, Senior Editor, Research. Figures are built top-down and bottom-up and reconciled before publication, with 2025 as the base year.
Read our methodologyHow we built this
- Historical period2020-2024
- Base year2025
- Forecast period2026-2035
- Sizing approachTop-down + bottom-up
Need more than the report?
Advisory on this market
Due diligence, site selection and market entry work, by the analysts who wrote this report.
See consulting servicesFrequently asked questions
USD 37.36 billion in 2026, up 11.55% from USD 33.49 billion in 2025, according to DC Market Insights estimates. The market is projected to reach USD 78.74 billion by 2035, a CAGR of 8.93% from 2025.
8.93% a year from 2025 to 2035, after 10.71% a year from 2020 to 2025, as BFSI IT load in use rises from 5,900 MW to 12,100 MW and AI racks grow from 8% to 28% of it.
Banks spent USD 19.42 billion on owned and leased data center capacity in 2025, 58.0% of BFSI spending (DC Market Insights). Bank of America’s total technology spending was USD 13 billion in 2025.
Partly. JPMorgan Chase says 98% of its production applications run in strategic data centers or the public cloud and about 50% on public or private cloud, while CME Group is moving its markets to a Google Cloud private region in Aurora, Illinois.
DORA has applied since 17 January 2025. On 18 November 2025 the European Supervisory Authorities designated 19 critical ICT third-party providers, including colocation operators Equinix (EMEA) and InterXion, which now face direct EU oversight.
Colocation services grow fastest among components at 11.14% a year to USD 21.37 billion by 2035, and AI and data analytics is the fastest workload at 15.11% a year.
North America, with USD 13.73 billion or 41.0% of 2025 value. Asia Pacific grows fastest at 11.38% a year, and India is the fastest large country at 16.74%.
India, worth USD 870.72 million in 2025, requires payment-system data to be stored only in India (RBI, April 2018) and market data to reside in India (SEBI, March 2023); Saudi Arabia’s SAMA expects cloud services located in the Kingdom.
Equinix, Digital Realty (InterXion), CyrusOne, NTT DATA and Iron Mountain Data Centers lead leased capacity; the top five hold about 38% of the USD 7.43 billion BFSI colocation spending in 2025 (DC Market Insights estimate).
USD 37.36 billion in 2026 counts only owned and leased data center capacity. Estimates that add public cloud services, banking software, IT outsourcing or electricity bills come out larger.
Licences, delivery and payment
Which licence should I choose?
Single User is a view-only PDF for one person. Multi User adds a printable PDF and the Excel data for unlimited users at one location. Enterprise covers your whole company and includes 100 free analyst hours.
How and when will I receive the report?
By email, within 24–48 business hours of payment, in the formats of your licence.
How can I pay?
Securely through PayPal: with a PayPal account, a debit or credit card, or PayPal Pay Later where available. Prices are in US dollars.
Can I see a sample first?
Yes. Request a free sample and we will email it to you.
Can the report be tailored to my needs?
Yes. We can add countries, segments or data cuts. Talk to an analyst about the scope you need.
Can I get an invoice or pay against a purchase order?
Write to sales@dcmarketinsights.com and our team will help.