
Data Center Fiber Optic Cabling Connectivity Market Size, Share & Forecast to 2035
Market at a glance
The Data Center Fiber Optic Cabling Connectivity market was worth USD 5,320.0 million in 2025 and is forecast to reach USD 16.69 billion by 2035, growing at a 12.12% CAGR. North America accounts for 46.54% of the market.
 By Amit Jain, Senior Consultant, ICT & Emerging Technologies
 Reviewed by Deepti Agrawal
Last updated 15 Oct 2026
Base year 2025 PDF + Excel
Reviewed by Deepti Agrawal
Last updated 15 Oct 2026
Base year 2025 PDF + Excel
Source: DC Market Insights analysis
Key findings
AI halls need more than ten times the fiber
VSFF connectors replace MPO in AI halls
Fiber and preform shortages raise prices
VSFF trunks and cassettes for AI back-end fabrics
What is inside the report
- 01Introduction
- 02Executive Summary
- 03Market Scope and Estimate Comparison
- 04Market Dynamics
- 05Pricing Analysis
- 06Standards and Regulation
- 07Market Segmentation
- 08DC Exclusive
- 09Regional Insights
- 10Country Analysis
- 13chapters
- 2020-2024Historical period
- 2026-2035Forecast period
- 17Companies profiled
Regional insights
- North America46.54%
- Asia Pacific28.14%
- Europe16.62%
- Middle East and Africa5.32%
- Latin America3.39%
Segmentation
Companies profiled
- Corning Incorporated
- Amphenol (CommScope CCS)
- Panduit
- Prysmian
- Belden
- The Siemon Company
- Legrand
- Leviton
- Fujikura (AFL)
- Sumitomo Electric Industries
- Lightera
- US Conec
- Senko Advanced Components
- Huber+Suhner
- Yangtze Optical Fibre and Cable (YOFC)
- Hengtong Group
- STL
Recent developments
Prysmian signed an up to EUR 5.5 billion long-term agreement with Molex to supply optical cables for data centers for up to ten years, and allocated EUR 1.25 billion up to 2031 to expand fiber capacity (Source: Prysmian press release).
CRU launched monthly optical fibre price reporting after its index jumped to 263.0 in March 2026 (Source: CRU).
STL received US Conec certification to offer MMC pre-terminated solutions for AI data centers (Source: STL press release).
Corning reported 2025 Optical Communications sales of USD 6.27 billion, up 35% (Source: Corning results, as reported by Converge Digest).
Corning and Meta announced a multiyear agreement of up to USD 6 billion for optical fiber, cable and connectivity (Source: Corning press release).
Amphenol completed the acquisition of the CCS business from CommScope (Source: Amphenol press release).
Full analysis
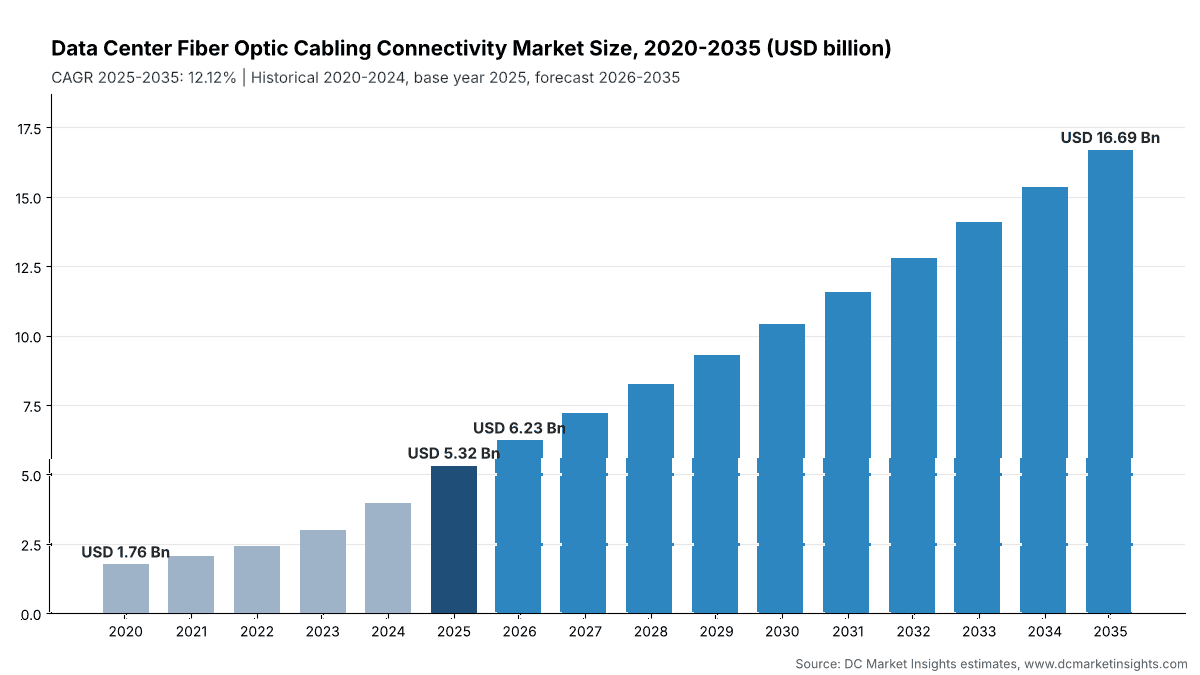
The Data Center Fiber Optic Cabling Connectivity Market is valued at USD 6.23 billion in 2026 and is projected to reach USD 16.69 billion by 2035, up from USD 5.32 billion in 2025, a CAGR of 12.12% from 2025 to 2035 (DC Market Insights estimate). The market covers the passive fiber optic cabling and connectivity installed inside data center buildings and campuses: trunk, backbone and distribution cable, pre-terminated assemblies and patch cords, fiber enclosures, cassettes, panels and adapters, and fiber pathway and management hardware. The 2025 build receipt is 12,000 megawatts (MW) of new IT capacity, of which 7,800 MW of conventional halls x USD 0.211 million of fiber cabling per MW = USD 1.64 billion and 4,200 MW of artificial intelligence (AI) halls x USD 0.681 million per MW = USD 2.86 billion, plus USD 814.27 million of moves, adds and changes on the installed base. Very small form factor (VSFF) connectors are the fastest-growing segment at 32.40% a year because they fit up to three times the fibers of a multi-fiber push-on (MPO) connector in the same space, and the Middle East and Africa is the fastest-growing region at 15.83% a year as Gulf AI campuses are built. This market is the fiber half of the Data Center Cables Market.
Key Market Statistics: How Big Is the Data Center Fiber Optic Cabling Connectivity Market in 2026?
DC Market Insights values the Data Center Fiber Optic Cabling Connectivity Market at USD 6.23 billion in 2026, 17.08% above the USD 5.32 billion of 2025, as AI halls that need more than ten times the fiber of a conventional hall take a larger share of new capacity.
- Market size 2025: USD 5.32 billion
- Market size 2026: USD 6.23 billion
- Market size 2030: USD 10.42 billion
- Market size 2035: USD 16.69 billion
- CAGR 2025-2035: 12.12% (low case 10.10%, high case 14.01%)
- Largest component: Pre-Terminated Assemblies and Patch Cords, 51.81% of 2025 revenue
- Fastest segment: VSFF connectors, 32.40% a year
- Fastest network segment: AI Back-End Fabric, 16.14% a year
- Fastest buyer type: GPU and Neocloud providers, 15.03% a year
- Leading region: North America, 46.54% of 2025 revenue; fastest-growing region: Middle East and Africa, 15.83%
- Largest country: United States, 41.98% of 2025 revenue
- Market leader: Corning, about 26% of 2025 revenue (DC Market Insights assessment)
Executive Summary: How Large Was the Data Center Fiber Optic Cabling Connectivity Market in 2025?
Data center operators spent USD 5.32 billion on fiber optic cabling and connectivity in 2025. The Global Data Center Fiber Optic Cabling Connectivity Market size was valued at USD 1.76 billion in 2020, reached USD 5.32 billion in 2025, and is anticipated to reach USD 16.69 billion by 2035, at a CAGR of 12.12% during the forecast period. Between 2020 and 2025 the market grew 24.77% a year, and 2025 alone added 33.4% as graphics processing unit (GPU) clusters moved from pilots to campus-scale halls.
| Report attribute | Details |
|---|---|
| Historical Period | 2020-2024 |
| Base Year | 2025 |
| Forecast Period | 2026-2035 |
| Data Center Fiber Optic Cabling Connectivity Market Size 2025 | USD 5.32 billion |
| Data Center Fiber Optic Cabling Connectivity Market Size 2026 | USD 6.23 billion |
| Data Center Fiber Optic Cabling Connectivity Market CAGR (2025-2035) | 12.12% |
| Data Center Fiber Optic Cabling Connectivity Market Size 2035 | USD 16.69 billion |
Growth slows after 2025 for one reason: fiber dollars per AI MW fall as racks get denser. A 132 kilowatt (kW) AI rack puts more compute behind each trunk than a 40 kW rack, so content per AI MW drifts down from USD 0.681 million in 2025 to USD 0.605 million by 2035, while content per conventional MW rises from USD 0.211 million to USD 0.249 million as minimum fiber counts rise. New IT capacity still climbs from 12,000 MW in 2025 to 27,000 MW in 2035. Global investment in data centers is expected to reach USD 580 billion in 2025 (Source: IEA World Energy Outlook 2025), and this market is close to 0.92% of it.
Key takeaways:
- USD 5.32 billion in 2025, USD 6.23 billion in 2026 and USD 16.69 billion by 2035, a 12.12% CAGR.
- Pre-terminated assemblies and patch cords are the largest component at 51.81% because AI halls are cabled with factory-tested MPO trunks rather than field splicing.
- Single-mode fiber passes multimode in 2025 at 52.15% of revenue and reaches 67.44% by 2035.
- North America takes 46.54% of 2025 revenue; the Middle East and Africa grows fastest at 15.83%.
- Corning says AI data centers require over 10 times more fiber than traditional data centers (Source: Corning, August 2025).
Market Scope: What Does the Data Center Fiber Optic Cabling Connectivity Market Cover?
The Data Center Fiber Optic Cabling Connectivity Market is the annual factory revenue from passive fiber optic cabling and connectivity sold for use inside data centers worldwide, USD 5.32 billion in 2025 across about 116,000 MW of installed IT capacity (DC Market Insights estimate).
Included. Single-mode and multimode (OM3, OM4 and OM5) fiber cable for trunks, backbones and campus links between halls on the same site; factory-terminated MPO and MTP (US Conec’s branded MPO connector) trunks, harnesses and fan-outs; LC duplex and VSFF patch cords (MMC, SN (Senko’s very small form factor connector) and CS types); rack-mount fiber enclosures, cassettes, adapter panels and splice trays; overhead fiber raceway, slack storage and labeling.
Excluded. Pluggable optical transceivers and active optical cables, which are sized in the Optical Transceiver Market report; copper and power cables; metro, long-haul and subsea fiber outside the campus; switches and servers; and installation labor.
How the segments fit together. Every split in this report sums to the same total: four components, two fiber types, four connector types, three network segments, four data center types and five regions. In 2025 fiber optic cable and pre-terminated assemblies together are worth USD 4.58 billion, close to the structured fiber cabling line of the Data Center Cables Market report; enclosures, cassettes and pathway hardware add the rest.
Why Do Data Center Fiber Optic Cabling Connectivity Market Estimates Differ?
DC Market Insights values the Data Center Fiber Optic Cabling Connectivity Market at USD 6.23 billion in 2026, and published estimates differ mainly because some include transceivers, active optical cables or outside plant fiber, while this report counts only passive fiber cabling and connectivity inside the data center.
| Element | In this report | Why |
|---|---|---|
| Fiber cabling in new halls | Yes, USD 4.50 billion (2025) | New IT MW x fiber content per MW |
| Moves, adds, changes and upgrades on installed halls | Yes, USD 814.27 million (2025) | Re-cabling for each new switch generation |
| Pluggable transceivers and active optical cables | No | Active optics, sized in the Optical Transceiver Market report |
| Metro, long-haul and dark fiber between sites | No | Outside plant, covered in the Dark Fiber Market and Data Center Interconnect Market reports |
| Copper and power cables | No | Covered in the Data Center Cables Market report |
Market Drivers: What Drives the Data Center Fiber Optic Cabling Connectivity Market?
Three drivers lift the Data Center Fiber Optic Cabling Connectivity Market from USD 5.32 billion in 2025 to USD 16.69 billion by 2035: AI halls that carry several times the fiber of a conventional hall, a doubling of yearly capacity additions, and multiyear supply contracts that lock in volume.
AI halls need more than ten times the fiber
A GPU training cluster links every accelerator to every other through a back-end fabric, so a hall of the same power rating needs far more fiber than a cloud hall. Corning states that AI data centers require over 10 times more fiber compared to traditional data centers (Source: Corning, August 2025). Fiber cabling content is USD 0.681 million per AI MW in 2025 against USD 0.211 million per conventional MW. Both are DC Market Insights estimates. The AI share of new capacity rises from 35% in 2025 to 66% by 2035. AI halls already account for 53.81% of 2025 revenue. The accelerators behind those fabrics are sized in the Data Center GPUs Market report.
New capacity rises from 12,000 MW to 27,000 MW a year
Fiber cabling is a build market first: new halls took 84.69% of 2025 revenue. DC Market Insights models new IT capacity of 12,000 MW in 2025, 19,400 MW in 2030 and 27,000 MW in 2035, which lifts the installed base from about 116,000 MW to 314,368 MW (DC Market Insights Capacity model). Each switch generation from 400 gigabits per second (Gb/s) to 800G and 1.6 terabits per second (Tb/s) also forces partial re-cabling of installed halls, so moves, adds and changes grow 16.13% a year.
Multiyear supply contracts lock in fiber volume
Buyers now reserve fiber before they secure sites. In January 2026, Corning and Meta announced a multiyear agreement of up to USD 6 billion for optical fiber, cable and connectivity products, with Meta as anchor customer for a capacity expansion at Corning’s optical cable plant in Hickory, North Carolina (Source: Corning press release). In July 2026, Prysmian signed a long-term agreement of up to EUR 5.5 billion, including a EUR 550 million upfront payment, to supply optical cables to Molex for up to ten years (Source: Prysmian press release, July 2026). Contracts of this size turn forecast demand into committed volume.
Market Trends: How Is Data Center Fiber Cabling Changing?
Three trends move the Data Center Fiber Optic Cabling Connectivity Market: VSFF connectors growing 32.40% a year, single-mode fiber rising to 67.44% of revenue by 2035, and factory-terminated assemblies replacing field work.
VSFF connectors replace MPO in AI halls
The MMC connector carries 16 to 32 fibers and offers up to three times the density of traditional MPO connectors in the same footprint, at nearly half the connector size (Source: Corning MMC product page, October 2026). In May 2026, STL (Sterlite Technologies) received US Conec certification to make MMC pre-terminated assemblies for AI data center deployments, citing three times the cabling capacity of MPO connectors (Source: STL press release, May 2026). VSFF connectors are the fastest-growing connector type at 32.40% a year and rise from 6.60% of revenue in 2025 to 34.84% by 2035 (DC Market Insights estimate).
Single-mode fiber takes over the AI fabric
The Institute of Electrical and Electronics Engineers (IEEE) P802.3dj project sets objectives for 800 Gb/s Ethernet over 4 pairs and 1.6 Tb/s over 8 pairs of single-mode fiber (SMF) at lengths of at least 500 metres and 2 kilometres (Source: IEEE P802.3dj objectives, March 2024). Each 1.6 Tb/s link therefore needs 16 fibers, which fits 16-fiber MPO and MMC trunks. Single-mode fiber grows 15.04% a year against 7.88% for multimode, which keeps the short links inside enterprise and colocation rows.
Factory-terminated assemblies replace field splicing
Pre-terminated assemblies and patch cords grow 13.68% a year, faster than bare fiber optic cable at 10.19%, because a 100 MW AI hall must be cabled in weeks and factory-tested MPO trunks remove splicing from the critical path. Amphenol completed its purchase of the Connectivity and Cable Solutions (CCS) business of CommScope in January 2026, which adds significant fiber optic interconnect capabilities, and expects about USD 4.1 billion of CCS sales in 2026 (Source: Amphenol press release).
Market Challenges: What Holds the Data Center Fiber Optic Cabling Connectivity Market Back?
Two challenges slow the market: a fiber price index that jumped to 263.0 in March 2026, and fiber content per AI MW that falls about 1.2% a year as racks get denser.
Fiber and preform shortages raise prices
The CRU (CRU Group, a commodity price consultancy) optical fibre price index stabilised in May 2025 after 32 consecutive months of decline, then made an unprecedented triple-digit jump to 263.0 in March 2026 (Source: CRU, May 2026). CRU links US price rises to acute fibre shortages amid growing hyperscaler demand for AI data centers, with domestic glass preform and drawing capacity already at full utilisation. New preform plants take years to build, which is why Prysmian is allocating EUR 1.25 billion up to 2031 to expand fiber capacity (Source: Prysmian press release, July 2026). Price rises lift revenue but delay some enterprise refresh projects.
Denser racks need fewer fiber dollars per MW
DC Market Insights lowers fiber content per AI MW by about 1.2% a year to 2035 because rack power rises faster than fiber count per rack. Co-packaged optics, covered in the Co-Packaged Optics Market report, move optical engines onto the switch package and may shorten some patch links. In the low case, with capacity and AI share 15% below base from 2026, the market reaches USD 13.92 billion in 2035.
Market Opportunities: Where Are the New Revenue Pools?
The two largest new revenue pools are VSFF connectivity for AI back-end fabrics and the GPU and neocloud operators that build them, which grow 32.40% and 15.03% a year.
VSFF trunks and cassettes for AI back-end fabrics
The AI Back-End Fabric segment grows from 36.60% of 2025 revenue to 52.08% by 2035. Suppliers that ship complete, factory-tested kits of MMC or SN trunks, high-density cassettes and slack storage gain most, because operators order whole halls at a time.
GPU and neocloud operators
GPU and neocloud providers hold 11.52% of 2025 revenue and reach 14.89% by 2035. They build fast in leased shells with fiber-heavy fabrics, which suits suppliers with short lead times and local assembly plants.
Pricing: How Much Does Data Center Fiber Cabling Cost per MW?
Fiber optic cabling and connectivity cost about USD 0.211 million per MW of conventional IT capacity and USD 0.681 million per MW of AI capacity in 2025, excluding installation labor. Both values are DC Market Insights estimates.
| Year | Conventional halls (USD million per MW) | AI halls (USD million per MW) | Moves, adds and changes per installed MW a year (USD) | AI share of new MW |
|---|---|---|---|---|
| 2020 | 0.188 | 0.812 | 6,800 | 4% |
| 2025 | 0.211 | 0.681 | 7,983 | 35% |
| 2030 | 0.231 | 0.637 | 10,400 | 50.5% |
| 2035 | 0.249 | 0.605 | 12,400 | 66% |
Public price anchors:
- A Panduit 144-fiber OM4 multimode trunk cable, 30 metres long, lists at USD 9,022 (Source: SHI reseller listing, October 2026).
- An FS (FS.com) FHD high-density 1U rack-mount enclosure for 144 LC fibers lists at USD 74 unloaded (Source: FS product listing, October 2026).
The model’s unit values are DC Market Insights estimates. Content per conventional MW rises about 1.7% a year as minimum fiber counts rise; content per AI MW falls about 1.2% a year because rack power density climbs faster than fiber count.
Standards and Regulation: Which Rules Shape Data Center Fiber Cabling?
Four sets of rules shape data center fiber cabling, led by TIA-942-C of May 2024 and IEEE objectives that carry 1.6 Tb/s on 16 fibers: the TIA-942 data center standard of the Telecommunications Industry Association (TIA), the ISO/IEC 11801 cabling family, Ethernet physical-layer standards and fire-performance codes.
TIA-942-C. The ANSI/TIA-942-C Telecommunications Infrastructure Standard for Data Centers was published in May 2024 and covers telecommunications, power, cooling and architecture, with new considerations for new technologies, sustainability and best practice (Source: TIA). Designs that follow it set the topology and minimum media for new halls.
ISO/IEC 11801-5. The international counterpart sets data center cabling topology and minimum performance classes.
IEEE 802.3. Each new Ethernet speed fixes the number of fibers per link and the reach of multimode fiber. The P802.3dj objectives for 1.6 Tb/s over 8 pairs of single-mode fiber push AI fabrics to 16-fiber connectivity (Source: IEEE P802.3dj objectives, March 2024).
Fire performance. The EU Construction Products Regulation classes cables by Euroclass reaction to fire, and in the United States the National Electrical Code (NFPA 70) sets plenum and riser ratings. Higher classes add cost per metre and favor suppliers with certified low-smoke zero-halogen jackets.
Market Segmentation: Which Segment Leads the Data Center Fiber Optic Cabling Connectivity Market?
Pre-terminated assemblies and patch cords lead the Data Center Fiber Optic Cabling Connectivity Market with 51.81% of 2025 revenue, and VSFF connectors are the fastest-growing segment at 32.40% a year to 2035 (DC Market Insights estimate).
By Component: Pre-Terminated Assemblies Lead
Factory-terminated trunks, harnesses and patch cords carry more value per metre than bulk cable and grow fastest as AI halls are cabled in kits.
| Component | 2025 (USD million) | Share 2025 | 2035 (USD million) | CAGR 2025-2035 |
|---|---|---|---|---|
| Pre-Terminated Assemblies and Patch Cords | 2,755.91 | 51.81% | 9,936.37 | 13.68% |
| Fiber Optic Cable | 1,820.98 | 34.24% | 4,804.10 | 10.19% |
| Connectivity Hardware | 516.85 | 9.72% | 1,371.77 | 10.25% |
| Fiber Pathway and Management | 225.09 | 4.23% | 577.89 | 9.89% |
By Fiber Type: Single-Mode Leads
Single-mode fiber leads because AI fabrics and backbones run 800G and 1.6T links over single-mode; multimode keeps short links in enterprise and colocation rows.
| Fiber type | 2025 (USD million) | Share 2025 | 2035 (USD million) | CAGR 2025-2035 |
|---|---|---|---|---|
| Single-Mode | 2,773.87 | 52.15% | 11,256.25 | 15.04% |
| Multimode | 2,544.96 | 47.85% | 5,433.88 | 7.88% |
By Connector Type: MPO/MTP Leads
MPO and MTP connectors terminate most trunks today, while VSFF connectors gain share fastest in new AI halls.
| Connector type | 2025 (USD million) | Share 2025 | 2035 (USD million) | CAGR 2025-2035 |
|---|---|---|---|---|
| MPO/MTP | 2,887.07 | 54.28% | 7,369.07 | 9.82% |
| LC Duplex | 1,633.04 | 30.70% | 2,881.85 | 5.84% |
| Other Connectors | 447.44 | 8.41% | 624.51 | 3.39% |
| Very Small Form Factor (VSFF) | 351.28 | 6.60% | 5,814.71 | 32.40% |
By Network Segment: Front-End and Storage Network Leads
The front-end and storage network still carries the most fiber in 2025, but the AI back-end fabric overtakes it before 2030.
| Network segment | 2025 (USD million) | Share 2025 | 2035 (USD million) | CAGR 2025-2035 |
|---|---|---|---|---|
| Front-End and Storage Network | 2,140.53 | 40.24% | 4,751.23 | 8.30% |
| AI Back-End Fabric | 1,946.50 | 36.60% | 8,692.26 | 16.14% |
| Backbone and Campus Interconnect | 1,231.79 | 23.16% | 3,246.64 | 10.18% |
By Data Center Type: Hyperscale Leads
Hyperscale operators buy the most fiber; GPU and neocloud providers grow fastest; enterprise data centers grow slowest as workloads move to cloud and colocation.
| Data center type | 2025 (USD million) | Share 2025 | 2035 (USD million) | CAGR 2025-2035 |
|---|---|---|---|---|
| Hyperscale | 2,528.64 | 47.54% | 8,803.29 | 13.29% |
| Colocation | 1,383.58 | 26.01% | 4,022.95 | 11.26% |
| Enterprise | 793.75 | 14.92% | 1,378.16 | 5.67% |
| GPU and Neocloud | 612.85 | 11.52% | 2,485.73 | 15.03% |
DC Exclusive: The Fiber Content per MW Model and Data Center Type x Component Matrix
The largest cell of the market is hyperscale pre-terminated assemblies and patch cords, 24.91% of 2025 revenue. This is a DC Market Insights model built from 15 inputs (new IT MW by year, installed MW, AI share of new MW, four content values per MW for each of conventional and AI halls, four refresh rates and the Panduit and FS price anchors) and tested against 3 bound checks, listed under Methodology.
| Hall type (2025) | Rack power | Typical fiber links | Content per MW |
|---|---|---|---|
| Conventional hall | About 9 kW | Duplex LC and 12-fiber MPO to top-of-rack switches | USD 0.211 million |
| AI hall | 60 kW average, up to 132 kW | 16-fiber MPO or MMC trunks per GPU node, plus front-end and storage | USD 0.681 million |
The matrix below splits the 2025 market by data center type and component in USD million; rows and columns sum to the totals above.
| Data center type (USD million, 2025) | Fiber Optic Cable | Pre-Terminated Assemblies and Patch Cords | Connectivity Hardware | Fiber Pathway and Management | Total |
|---|---|---|---|---|---|
| Hyperscale | 861.86 | 1,324.72 | 238.01 | 104.05 | 2,528.64 |
| Colocation | 477.95 | 706.76 | 138.63 | 60.23 | 1,383.58 |
| Enterprise | 278.38 | 389.66 | 87.93 | 37.78 | 793.75 |
| GPU and Neocloud | 202.78 | 334.77 | 52.28 | 23.03 | 612.85 |
| Total | 1,820.98 | 2,755.91 | 516.85 | 225.09 | 5,318.83 |
Hyperscale and GPU and neocloud buyers spend more than half of their fiber budget on pre-terminated assemblies, while enterprise buyers spend a larger share on bulk cable and connectivity hardware because they still splice and patch on site. The model and its assumptions are explained on the research methodology page linked under Methodology.
Regional Insights: Which Region Leads the Data Center Fiber Optic Cabling Connectivity Market?
North America leads with 46.54% of 2025 revenue, and the Middle East and Africa is the fastest-growing region at 15.83% a year because Saudi Arabia and the United Arab Emirates are building gigawatt-scale AI campuses from a small base.
| Region | 2025 (USD million) | Share 2025 | 2035 (USD million) | CAGR 2025-2035 |
|---|---|---|---|---|
| North America | 2,475.24 | 46.54% | 7,074.47 | 11.07% |
| Asia Pacific | 1,496.84 | 28.14% | 5,119.57 | 13.09% |
| Europe | 883.94 | 16.62% | 2,564.13 | 11.24% |
| Middle East and Africa | 282.72 | 5.32% | 1,229.54 | 15.83% |
| Latin America | 180.09 | 3.39% | 702.42 | 14.58% |
North America Leads with 46.54% Share
North America grows 11.07% a year. Most AI capacity is built in the United States, and both of the largest fiber supply deals of 2026, Corning with Meta and Prysmian with Molex, come with US plant expansions; Molex says the Prysmian deal doubles Prysmian’s domestic fiber capacity and creates over 1,000 jobs (Source: Molex press release).
Asia Pacific Holds 28.14% Share
Asia Pacific grows 13.09% a year, led by China, Japan, India and Australia. China makes most of the world’s preform and bare fiber, and India is the fastest-growing large country at 17.70% a year as hyperscale campuses expand in Mumbai and Chennai.
Europe Holds 16.62% Share
Europe grows 11.24% a year. Grid connection queues in Frankfurt, London, Amsterdam and Dublin cap new builds, while Construction Products Regulation fire classes raise the value of each metre installed.
Middle East and Africa Holds 5.32% Share
The Middle East and Africa is the fastest-growing region at 15.83% a year, because sovereign AI programs in Saudi Arabia and the United Arab Emirates are adding campus-scale AI halls that are cabled almost entirely in single-mode fiber.
Latin America Holds 3.39% Share
Latin America grows 14.58% a year, led by São Paulo, Querétaro and Santiago, where colocation operators buy most fiber connectivity.
Country Analysis: Which Countries Spend the Most on Data Center Fiber Cabling?
The United States leads with 41.98% of 2025 revenue, and India is the fastest-growing country in the top 12 at 17.70% a year. The 12 countries below hold 79.82% of 2025 revenue (DC Market Insights estimate).
| Rank | Country | Region | 2025 (USD million) | Share 2025 | 2035 (USD million) | CAGR 2025-2035 |
|---|---|---|---|---|---|---|
| 1 | United States | North America | 2,232.67 | 41.98% | 6,289.20 | 10.91% |
| 2 | China | Asia Pacific | 502.94 | 9.46% | 1,540.99 | 11.85% |
| 3 | Canada | North America | 242.57 | 4.56% | 785.27 | 12.46% |
| 4 | Japan | Asia Pacific | 214.05 | 4.02% | 624.59 | 11.30% |
| 5 | Germany | Europe | 189.16 | 3.56% | 533.34 | 10.92% |
| 6 | United Kingdom | Europe | 179.44 | 3.37% | 479.49 | 10.33% |
| 7 | India | Asia Pacific | 176.63 | 3.32% | 901.04 | 17.70% |
| 8 | Australia | Asia Pacific | 133.22 | 2.50% | 481.24 | 13.71% |
| 9 | Malaysia | Asia Pacific | 106.28 | 2.00% | 445.40 | 15.41% |
| 10 | France | Europe | 96.35 | 1.81% | 292.31 | 11.74% |
| 11 | Singapore | Asia Pacific | 94.30 | 1.77% | 250.86 | 10.28% |
| 12 | Netherlands | Europe | 77.79 | 1.46% | 207.69 | 10.32% |
Outside the top 12, Saudi Arabia holds 1.42% of 2025 revenue and grows 17.23% a year, and Brazil holds 1.36%. India moves up the table by 2035 because its new capacity grows faster than any other large market. The country figures allocate each regional total by each country’s share of installed and new data center capacity.
Forecast Scenarios: How Could the 2035 Forecast Change?
The 2035 Data Center Fiber Optic Cabling Connectivity Market ranges from USD 13.92 billion to USD 19.74 billion around a base case of USD 16.69 billion, depending on how fast new capacity is built and how much of it is built for AI.
| Scenario | Assumption from 2026 | 2035 value | CAGR 2025-2035 |
|---|---|---|---|
| Low | New capacity and AI share 15% below base (grid limits, slower AI spending) | USD 13.92 billion | 10.10% |
| Base | 27,000 MW of new IT in 2035; AI share 66% of new MW | USD 16.69 billion | 12.12% |
| High | New capacity and AI share 15% above base | USD 19.74 billion | 14.01% |
The low case is what a two-year pause in AI capital spending looks like. The high case assumes grid connections and preform capacity keep pace with announced hyperscale plans. Co-packaged optics are the main technical swing factor: they change the connector mix more than the total.
Competitive Insights: Who Leads the Data Center Fiber Optic Cabling Connectivity Market?
Corning leads with about 26% of 2025 revenue, and the three largest suppliers (Corning, Amphenol and Panduit) hold about 45% (DC Market Insights assessment).
- Corning Incorporated
- Amphenol (CommScope CCS)
- Panduit
- Prysmian
- Belden
- The Siemon Company
- Legrand
- Leviton
- Fujikura (AFL)
- Sumitomo Electric Industries
- Lightera
- US Conec
- Senko Advanced Components
- Huber+Suhner
- Yangtze Optical Fibre and Cable (YOFC)
- Hengtong Group
- STL
Corning’s advantage is scale in glass, cable and connectivity: its Optical Communications segment sold USD 6.27 billion in 2025, up 35%, and enterprise optical sales, which capture sales inside the data center, were a little over USD 3 billion, about two-thirds of it to hyperscalers (Source: Corning fourth-quarter 2025 results, as reported by Converge Digest, January 2026). Amphenol gained the CommScope fiber connectivity range in January 2026 (Source: Amphenol press release). Panduit, Siemon, Leviton, Legrand and Belden compete on structured cabling systems in colocation and enterprise halls; Prysmian, Fujikura, Sumitomo, YOFC and Hengtong compete on fiber and high-count cable; and US Conec and Senko design the MPO, MMC and SN connectors that others license.
Recent Developments
Six developments since January 2026 show suppliers adding fiber capacity, led by Prysmian’s agreement of up to EUR 5.5 billion with Molex in July 2026.
- In July 2026, Prysmian signed an up to EUR 5.5 billion long-term agreement with Molex to supply optical cables for data centers for up to ten years, and allocated EUR 1.25 billion up to 2031 to expand fiber capacity (Source: Prysmian press release).
- In May 2026, CRU launched monthly optical fibre price reporting after its index jumped to 263.0 in March 2026 (Source: CRU).
- In May 2026, STL received US Conec certification to offer MMC pre-terminated solutions for AI data centers (Source: STL press release).
- In January 2026, Corning reported 2025 Optical Communications sales of USD 6.27 billion, up 35% (Source: Corning results, as reported by Converge Digest).
- In January 2026, Corning and Meta announced a multiyear agreement of up to USD 6 billion for optical fiber, cable and connectivity (Source: Corning press release).
- In January 2026, Amphenol completed the acquisition of the CCS business from CommScope (Source: Amphenol press release).
We follow these deals and launches in our data center industry updates; links between sites are covered in the Data Center Interconnect Market report.
Methodology: How We Built the Data Center Fiber Optic Cabling Connectivity Market Model
The model is built bottom-up: 2025 = USD 1.64 billion for conventional halls + USD 2.86 billion for AI halls + USD 814.27 million for installed-base work = USD 5.32 billion. It multiplies new IT capacity by fiber cabling content per MW and adds moves, adds and changes on the installed base. New IT capacity is 6,200 MW in 2020, 12,000 MW in 2025, 19,400 MW in 2030 and 27,000 MW in 2035; installed capacity is 70,500 MW in 2020, 116,000 MW in 2025, 207,091 MW in 2030 and 314,368 MW in 2035, in line with the DC Market Insights Capacity model. The AI share of new MW rises from 4% in 2020 and 35% in 2025 to 66% in 2035. Content per MW is USD 0.188 million (2020), 0.211 (2025), 0.231 (2030) and 0.249 (2035) for conventional halls and 0.812, 0.681, 0.637 and 0.605 for AI halls; moves, adds and changes run at USD 6,800 to USD 12,400 per installed MW a year. Segment shares are set separately for new conventional, new AI and installed-base demand, so every split sums to the total.
Three bound checks:
- Ceiling 1: USD 5.32 billion is 0.92% of the USD 580 billion the world invests in data centers in 2025 (Source: IEA World Energy Outlook 2025).
- Ceiling 2: Corning’s estimated share of about 26% implies about USD 1.38 billion of data center fiber cabling revenue, below its enterprise optical sales of a little over USD 3 billion, which also include non data center enterprise sales (Source: Corning 2025 results).
- Floor: 4,200 MW of new AI halls x 12 trunks of 144 fibers per MW x USD 9,022 per trunk gives USD 454.71 million, below the model’s USD 2.86 billion for new AI halls (Source: SHI listing).
Full approach: DC Market Insights research methodology. The analyst named on this page built the model, and the reviewer checked the arithmetic, the sources and the dates before publication.
Table of contents
- 01Introduction
- 1.1Market Definition and Scope
- 1.2Research Methodology
- 1.3Key Market Statistics
- 02Executive Summary
- 2.1Market Size 2020-2035
- 2.2Key Takeaways
- 03Market Scope and Estimate Comparison
- 3.1Included and Excluded
- 3.2Why Estimates Differ
- 04Market Dynamics
- 4.1Market Drivers
- 4.2Market Trends
- 4.3Market Challenges
- 4.4Market Opportunities
- 05Pricing Analysis
- 5.1Fiber Cabling Content per MW, 2020-2035
- 5.2Public Price Anchors
- 06Standards and Regulation
- 6.1TIA-942-C
- 6.2ISO/IEC 11801-5
- 6.3IEEE 802.3
- 6.4Fire Performance
- 07Market Segmentation
- 7.1By Component
- 7.2By Fiber Type
- 7.3By Connector Type
- 7.4By Network Segment
- 7.5By Data Center Type
- 08DC Exclusive
- 8.1Fiber Content per MW Model
- 8.2Data Center Type x Component Matrix
- 09Regional Insights
- 9.1North America
- 9.2Asia Pacific
- 9.3Europe
- 9.4Middle East and Africa
- 9.5Latin America
- 10Country Analysis
- 10.1Top 12 Countries
- 11Forecast Scenarios
- 11.1Low, Base and High Cases
- 12Competitive Landscape
- 12.1Company List
- 12.2Market Share and Advantages
- 13Recent Developments
- Fig. 1Data Center Fiber Optic Cabling Connectivity Market Size, 2020-2035
- Table 1Report Attributes
- Table 2Scope Comparison
- Table 3Fiber Cabling Content per MW
- Table 4Segment Tables
- Table 5Fiber Content per MW Model
- Table 6Data Center Type x Component Matrix
- Table 7Regional Split
- Table 8Top 12 Countries
- Table 9Forecast Scenarios
About this report
Written by Amit Jain and reviewed by Deepti Agrawal, Senior Editor, Research. Figures are built top-down and bottom-up and reconciled before publication, with 2025 as the base year.
Read our methodologyHow we built this
- Historical period2020-2024
- Base year2025
- Forecast period2026-2035
- Sizing approachTop-down + bottom-up
Need more than the report?
Advisory on this market
Due diligence, site selection and market entry work, by the analysts who wrote this report.
See consulting servicesFrequently asked questions
USD 6.23 billion in 2026, up 17.08% from USD 5.32 billion in 2025, according to DC Market Insights estimates. The market is projected to reach USD 16.69 billion by 2035, a CAGR of 12.12% from 2025 to 2035.
USD 5.32 billion in 2025 and USD 16.69 billion by 2035 (DC Market Insights estimate), after USD 1.76 billion in 2020. The 2025 figure covers fiber cabling for 12,000 MW of new IT capacity plus work on the installed base.
12.12% a year from 2025 to 2035 (DC Market Insights estimate), slower than the 24.77% of 2020-2025 because fiber dollars per AI MW fall as racks get denser.
USD 5.32 billion of 2025 revenue from passive fiber optic cabling and connectivity inside data centers: fiber cable, pre-terminated assemblies and patch cords, enclosures, cassettes and panels, and fiber pathway. Transceivers and active optical cables are excluded.
Pre-terminated assemblies and patch cords, with 51.81% of 2025 revenue, because AI halls are cabled with factory-tested MPO trunks (DC Market Insights estimate).
VSFF connectors such as MMC and SN, at 32.40% a year to 2035 (DC Market Insights estimate), because they fit up to three times the fibers of an MPO connector in the same space.
About USD 0.211 million per conventional MW and USD 0.681 million per AI MW in 2025, excluding labor. Both are DC Market Insights estimates. A Panduit 144-fiber OM4 trunk of 30 metres lists at USD 9,022.
North America, with 46.54% of 2025 revenue. The Middle East and Africa is the fastest-growing region at 15.83% a year as Gulf AI campuses are built (DC Market Insights estimate).
Corning leads with about 26% of 2025 revenue, and Corning, Amphenol and Panduit together hold about 45% (DC Market Insights assessment). Prysmian, Siemon, Legrand, Fujikura and US Conec follow.
Hyperscale, with 47.54% of 2025 revenue. GPU and neocloud providers grow fastest at 15.03% a year (DC Market Insights estimate).
More than ten times the fiber of a traditional data center, according to Corning. Content is USD 0.681 million per AI MW in 2025 against USD 0.211 million per conventional MW. Both are DC Market Insights estimates.
It sets the pace: data center investment reached USD 580 billion in 2025, according to the IEA, and this market is about 0.92% of it. Suppliers are consolidating and adding capacity, as the Amphenol purchase of CommScope CCS and Prysmian’s EUR 1.25 billion fiber program show.
Licences, delivery and payment
Which licence should I choose?
Single User is a view-only PDF for one person. Multi User adds a printable PDF and the Excel data for unlimited users at one location. Enterprise covers your whole company and includes 100 free analyst hours.
How and when will I receive the report?
By email, within 24–48 business hours of payment, in the formats of your licence.
How can I pay?
Securely through PayPal: with a PayPal account, a debit or credit card, or PayPal Pay Later where available. Prices are in US dollars.
Can I see a sample first?
Yes. Request a free sample and we will email it to you.
Can the report be tailored to my needs?
Yes. We can add countries, segments or data cuts. Talk to an analyst about the scope you need.
Can I get an invoice or pay against a purchase order?
Write to sales@dcmarketinsights.com and our team will help.