
Data Center Interconnect Market Size, Share & Forecast to 2035
Market at a glance
The Data Center Interconnect market was worth USD 12.21 billion in 2025 and is forecast to reach USD 28.14 billion by 2035, growing at a 8.71% CAGR. North America accounts for 44.8% of the market.
 By Amit Jain, Senior Consultant, ICT & Emerging Technologies
 Reviewed by Deepti Agrawal
Last updated 7 Oct 2026
Base year 2025 PDF + Excel
Reviewed by Deepti Agrawal
Last updated 7 Oct 2026
Base year 2025 PDF + Excel
Source: DC Market Insights analysis
Key findings
AI Halls Raise Interconnect Spend per MW to USD 0.78 Million
Line Rates Move from 400G to 800G and 1.6T
Price per Bit Falls Faster Than Spend Rises
GPU and Neocloud Providers Grow Interconnect Spend to USD 3.71 Billion
What is inside the report
- 01Introduction
- 02Research Methodology
- 03Executive Summary
- 04Market Dynamics
- 05Pricing Analysis
- 06Standards and Interoperability
- 07Supply Chain Analysis
- 08Market Size and Forecast
- 09Market by Offering
- 10Market by Data Rate
- 22chapters
- 2020-2024Historical period
- 2026-2035Forecast period
- 14Companies profiled
Regional insights
- North America44.8%
- Asia Pacific29.6%
- Europe17.9%
- Latin America4.1%
- Middle East and Africa3.6%
Segmentation
Companies profiled
- Ciena
- Nokia
- Cisco
- Huawei
- Juniper Networks
- Arista Networks
- Marvell Technology
- ZTE
- Adtran
- Lumentum
- Coherent
- Ribbon Communications
- NEC
- FiberHome
Recent developments
Zayo announced the construction of more than 5,000 new long-haul fiber route miles over five years to meet AI and data center demand (Source: Zayo press release).
Nokia completed its acquisition of Infinera, expanding its presence in the webscale segment (Source: Nokia press release).
Ciena agreed to acquire Nubis Communications for USD 270 million in cash to add low-power optical and electrical interconnects for AI workloads inside the data center (Source: Ciena announcement).
Marvell presented its COLORZ 800 family of 800G ZR and ZR+ coherent pluggable modules, which support transmission up to 2,000 km between distributed AI clusters (Source: Marvell press release).
Marvell introduced the COLORZ 1600 1.6T ZR and ZR+ pluggable for campus, metro and regional links, with sampling expected in the second half of 2026 (Source: Marvell announcement).
Ciena reported that cloud provider revenue reached 46% of its total, up 70%, and that DCI including scale-across is gaining momentum (Source: Ciena SEC filing).
Full analysis
The Data Center Interconnect Market covers the optical transport systems, coherent pluggable optics, packet routing and switching ports, software and services that link data centers to each other across a campus, a metro area or a region, known as data center interconnect (DCI). DC Market Insights values the global Data Center Interconnect Market at USD 12.21 billion in 2025 and forecasts USD 28.14 billion by 2035, a CAGR of 8.71%. The 2025 value is built from two blocks: about 12.0 GW of new data center IT capacity at roughly USD 0.24 million of interconnect spend per MW for conventional halls and USD 0.78 million per MW for AI halls gives USD 5.15 billion of new-build spend, and bandwidth upgrades on an installed base of about 115 GW at USD 0.06 million per MW add USD 7.06 billion. Coherent pluggable optics are the fastest-growing offering at 13.32% a year because 800G and 1.6T ZR and ZR+ modules (coherent pluggable interface classes defined by the Optical Internetworking Forum and the OpenZR+ group) plug straight into routers and switches, and the Middle East and Africa is the fastest-growing region at 12.34% a year as DC Market Insights expects new sovereign AI campuses in the Gulf to be linked to each other and to cloud regions.
Executive Summary
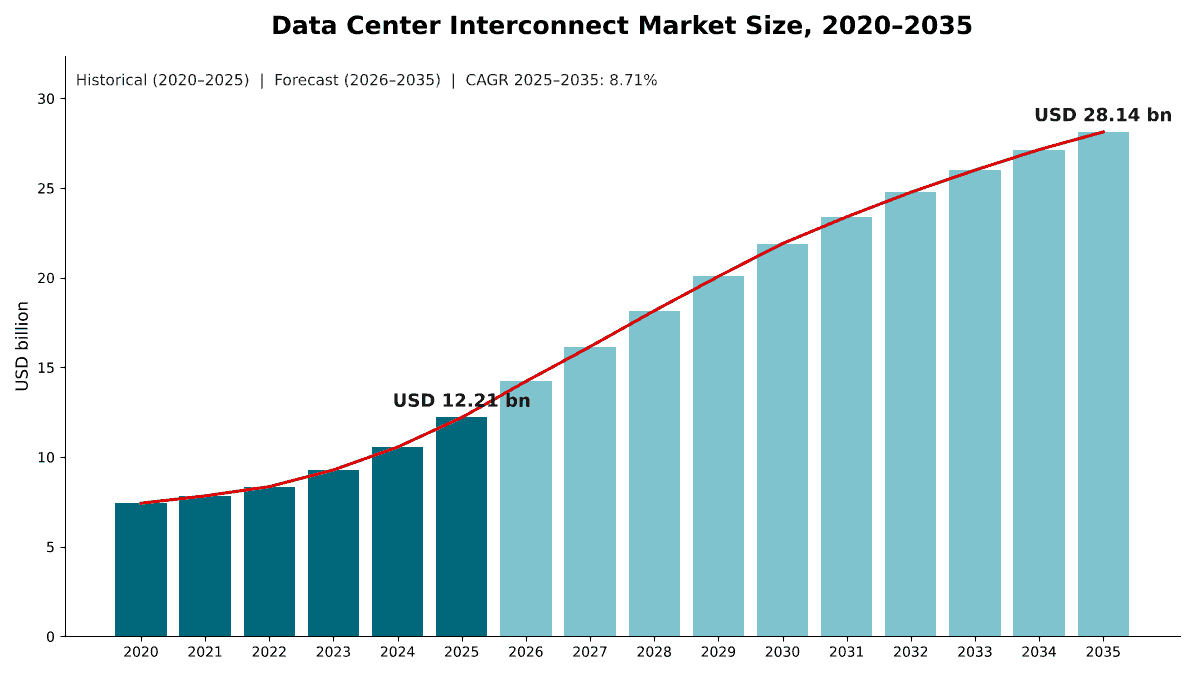
The Global Data Center Interconnect Market size was valued at USD 7.43 billion in 2020, reached USD 12.21 billion in 2025, and is anticipated to reach USD 28.14 billion by 2035, at a CAGR of 8.71% during the forecast period.
| Report attribute | Details |
|---|---|
| Historical Period | 2020-2024 |
| Base Year | 2025 |
| Forecast Period | 2026-2035 |
| Data Center Interconnect Market Size 2025 | USD 12.21 Billion |
| Data Center Interconnect Market, CAGR | 8.71% |
| Data Center Interconnect Market Size 2035 | USD 28.14 Billion |
The market grew at 10.45% a year between 2020 and 2025, and 2025 alone added 15.6% over 2024 as hyperscalers began to link separate AI campuses into single training systems. DC Market Insights forecasts growth of 16.5% in 2026, slowing to 8.71% a year on average across 2025 to 2035 because DC Market Insights assumes the cost of each transported bit keeps falling as coherent generations move from 400G to 800G and 1.6T per wavelength.
Spending is moving from the classic metro pair of data centers toward multi-site AI clusters. DC Market Insights estimates that distributed AI training, often called scale-across, took 17.2% of interconnect spending in 2025 and reaches 34.1% by 2035. Supplier results point the same way: Ciena reported fiscal 2025 revenue of USD 4.77 billion, up 19%, and raised its fiscal 2026 revenue guidance to USD 6.42 billion, a 35% increase at the midpoint (Source: Ciena filing with the US Securities and Exchange Commission).
Market Scope: What Does the Data Center Interconnect Market Cover?
The Data Center Interconnect Market covers the equipment, software and services bought to move traffic between two or more data center buildings, valued at first sale in current US dollars, with 2025 as the base year and forecasts to 2035. DC Market Insights sizes it at USD 12.21 billion in 2025.
Included. Optical DCI systems (compact modular transponders, muxponders and open line systems with their amplifiers and wavelength multiplexers), coherent pluggable optics sold for links between sites (400ZR, OpenZR+, 800ZR, 800G ZR+ and 1.6T modules), router and switch ports dedicated to inter-site links, network management, automation and planning software, and installation, maintenance and managed services tied to that equipment. The reach runs from campus links of under 20 km to regional and long-haul links of more than 1,000 km.
Excluded. Optical transceivers used inside a single data center hall (covered in the Optical Transceiver Market report), structured cabling inside buildings, dark fiber leases, wavelength and Ethernet connectivity services sold by carriers, colocation cross-connect fees, subsea cable systems and civil works for new fiber routes.
How the segments fit together. The offering, data rate, reach, application and end-user splits each re-cut the same USD 12.21 billion, so every split sums to the market total. Data rate is measured by the line rate of the wavelength or port that carries the traffic, not by the client-side interface.
Market Drivers: What Drives the Data Center Interconnect Market?
Three drivers explain most of the growth in the Data Center Interconnect Market: AI halls that need about three times more interconnect spend per MW than conventional halls, hyperscalers stretching single AI clusters across several campuses, and supplier order books that have moved toward cloud buyers.
AI Halls Raise Interconnect Spend per MW to USD 0.78 Million
An AI campus generates far more east-west traffic between buildings than a cloud campus of the same power rating, because checkpoints, training data and model weights move between clusters. DC Market Insights estimates interconnect spend at USD 0.78 million per MW for an AI hall in 2025, against USD 0.24 million per MW for a conventional hall. AI halls took about 35% of new capacity in 2025, and DC Market Insights forecasts 60% in 2030 and 66% in 2035. On those assumptions, new-build interconnect spend rises from USD 5.15 billion in 2025 to USD 11.97 billion in 2030.
Scale-Across Turns Separate Campuses into One AI System
Microsoft and other hyperscalers now run training jobs across data centers hundreds of kilometers apart. Microsoft added about 120,000 new fiber miles in the United States in the year to November 2025 to expand its AI network footprint by more than 25%, linking Fairwater sites in Wisconsin and Atlanta that sit roughly 700 miles apart. In June 2026 Ciena stated that “DCI, including scale-across, is gaining momentum as customers connect AI data centers to monetize their investments” (Source: Ciena investor presentation filed with the US Securities and Exchange Commission), and at its fiscal 2025 results it reported that two more major hyperscalers had chosen its optical solutions for scale-across training. In the DC Market Insights model, scale-across links take 17.2% of 2025 spending and grow at 16.41% a year.
Cloud Buyers Now Dominate Supplier Order Books
Supplier results show cloud providers becoming the anchor buyers of interconnect equipment. Direct cloud providers accounted for 42% of Ciena’s revenue in the fourth quarter of fiscal 2025, growing 49%, and cloud provider revenue reached 46% of the total in the second quarter of fiscal 2026, up 70%. Nokia reported sales of EUR 2.4 billion to AI and cloud customers in 2025. DC Market Insights estimates that cloud and hyperscale providers bought USD 5.84 billion, or 47.8%, of data center interconnect in 2025.
Market Trends: How Is Data Center Interconnect Changing?
The Data Center Interconnect Market is moving to faster coherent wavelengths, to optics that plug straight into routers, and to dedicated fiber routes built for AI traffic.
Line Rates Move from 400G to 800G and 1.6T
Recent coherent generations have moved from 400G to 800G to 1.6T per wavelength. Marvell’s COLORZ 800 module supports 800G ZR and ZR+ transmission up to 2,000 km for links between distributed AI clusters, and in March 2026 Marvell introduced the COLORZ 1600, a 1.6T module for campus (20 km), metro (120 km) and regional (1,000 km) links, with customer sampling expected in the second half of 2026. DC Market Insights forecasts the 1.6T and above class to grow from 7.9% of the market in 2025 to 57.7% in 2035.
Pluggable Coherent Optics Take Share from Transponder Shelves
Coherent pluggables put the DCI optics inside the router or switch, removing a separate transponder shelf in many metro links. Ciena reported pluggable revenue of more than USD 168 million in fiscal 2025, more than double its fiscal 2024 level, and Cisco stated that it now sells its pluggable optics to all the major hyperscalers. DC Market Insights forecasts coherent pluggable optics to rise from USD 1.99 billion (16.3%) in 2025 to USD 6.95 billion (24.7%) in 2035, while optical DCI systems keep the largest share at 36.6% because long reaches and high-count fiber routes still need line systems and amplifiers.
New Long-Haul Routes Are Built Around AI Campuses
Fiber route builders are laying new paths between data center markets, as the Zayo long-haul program listed under Recent Developments shows. Each new route needs line systems and transponders at both ends, which is why DC Market Insights forecasts regional and long-haul interconnect to grow at 9.46% a year, faster than metro at 7.43%.
Market Challenges: What Holds the Data Center Interconnect Market Back?
Falling price per bit and a buyer base concentrated in a handful of cloud providers are the two constraints that DC Market Insights expects to slow the Data Center Interconnect Market, keeping long-run growth at 8.71% a year even as transported traffic rises much faster.
Price per Bit Falls Faster Than Spend Rises
Every move from 400G to 800G to 1.6T cuts the cost of each transported bit. DC Market Insights models bandwidth-upgrade spend on the installed base falling from about USD 71,000 per MW in 2020 to about USD 47,000 per MW in 2035, so upgrade spend grows only from USD 7.06 billion in 2025 to USD 13.28 billion in 2035 while the installed base more than doubles. Links of 100G and below shrink by 9.95% a year, and 200G and 400G links by 4.85% a year.
A Few Buyers Set Prices and Timing
Customer concentration leaves suppliers exposed to the build plans of a few hyperscalers. Ciena reported three customers that each accounted for at least 10% of revenue in the fourth quarter of fiscal 2025, two of them global cloud providers. DC Market Insights builds this into its low scenario, in which the 2035 market is USD 22.85 billion rather than USD 28.14 billion.
Market Opportunities: Where Are the New Revenue Pools?
The two largest new revenue pools in the Data Center Interconnect Market are graphics processing unit (GPU) and neocloud providers, growing at 16.33% a year, and campus interconnect for AI clusters, growing at 10.75% a year.
GPU and Neocloud Providers Grow Interconnect Spend to USD 3.71 Billion
Specialist GPU cloud operators spent USD 818.02 million on data center interconnect in 2025, and DC Market Insights expects their spend to reach USD 3.71 billion in 2035, more than four times the 2025 level. DC Market Insights expects these operators to favor pluggable 800G and 1.6T optics and compact line systems.
Campus Interconnect Grows to USD 4.81 Billion by 2035
AI campuses now spread across several buildings within 20 km, connected by coherent-lite optics designed for short reaches. Ciena’s WaveLogic 6 Nano 1.6 Tb/s coherent-lite pluggable is aimed at data center fabric and campus applications. DC Market Insights values campus interconnect at USD 1.73 billion in 2025 and USD 4.81 billion in 2035, lifting its share from 14.2% to 17.1%.
Pricing: How Much Do Data Centers Spend on Interconnect per MW?
A conventional data center hall carries about USD 0.24 million of interconnect spend per MW of IT load in 2025, and an AI hall about USD 0.78 million per MW. These are DC Market Insights estimates covering optical systems, pluggable optics, inter-site router and switch ports, software and services, excluding fiber leases.
| Interconnect spend per MW (USD million) | 2020 | 2025 | 2030 | 2035 |
|---|---|---|---|---|
| Conventional hall, new build | 0.22 | 0.24 | 0.25 | 0.26 |
| AI hall, new build | 0.90 | 0.78 | 0.74 | 0.70 |
| Bandwidth upgrade, per MW installed | 0.07 | 0.06 | 0.05 | 0.05 |
| AI share of new capacity | 3% | 35% | 60% | 66% |
The lines move in different directions. Conventional spend per MW rises slowly as more enterprise and cloud halls connect to two or more sites for resilience. AI spend per MW falls because each new coherent generation carries more traffic per dollar, even as AI campuses add more links. Upgrade spend per installed MW falls fastest, from about USD 71,000 in 2020 to about USD 47,000 in 2035, as price per bit drops.
Standards and Regulation: Which Specifications Shape Data Center Interconnect?
Interoperability agreements, rather than regulation, decide which data center interconnect optics buyers can mix: the Optical Internetworking Forum (OIF) 400ZR and 800ZR implementation agreements and the OpenZR+ multi-source agreement (MSA).
OIF 800ZR. The OIF Implementation Agreement for 800ZR Coherent Interfaces, dated October 2024, defines an 800G coherent line interface for single-span, amplified 80 to 120 km point-to-point dense wavelength division multiplexing (DWDM) links, such as data center interconnect. The OIF released it together with updates to the 400ZR agreement (version 3.0) that clarify parameter definitions and improve interoperability.
OpenZR+ MSA. The OpenZR+ specification is designed to address longer reaches and a wider range of network architectures than ZR. Revision 3.0, released in September 2023, added a higher-performing 400G 8QAM mode and a higher transmit power mode. Its initial members include Acacia Communications, Arista Networks, Cisco, Fujitsu Optical Components, InnoLight Technology, Juniper Networks, Lumentum and NTT Electronics.
Regulation. DC Market Insights finds no product rules specific to data center interconnect equipment.
Market Segmentation: Which Segment Leads the Data Center Interconnect Market?
Optical DCI systems lead the Data Center Interconnect Market with 41.2% of 2025 value, cloud and hyperscale providers lead buyers with 47.8%, and metro links of 20 to 120 km lead by reach with 49.3%. Among offerings, coherent pluggable optics are the fastest-growing segment at 13.32% a year, against 7.43% for optical DCI systems, because routers and switches with 800G and 1.6T coherent ports remove a separate transponder layer in many metro and campus links.
By Offering: Optical DCI Systems Lead with 41.2%
| Offering | 2025 (USD billion) | Share 2025 | 2035 (USD billion) | CAGR 2025-2035 |
|---|---|---|---|---|
| Optical DCI Systems | 5.03 | 41.2% | 10.30 | 7.43% |
| Coherent Pluggable Optics | 1.99 | 16.3% | 6.95 | 13.32% |
| Packet DCI Routers and Switches | 2.28 | 18.7% | 4.61 | 7.29% |
| Software and Automation | 0.87 | 7.1% | 2.34 | 10.42% |
| Services | 2.04 | 16.7% | 3.94 | 6.81% |
Software and automation grow faster than hardware systems, at 10.42% a year, because multi-site AI clusters need path planning, telemetry and automated wavelength provisioning across many routes.
By Data Rate: 200G and 400G Leads with 44.7%
| Data rate | 2025 (USD billion) | Share 2025 | 2035 (USD billion) | CAGR 2025-2035 |
|---|---|---|---|---|
| Up to 100G | 1.68 | 13.8% | 0.59 | -9.95% |
| 200G and 400G | 5.46 | 44.7% | 3.32 | -4.85% |
| 800G | 4.10 | 33.6% | 7.99 | 6.89% |
| 1.6T and Above | 0.96 | 7.9% | 16.23 | 32.62% |
200G and 400G links held the largest share of 2025 value, with 800G close behind at 33.6%. DC Market Insights forecasts 1.6T and above to become the largest data rate class by 2035 at USD 16.23 billion.
By Reach: Metro Links Lead with 49.3%
| Reach | 2025 (USD billion) | Share 2025 | 2035 (USD billion) | CAGR 2025-2035 |
|---|---|---|---|---|
| Campus (Up to 20 km) | 1.73 | 14.2% | 4.81 | 10.75% |
| Metro (20 to 120 km) | 6.02 | 49.3% | 12.32 | 7.43% |
| Regional and Long-Haul (Above 120 km) | 4.46 | 36.5% | 11.00 | 9.46% |
Metro links of 20 to 120 km, which include the 80 to 120 km amplified links targeted by the OIF 800ZR agreement, hold about half of spending. Campus links grow fastest as AI campuses spread across several buildings, and regional links gain share as training clusters span cities.
By Application: Cloud Workload and Data Mobility Leads with 38.1%
| Application | 2025 (USD billion) | Share 2025 | 2035 (USD billion) | CAGR 2025-2035 |
|---|---|---|---|---|
| Cloud Workload and Data Mobility | 4.65 | 38.1% | 9.40 | 7.29% |
| Distributed AI Training (Scale-Across) | 2.10 | 17.2% | 9.59 | 16.41% |
| Disaster Recovery and Business Continuity | 2.61 | 21.4% | 4.28 | 5.05% |
| Storage Replication and Shared Resources | 2.84 | 23.3% | 4.87 | 5.52% |
Distributed AI training grows fastest at 16.41% a year and overtakes cloud workload mobility by 2035 as the largest application. Disaster recovery and storage replication grow more slowly because they track enterprise and colocation capacity rather than AI capacity.
By End User: Cloud and Hyperscale Providers Lead with 47.8%
| End user | 2025 (USD billion) | Share 2025 | 2035 (USD billion) | CAGR 2025-2035 |
|---|---|---|---|---|
| Cloud and Hyperscale Providers | 5.84 | 47.8% | 14.66 | 9.65% |
| Communication Service Providers | 2.15 | 17.6% | 3.49 | 4.97% |
| Colocation and Interconnection Providers | 1.73 | 14.2% | 3.85 | 8.32% |
| Enterprises and Government | 1.67 | 13.7% | 2.42 | 3.76% |
| GPU and Neocloud Providers | 0.82 | 6.7% | 3.71 | 16.33% |
GPU and neocloud providers grow fastest at 16.33% a year; enterprises and government grow slowest at 3.76% as workloads move to cloud and colocation.
DC Exclusive: The Interconnect Spend per MW Model and End User × Offering Matrix
At USD 2.53 billion in 2025, optical DCI systems bought by cloud and hyperscale providers are the single largest cell of the matrix and 20.7% of all data center interconnect spending. The matrix cross-tabulates who buys interconnect and what they buy. It is a DC Market Insights model, not a shipment count, built from 49 inputs: 32 capacity cohorts (16 years of conventional and AI halls), 3 spend curves per MW (conventional build, AI build and bandwidth upgrade), 5 offering splits, 5 end-user splits, and 4 supplier disclosures used as a cross-check.
| 2025, USD billion | Optical DCI Systems | Coherent Pluggable Optics | Packet DCI Routers and Switches | Software and Automation | Services | Total |
|---|---|---|---|---|---|---|
| Cloud and Hyperscale Providers | 2.53 | 1.25 | 0.96 | 0.35 | 0.75 | 5.84 |
| Communication Service Providers | 0.96 | 0.15 | 0.44 | 0.17 | 0.42 | 2.15 |
| Colocation and Interconnection Providers | 0.65 | 0.27 | 0.37 | 0.14 | 0.31 | 1.73 |
| Enterprises and Government | 0.56 | 0.14 | 0.39 | 0.15 | 0.43 | 1.67 |
| GPU and Neocloud Providers | 0.33 | 0.18 | 0.13 | 0.05 | 0.13 | 0.82 |
| Total | 5.03 | 1.99 | 2.28 | 0.87 | 2.04 | 12.21 |
Cloud and hyperscale providers spend 21.4% of their interconnect budget on coherent pluggables, three times the 7.2% share of communication service providers, which still favor transponder shelves for long routes. Enterprises and government spend 25.8% of their budget on services, the highest share of any buyer, because they rarely run their own optical teams. GPU and neocloud providers carry the highest pluggable share at 22.4%. Rows and columns are rounded to 2 decimals and may not add exactly.
The interconnect spend per MW model has three inputs that any reader can check: new capacity delivered each year (12.0 GW in 2025), the share of it built for AI (35% in 2025) and the installed base that needs bandwidth upgrades (about 115 GW at the start of 2025). Multiplying each by its spend per MW and adding the results gives the market. The model and its assumptions are explained on our research methodology page.
Regional Insights: Which Region Leads the Data Center Interconnect Market?
North America leads the Data Center Interconnect Market with 44.8% of 2025 value, and the Middle East and Africa is the fastest-growing region at 12.34% a year, because DC Market Insights expects sovereign AI campuses in the Gulf to add capacity from a small base and to need links between campuses and to cloud regions.
North America Leads with 44.8% Share
North American buyers spent USD 5.47 billion on data center interconnect in 2025, and DC Market Insights forecasts USD 11.59 billion in 2035, a CAGR of 7.80%. The region hosts the multi-campus AI systems that drive scale-across demand, including Microsoft’s Fairwater sites in Wisconsin and Atlanta, and the new long-haul routes announced by Zayo. North America loses 3.6 points of share by 2035 as other regions add capacity faster, not because its volume slows.
Asia Pacific Holds 29.6% Share
Asia Pacific is worth USD 3.61 billion in 2025 and USD 9.12 billion by 2035, a CAGR of 9.69%, and gains 2.8 points of share, the largest gain of any region. China is the largest market in the DC Market Insights allocation, while India grows fastest in the DC Market Insights model as hyperscale and colocation operators add new campuses that need multi-site links.
Europe Holds 17.9% Share
Europe is worth USD 2.19 billion in 2025 and USD 4.67 billion by 2035, a CAGR of 7.89%.
Latin America Holds 4.1% Share
Latin America is worth USD 500.58 million in 2025 and USD 1.35 billion by 2035, a CAGR of 10.43%, with Brazil the largest country market in the region in the DC Market Insights allocation.
Middle East and Africa Holds 3.6% Share
The Middle East and Africa is worth USD 439.53 million in 2025 and USD 1.41 billion by 2035, the fastest growth of any region at 12.34% a year. DC Market Insights expects Gulf AI campuses to drive most of the growth, with metro links between colocation sites adding the rest.
Country Analysis: Which Countries Spend the Most on Data Center Interconnect?
The United States is the largest country market for data center interconnect at USD 4.88 billion in 2025, 40.0% of global value, followed by China at USD 1.38 billion (11.3%) and Japan at USD 571.00 million (4.7%). The 12 largest countries account for 79.9% of 2025 spending.
| Rank | Country | Region | 2025 (USD billion) | Share 2025 | 2035 (USD billion) | CAGR 2025-2035 |
|---|---|---|---|---|---|---|
| 1 | United States | North America | 4.88 | 40.0% | 10.25 | 7.69% |
| 2 | China | Asia Pacific | 1.38 | 11.3% | 3.21 | 8.83% |
| 3 | Japan | Asia Pacific | 0.57 | 4.7% | 1.27 | 8.30% |
| 4 | United Kingdom | Europe | 0.47 | 3.8% | 0.92 | 7.00% |
| 5 | Canada | North America | 0.44 | 3.6% | 1.01 | 8.57% |
| 6 | Germany | Europe | 0.42 | 3.5% | 0.88 | 7.61% |
| 7 | India | Asia Pacific | 0.34 | 2.8% | 1.29 | 14.31% |
| 8 | Australia | Asia Pacific | 0.29 | 2.4% | 0.72 | 9.42% |
| 9 | France | Europe | 0.26 | 2.2% | 0.58 | 8.16% |
| 10 | Netherlands | Europe | 0.24 | 2.0% | 0.48 | 6.99% |
| 11 | Singapore | Asia Pacific | 0.24 | 2.0% | 0.53 | 8.29% |
| 12 | Brazil | Latin America | 0.21 | 1.8% | 0.56 | 10.20% |
India is the fastest-growing large country market at 14.31% a year, ahead of Brazil at 10.20%, as operators connect new campuses outside the established Asian hubs. The Netherlands grows slowest at 6.99% a year in the DC Market Insights allocation. The country figures are a DC Market Insights allocation of the regional totals, weighted by each country’s estimated share of installed and new data center capacity.
Forecast Scenarios: How Could the 2035 Forecast Change?
The Data Center Interconnect Market reaches USD 28.14 billion by 2035 in the base case, with a range of USD 22.85 billion to USD 33.14 billion across the low and high scenarios.
| Scenario | Assumption from 2026 | 2035 (USD billion) | CAGR 2025-2035 |
|---|---|---|---|
| Low | Capacity additions 15% below base; scale-across stays limited to a few hyperscalers; faster price-per-bit decline | 22.85 | 6.47% |
| Base | Additions rise to 27.0 GW a year; AI share of new capacity reaches 66% | 28.14 | 8.71% |
| High | Additions 15% above base; most large AI clusters span two or more campuses | 33.14 | 10.50% |
The low case is what a two-year pause in AI capital spending looks like: fewer new campuses need linking and upgrade spend follows the falling price per bit. The high case assumes that multi-site training becomes the default design for large clusters, so new regional routes and 1.6T links arrive earlier.
Competitive Insights: Who Leads the Data Center Interconnect Market?
- Ciena
- Nokia
- Cisco
- Huawei
- Juniper Networks
- Arista Networks
- Marvell Technology
- ZTE
- Adtran
- Lumentum
- Coherent
- Ribbon Communications
- NEC
- FiberHome
Ciena is the market leader with about 15% of the Data Center Interconnect Market in 2025 (DC Market Insights estimate: about USD 1.85 billion of Ciena’s fiscal 2025 revenue of USD 4.77 billion, which included Optical Networking sales of USD 3.25 billion, allocated to links between data centers, set against the USD 12.21 billion market). DC Market Insights estimates that the five largest suppliers hold just under half of the market. Direct cloud providers made up 42% of Ciena’s revenue in the fourth quarter of fiscal 2025. Nokia expanded its optical and webscale business when it completed the acquisition of Infinera on 28 February 2025, a deal it said expands its presence in the webscale segment; its Optical Networks business sold EUR 3.02 billion in 2025. Cisco sells pluggable optics to all the major hyperscalers and recorded USD 1.3 billion of AI infrastructure orders from hyperscalers in the first quarter of fiscal 2026. Marvell offers 800G coherent pluggable modules and has announced 1.6T modules and 2nm coherent digital signal processors, with sampling expected in the second half of 2026. In the DC Market Insights assessment, Huawei, ZTE and FiberHome are the main suppliers in China, Juniper Networks and Arista Networks compete on router and switch ports with coherent optics, Adtran, Ribbon Communications and NEC focus on carriers and regional operators, and Lumentum and Coherent supply optical components and modules.
Recent Developments
- In January 2025, Zayo announced the construction of more than 5,000 new long-haul fiber route miles over five years to meet AI and data center demand (Source: Zayo press release).
- In February 2025, Nokia completed its acquisition of Infinera, expanding its presence in the webscale segment (Source: Nokia press release).
- In September 2025, Ciena agreed to acquire Nubis Communications for USD 270 million in cash to add low-power optical and electrical interconnects for AI workloads inside the data center (Source: Ciena announcement).
- In September 2025, Marvell presented its COLORZ 800 family of 800G ZR and ZR+ coherent pluggable modules, which support transmission up to 2,000 km between distributed AI clusters (Source: Marvell press release).
- In March 2026, Marvell introduced the COLORZ 1600 1.6T ZR and ZR+ pluggable for campus, metro and regional links, with sampling expected in the second half of 2026 (Source: Marvell announcement).
- In June 2026, Ciena reported that cloud provider revenue reached 46% of its total, up 70%, and that DCI including scale-across is gaining momentum (Source: Ciena SEC filing).
We follow these deals, launches and capacity announcements as they happen in our data center industry updates, and the cabling inside each campus is covered in the Data Center Cables Market report.
Methodology: How We Built the Data Center Interconnect Market Model
DC Market Insights built this market bottom-up from 16 annual capacity cohorts (2020 to 2035), each split into conventional and AI halls and priced with an interconnect spend per MW. Bandwidth-upgrade spending was added on the installed base at about USD 71,000 per MW in 2020, falling to about USD 47,000 per MW by 2035 as price per bit declines, with 1.8% of the installed base retired each year. The total was split by 5 offerings, 4 data rates, 3 reach classes, 4 applications, 5 end users and 5 regions, and every split sums to the market total. The result was checked top-down against the disclosed results of 4 listed suppliers (Ciena, Nokia, Cisco and Marvell), including Ciena’s segment revenue and cloud share and Nokia’s Optical Networks sales. Country values allocate each regional total by country weights for installed and new capacity. The analyst named on this page built the model, and the reviewer checked the arithmetic, the sources and the dates before publication.
Table of contents
- 01Introduction
- 1.1Market Definition and Scope
- 1.2Report Coverage and Segments
- 1.3Currency, Base Year and Forecast Period
- 1.4Key Stakeholders
- 02Research Methodology
- 2.1Bottom-Up Capacity Cohort Model
- 2.2Interconnect Spend per MW Assumptions
- 2.3Top-Down Supplier Cross-Checks
- 2.4Primary and Secondary Sources
- 2.5Assumptions and Limitations
- 03Executive Summary
- 3.1Market Size, 2020, 2025 and 2035
- 3.2Key Findings
- 3.3Analyst Viewpoint
- 04Market Dynamics
- 4.1Drivers
- 4.2Trends
- 4.3Challenges
- 4.4Opportunities
- 05Pricing Analysis
- 5.1Interconnect Spend per MW, Conventional and AI Halls
- 5.2Bandwidth Upgrade Spend per Installed MW
- 5.3Price per Bit by Coherent Generation
- 06Standards and Interoperability
- 6.1OIF 400ZR and 800ZR Implementation Agreements
- 6.2OpenZR+ Multi-Source Agreement
- 6.3Interoperability and Multi-Vendor Sourcing
- 07Supply Chain Analysis
- 7.1Coherent DSP and Photonic Component Suppliers
- 7.2Module and System Vendors
- 7.3Integrators and Service Providers
- 7.4Buyers
- 08Market Size and Forecast
- 8.1Market Size, 2020-2035
- 8.2New-Build and Bandwidth Upgrade Spend
- 8.3Year-on-Year Growth
- 09Market by Offering
- 9.1Optical DCI Systems
- 9.2Coherent Pluggable Optics
- 9.3Packet DCI Routers and Switches
- 9.4Software and Automation
- 9.5Services
- 10Market by Data Rate
- 10.1Up to 100G
- 10.2200G and 400G
- 10.3800G
- 10.41.6T and Above
- 11Market by Reach
- 11.1Campus (Up to 20 km)
- 11.2Metro (20 to 120 km)
- 11.3Regional and Long-Haul (Above 120 km)
- 12Market by Application
- 12.1Cloud Workload and Data Mobility
- 12.2Distributed AI Training (Scale-Across)
- 12.3Disaster Recovery and Business Continuity
- 12.4Storage Replication and Shared Resources
- 13Market by End User
- 13.1Cloud and Hyperscale Providers
- 13.2Communication Service Providers
- 13.3Colocation and Interconnection Providers
- 13.4Enterprises and Government
- 13.5GPU and Neocloud Providers
- 14DC Exclusive: Interconnect Spend per MW Model
- 14.1End User × Offering Matrix, 2025
- 14.2Model Inputs and Checks
- 15Market by Region
- 15.1North America (United States, Canada)
- 15.2Asia Pacific (China, Japan, India, Australia, Singapore)
- 15.3Europe (United Kingdom, Germany, France, Netherlands)
- 15.4Latin America (Brazil)
- 15.5Middle East and Africa
- 16Country Analysis
- 16.1Top 12 Countries, 2025 and 2035
- 16.2Fastest-Growing Countries
- 17Regional Cross-Sections
- 17.1Regional Share Shifts, 2025 to 2035
- 17.2Regional Growth Comparison, 2025-2035
- 18Forecast Scenarios
- 18.1Low Scenario
- 18.2Base Scenario
- 18.3High Scenario
- 19Competitive Landscape
- 19.1Market Share Estimate, 2025
- 19.2Competitive Positioning
- 19.3Mergers, Acquisitions and Partnerships
- 20Company Profiles
- 20.1Ciena
- 20.2Nokia
- 20.3Cisco
- 20.4Huawei
- 20.5Juniper Networks
- 20.6Arista Networks
- 20.7Marvell Technology
- 20.8ZTE
- 20.9Adtran
- 20.10Lumentum
- 20.11Coherent
- 20.12Ribbon Communications
- 20.13NEC
- 20.14FiberHome
- 21Recent Developments
- 21.1Product Launches
- 21.2Acquisitions
- 21.3Network Builds
- 22Analyst Recommendations
- 22.1For Equipment Vendors
- 22.2For Data Center Operators
- 22.3For Investors
- Fig. 1Data Center Interconnect Market Size, 2020–2035
- Fig. 2Interconnect Spend per MW, 2020, 2025, 2030 and 2035
- Fig. 3Market Share by Offering, 2025 and 2035
- Fig. 4Market Share by Data Rate, 2025 and 2035
- Fig. 5Market Share by Reach, 2025 and 2035
- Fig. 6Market Share by Application, 2025 and 2035
- Fig. 7Market Share by End User, 2025 and 2035
- Fig. 8Market by Region, 2025 and 2035
- Fig. 9Top 12 Countries, 2025
- Fig. 10Forecast Scenarios, 2035
- Table 1Report Attributes
- Table 2Interconnect Spend per MW (USD million)
- Table 3Market by Offering, 2025 and 2035 (USD billion)
- Table 4Market by Data Rate, 2025 and 2035 (USD billion)
- Table 5Market by Reach, 2025 and 2035 (USD billion)
- Table 6Market by Application, 2025 and 2035 (USD billion)
- Table 7Market by End User, 2025 and 2035 (USD billion)
- Table 8End User × Offering Matrix, 2025 (USD billion)
- Table 9Market by Region, 2025 and 2035 (USD billion)
- Table 10Top 12 Countries, 2025 and 2035 (USD billion)
- Table 11Forecast Scenarios, 2035 (USD billion)
About this report
Written by Amit Jain and reviewed by Deepti Agrawal, Senior Editor, Research. Figures are built top-down and bottom-up and reconciled before publication, with 2025 as the base year.
Read our methodologyHow we built this
- Historical period2020-2024
- Base year2025
- Forecast period2026-2035
- Sizing approachTop-down + bottom-up
Need more than the report?
Advisory on this market
Due diligence, site selection and market entry work, by the analysts who wrote this report.
See consulting servicesFrequently asked questions
USD 12.21 billion in 2025, rising to USD 28.14 billion by 2035. DC Market Insights estimates the market at USD 7.43 billion in 2020.
8.71% a year from 2025 to 2035. Growth was faster, at 10.45% a year, between 2020 and 2025, and 2025 alone added 15.6% as hyperscalers began linking AI campuses.
Optical DCI systems, with USD 5.03 billion or 41.2% of the market in 2025. Coherent pluggable optics are the fastest-growing offering at 13.32% a year.
About USD 0.24 million per MW for a conventional hall and USD 0.78 million per MW for an AI hall in 2025, according to DC Market Insights estimates.
North America, with USD 5.47 billion or 44.8% of 2025 value. The Middle East and Africa grows fastest at 12.34% a year.
Ciena leads with about 15% of the market (DC Market Insights estimate). Nokia, Cisco, Huawei, Juniper Networks, Arista Networks, Marvell Technology, ZTE, Adtran, Lumentum, Coherent, Ribbon Communications, NEC and FiberHome also compete.
Cloud and hyperscale providers, with USD 5.84 billion or 47.8% of 2025 demand. GPU and neocloud providers grow fastest at 16.33% a year.
16.41% a year, from USD 2.10 billion in 2025 to USD 9.59 billion in 2035, when scale-across becomes the largest application at 34.1% of the market.
Licences, delivery and payment
Which licence should I choose?
Single User is a view-only PDF for one person. Multi User adds a printable PDF and the Excel data for unlimited users at one location. Enterprise covers your whole company and includes 100 free analyst hours.
How and when will I receive the report?
By email, within 24–48 business hours of payment, in the formats of your licence.
How can I pay?
Securely through PayPal: with a PayPal account, a debit or credit card, or PayPal Pay Later where available. Prices are in US dollars.
Can I see a sample first?
Yes. Request a free sample and we will email it to you.
Can the report be tailored to my needs?
Yes. We can add countries, segments or data cuts. Talk to an analyst about the scope you need.
Can I get an invoice or pay against a purchase order?
Write to sales@dcmarketinsights.com and our team will help.