
Data Center Substation Market Size, Share & Forecast to 2035
Market at a glance
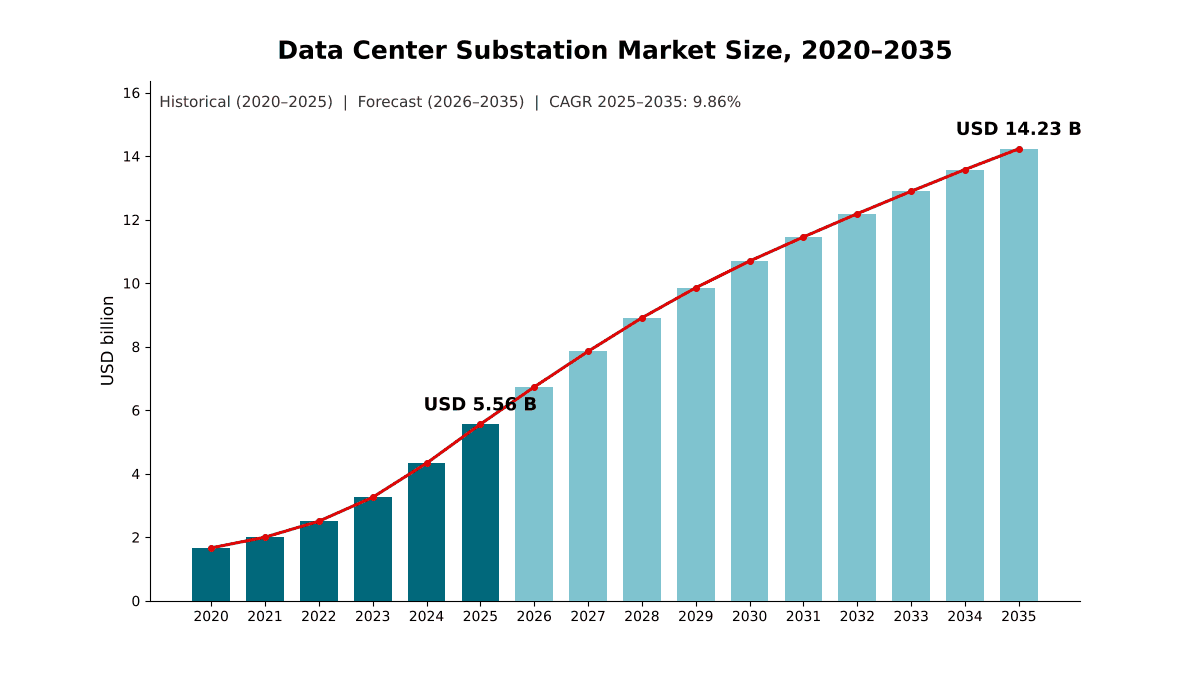
The Data Center Substation market was worth USD 5,560.0 million in 2025 and is forecast to reach USD 14.23 billion by 2035, growing at a 9.86% CAGR. North America accounts for 51.3% of the market.
 By Satyabrat Rajawat, Senior Research Analyst, Strategic Advisory
 Reviewed by Deepti Agrawal
Last updated 7 Oct 2026
Base year 2025 PDF + Excel
Reviewed by Deepti Agrawal
Last updated 7 Oct 2026
Base year 2025 PDF + Excel
Source: DC Market Insights analysis
Key findings
More Than 23 GW Under Construction Needs About USD 8.78 Billion of Substations
Connections Above 230 kV Grow at 14.32% a Year
Transformer Lead Times Reached 120 Weeks
AI and GPU Cloud Campuses Grow to USD 3.50 Billion by 2035
What is inside the report
- 01Introduction
- 02Research Methodology
- 03Executive Summary
- 04Market Dynamics
- 05Pricing and Cost Analysis
- 06Standards and Regulation
- 07Supply Chain and Value Chain Analysis
- 08Global Data Center Substation Market Size and Forecast
- 09Market by Component
- 10Market by Voltage Level
- 21chapters
- 2020-2024Historical period
- 2026-2035Forecast period
- 14Companies profiled
Regional insights
- North America51.3%
- Asia Pacific24.6%
- Europe15.4%
- Latin America4.2%
- Middle East and Africa4.5%
Segmentation
Companies profiled
- Hitachi Energy
- Siemens Energy
- GE Vernova
- Schneider Electric
- ABB
- Eaton
- Siemens
- Mitsubishi Electric
- Toshiba Energy Systems & Solutions
- HD Hyundai Electric
- LS Electric
- Hyosung Heavy Industries
- Powell Industries
- WEG
Recent developments
Eaton completed its USD 1.4 billion acquisition of Fibrebond, a designer and builder of pre-integrated modular power enclosures, expanding its presence in modular solutions for hyperscale and multi-tenant data centers (Source: Eaton news release).
Hitachi Energy announced more than USD 1 billion of US grid equipment investment, including about USD 457 million for a large power transformer facility in South Boston, Virginia (Source: Hitachi Energy press release).
LS Electric reported a USD 312.04 million contract with a US power company for ultra-high-voltage transformers rated up to 525 kV, for a renewable power plant supplying a large data center in the southeastern United States (Source: Transformer Technology news report).
GE Vernova reported USD 2.4 billion of Electrification equipment orders to support data centers in the first quarter (Source: GE Vernova SEC filing).
ABB reported Electrification orders of USD 7.23 billion in the second quarter, up 60% (58% comparable), with data center build-out a primary catalyst (Source: ABB results release).
Siemens reported Smart Infrastructure orders up 42% on a comparable basis to EUR 8.0 billion, including several large orders from data center customers in the US and Europe (Source: Siemens earnings release).
Full analysis
The Data Center Substation Market covers the high-voltage and medium-voltage substations that connect data center campuses to the transmission grid and step power down for the buildings: power transformers, gas-insulated and air-insulated switchgear, medium-voltage switchgear, protection and control systems, and the engineering and construction that turn them into an energized substation. DC Market Insights values the global Data Center Substation Market at USD 5.56 billion in 2025 and forecasts USD 14.23 billion by 2035, a CAGR of 9.86%. The 2025 value is built from the capacity itself: about 13.4 GW of IT capacity energized or prepared for energization (45% of 2025 completions of 12.0 GW plus 55% of 2026 completions of 14.5 GW, because substations are commissioned ahead of the IT load) at about USD 0.38 million of substation spend per MW of IT load gives USD 5.08 billion of new-build spend, and expansion and upgrade work on an installed base of about 104 GW adds USD 478.04 million. Expansion and upgrade work is the fastest-growing segment at 16.06% a year because the installed base nearly triples by 2035 and older campuses need more transformer capacity for AI racks, and the Middle East and Africa is the fastest-growing region at 13.80% a year as the region adds campus-scale capacity from a small installed base.
Executive Summary
The Global Data Center Substation Market size was valued at USD 1.66 billion in 2020, reached USD 5.56 billion in 2025, and is anticipated to reach USD 14.23 billion by 2035, at a CAGR of 9.86% during the forecast period.
| Report attribute | Details |
|---|---|
| Historical Period | 2020-2024 |
| Base Year | 2025 |
| Forecast Period | 2026-2035 |
| Data Center Substation Market Size 2025 | USD 5.56 Billion |
| Data Center Substation Market, CAGR | 9.86% |
| Data Center Substation Market Size 2035 | USD 14.23 Billion |
The market grew at 27.29% a year between 2020 and 2025, and 2025 alone added 28.4% over 2024 as campuses of several hundred megawatts replaced single buildings as the standard unit of data center construction. A campus of that size needs its own transmission-voltage delivery point, which moved substations from a utility line item into the data center budget.
Growth slows to 9.86% a year from 2025 to 2035 because annual capacity additions, which DC Market Insights models rising from 12.0 GW in 2025 to 22.0 GW in 2030 and 27.0 GW in 2035, grow more slowly once the current AI build cycle matures, and because substation spend per MW rises only 1% to 2% a year after 2028 as transformer factories add capacity. The installed base grows from about 116 GW at the end of 2025 to about 326 GW by 2035, which lifts expansion and upgrade spending from 8.6% of the market to 14.9%.
Market Scope: What Does the Data Center Substation Market Cover?
The Data Center Substation Market covers every substation built or upgraded to serve a data center, valued at first sale in current US dollars, with 2025 as the base year and forecasts to 2035. DC Market Insights sizes it at USD 5.56 billion in 2025.
Included. Utility-owned delivery and switching substations built for a data center customer, customer-owned campus substations that step transmission voltage down to medium voltage, power transformers from about 10 MVA upward, high-voltage gas-insulated switchgear (GIS) and air-insulated switchgear (AIS), medium-voltage switchgear and ring main units at the substation, protection relays, substation automation and control systems, prefabricated power enclosures (eHouses) and skid-mounted substations, and the engineering, civil works, installation and commissioning of the substation.
Excluded. Transmission lines beyond the substation fence, generation and on-site power plants, low-voltage switchboards, uninterruptible power supplies (UPS), busways, rack power distribution units, backup generators and the IT equipment itself.
How the segments fit together. The component, voltage level, insulation type, ownership, data center type and project type splits each re-cut the same USD 5.56 billion. A single campus usually spans two voltage levels: a transmission-voltage yard owned by the utility or the operator, and medium-voltage switchgear feeding the buildings. Each piece of equipment is counted once, at the voltage of its high side.
Market Drivers: What Drives the Data Center Substation Market?
Three drivers explain most of the growth in the Data Center Substation Market: a construction pipeline of more than 23 GW, data center electricity demand that the International Energy Agency (IEA) expects to more than double by 2030, and utilities that now ask data centers to fund their own grid connections.
More Than 23 GW Under Construction Needs About USD 8.78 Billion of Substations
BloombergNEF counted 23.1 GW of data center capacity under construction globally at the end of September 2025, across 831 sites, with the United States hosting 15.9 GW of it. At the DC Market Insights estimate of USD 0.38 million of substation spend per MW of IT load, that pipeline alone carries about USD 8.78 billion of substation work, more than one and a half years of 2025 market value. Dominion Energy reported about 40 GW of data center capacity in various stages of contracting as of December 2024, with 26 GW in the substation engineering letters of authorization stage.
Data Center Electricity Use Rises from 415 TWh to About 945 TWh by 2030
The IEA estimates that data centers used 415 terawatt-hours (TWh) in 2024, about 1.5% of world electricity consumption, and expects their consumption to more than double to around 945 TWh by 2030. The United States accounted for 45% of data center electricity consumption in 2024.
Large-Load Rules Shift Connection Costs to Data Centers
Regulators are moving the cost of grid connection onto the customer. Texas Senate Bill 6, signed into law on June 21, 2025, requires large load customers above 75 MW to contribute to the cost of connecting and requires utilities to set curtailment protocols for emergencies. At the federal level, the Secretary of Energy directed the Federal Energy Regulatory Commission (FERC) on October 23, 2025 to consider an advance notice of proposed rulemaking for loads generally above 20 MW (Source: FERC Docket No. RM26-4-000). DC Market Insights expects these rules to raise the customer-owned share of substation spending from 71.8% in 2025 to 74.6% by 2035.
Market Trends: How Is High-Voltage Data Center Power Changing?
High-voltage data center power is moving to higher connection voltages, more compact gas-insulated designs and factory-built substation modules.
Connections Above 230 kV Grow at 14.32% a Year
In the DC Market Insights model, the largest AI campuses connect above 230 kV, where the equipment is heavier and costlier per unit. In November 2025, LS Electric reported a USD 312.04 million contract with a US power company for ultra-high-voltage transformers rated up to 525 kV, for a renewable power plant supplying a large data center in the southeastern United States. DC Market Insights estimates the above-230 kV segment at USD 1.28 billion in 2025 and forecasts USD 4.90 billion by 2035, which lifts its share from 23.1% to 34.4%.
Prefabricated Power Enclosures Move into the Mainstream
Operators are buying substations as factory-tested modules to cut site work. Eaton completed its USD 1.4 billion acquisition of Fibrebond, a designer and builder of pre-integrated modular power enclosures, in April 2025, expanding its presence in modular solutions for multi-tenant and hyperscale data center customers. DC Market Insights forecasts hybrid and modular substations to grow at 14.81% a year, from USD 672.59 million in 2025 to USD 2.68 billion by 2035.
Digital Substations Raise the Value of Protection and Control
Protection, control and automation is the fastest-growing component at 12.15% a year in the DC Market Insights model, reaching USD 1.45 billion by 2035. Operators want real-time visibility of the substation, which favors digital relays that communicate over the IEC 61850 standard.
Market Challenges: What Holds the Data Center Substation Market Back?
Transformer lead times that reached 120 weeks on average in 2024 and prices about 80% above pre-pandemic levels are the two constraints that DC Market Insights expects to cap the pace of the Data Center Substation Market through 2027.
Transformer Lead Times Reached 120 Weeks
A June 2024 draft report for the US National Infrastructure Advisory Council put transformer lead times at around 50 weeks in 2021 and 120 weeks on average in 2024, and lead times for large substation power and generator step-up transformers at 80 to 210 weeks. Substations are therefore ordered first and energized ahead of the IT load.
Transformer Prices Are About 80% Higher Than Before the Pandemic
The same draft report found transformer prices 80% higher than at the beginning of the pandemic. DC Market Insights models substation spend per MW of IT load rising from USD 0.27 million in 2020 to USD 0.38 million in 2025, with transformers taking 36.4% of the market.
Switchgear Gas Rules Change Equipment Choices in Europe
The revised EU F-gas regulation bans F-gases in new medium-voltage switchgear up to 24 kV from January 1, 2026, and up to 52 kV from January 1, 2030, and bans F-gases with a global warming potential of 1 or more in new high-voltage switchgear from 52 kV to 145 kV from January 1, 2028, and above 145 kV from January 1, 2032. Sulfur hexafluoride (SF6) switchgear must, with limited exceptions, give way to alternative-gas or vacuum designs on European projects.
Market Opportunities: Where Are the New Revenue Pools?
The two largest new revenue pools in the Data Center Substation Market are AI and GPU cloud campuses, growing at 14.54% a year, and the upgrade of older campuses, growing at 16.06% a year.
AI and GPU Cloud Campuses Grow to USD 3.50 Billion by 2035
Specialist AI and GPU cloud operators spent USD 900.49 million on substations in 2025, and DC Market Insights expects their spend to reach USD 3.50 billion by 2035, almost four times the 2025 level. Grid-scale direct current is the longer-term option for these sites, covered in the Data Center High-Voltage Direct Current (HVDC) Market report.
Expansion and Upgrade Work Reaches USD 2.12 Billion by 2035
Older campuses need more transformer capacity, higher fault ratings and new protection schemes when they are re-fitted for AI racks. DC Market Insights models expansion and upgrade spending at USD 478.04 million in 2025 and USD 2.12 billion by 2035. Where the grid cannot deliver in time, operators add on-site generation behind the substation; the Data Center Generator Market report covers that equipment.
Pricing: How Much Does a Data Center Substation Cost per MW?
A data center substation costs about USD 0.38 million per MW of IT load in 2025, of which about USD 0.11 million per MW sits on the utility side of the connection. These are DC Market Insights estimates covering transformers, switchgear, protection and control, and engineering, construction and commissioning, excluding transmission lines beyond the fence.
| Substation spend per MW of IT load (USD million) | 2025 | 2035 |
|---|---|---|
| All substation spend | 0.38 | 0.44 |
| Customer-owned campus substations | 0.27 | 0.33 |
| Utility-owned delivery substations | 0.11 | 0.11 |
| Of which power transformers | 0.14 | 0.16 |
Grid operator filings give a check on the utility-side figure. A PJM Interconnection planning filing of February 2026 lists a new 230 kV ring-bus substation for a 300 MW data center in Caroline County, Virginia, at an estimated project cost of USD 26 million, of which USD 20 million is for the substation and USD 6 million for line work (Source: PJM Interconnection planning filing). That is about USD 0.07 million to USD 0.09 million per MW for a 300 MW campus, below the USD 0.11 million per MW in the model, which also covers smaller sites with higher costs per MW. Spend per MW rose from USD 0.27 million in 2020 and rises 2% to 3% a year to 2028 while transformer supply stays tight, then 1% to 2% a year, reaching USD 0.42 million in 2030.
Standards and Regulation: Which Rules Shape Data Center Substations?
Five sets of rules decide how a data center substation is designed and connected: grounding and safety guides, substation communication standards, switchgear gas rules, large-load interconnection rules and data center connection policies.
IEEE 80. The Institute of Electrical and Electronics Engineers (IEEE) Guide for Safety in AC Substation Grounding is the reference guide for grounding outdoor AC substations, either conventional or gas-insulated; IEEE lists the 2013 edition as inactive-reserved.
IEC 61850. The International Electrotechnical Commission (IEC) 61850 series defines communication for power utility automation systems, the basis of digital protection and control in new substations.
EU F-gas regulation. The switchgear bans described above apply from 2026 at medium voltage and from 2028 and 2032 at high voltage.
Large-load interconnection. Texas Senate Bill 6 applies to loads above 75 MW, and FERC Docket No. RM26-4-000 addresses loads generally above 20 MW connecting to the interstate transmission system.
Ireland connection policy. The Commission for Regulation of Utilities (CRU) published its final decision by December 2025: data centers with a maximum import capacity above 10 MVA must provide new onsite or proximate generation, dispatchable generation or storage, and 80% of their annual electricity demand must be met by additional renewable electricity in Ireland within six years of energization.
Market Segmentation: Which Segment Leads the Data Center Substation Market?
Power transformers lead the Data Center Substation Market with 36.4% of 2025 value, hyperscale data centers lead buyers with 48.6%, and the 69 kV to 230 kV class leads voltage levels with 49.3%. Expansion and upgrade work is the fastest-growing segment at 16.06% a year, ahead of hybrid and modular substations at 14.81%, because the installed base nearly triples by 2035 and every AI refit needs more transformer capacity.
By Component: Power Transformers Lead with 36.4%
| Component | 2025 (USD billion) | Share 2025 | 2035 (USD billion) | CAGR 2025-2035 |
|---|---|---|---|---|
| Power Transformers | 2.02 | 36.4% | 5.00 | 9.46% |
| High-Voltage Switchgear | 1.27 | 22.8% | 3.50 | 10.70% |
| Medium-Voltage Switchgear | 0.78 | 14.1% | 1.81 | 8.71% |
| Protection, Control and Automation | 0.46 | 8.3% | 1.45 | 12.15% |
| Engineering, Construction and Commissioning | 1.02 | 18.4% | 2.48 | 9.25% |
Transformers hold the largest share because they are the costliest items in each substation in the DC Market Insights cost model. In September 2022, utility ComEd was building a new substation with 100 MVA transformers from Siemens to accommodate the 225 MW of power a CloudHQ hyperscale campus will need. Figures in the tables may not add exactly because of rounding.
By Voltage Level: Above 69 kV to 230 kV Leads with 49.3%
| Voltage level | 2025 (USD billion) | Share 2025 | 2035 (USD billion) | CAGR 2025-2035 |
|---|---|---|---|---|
| Up to 69 kV | 1.53 | 27.6% | 2.90 | 6.59% |
| Above 69 kV to 230 kV | 2.74 | 49.3% | 6.43 | 8.91% |
| Above 230 kV | 1.28 | 23.1% | 4.90 | 14.32% |
By Insulation Type: Air-Insulated Substations Lead with 54.7%
| Insulation type | 2025 (USD billion) | Share 2025 | 2035 (USD billion) | CAGR 2025-2035 |
|---|---|---|---|---|
| Air-Insulated Substations (AIS) | 3.04 | 54.7% | 6.39 | 7.71% |
| Gas-Insulated Substations (GIS) | 1.85 | 33.2% | 5.17 | 10.84% |
| Hybrid and Modular Substations | 0.67 | 12.1% | 2.68 | 14.81% |
Gas-insulated and hybrid designs gain share on dense urban campuses, where land is scarce.
By Ownership: Customer-Owned Campus Substations Lead with 71.8%
Customer-owned campus substations are worth USD 3.99 billion (71.8%) in 2025 and USD 10.62 billion by 2035, growing at 10.28% a year. Utility-owned delivery substations are worth USD 1.57 billion (28.2%) and grow at 8.71% a year to USD 3.61 billion, as large-load rules shift more of the connection onto the customer’s side of the meter.
By Data Center Type: Hyperscale Data Centers Lead with 48.6%
| Data center type | 2025 (USD billion) | Share 2025 | 2035 (USD billion) | CAGR 2025-2035 |
|---|---|---|---|---|
| Hyperscale Data Centers | 2.70 | 48.6% | 6.70 | 9.51% |
| Colocation Data Centers | 1.46 | 26.3% | 3.24 | 8.30% |
| AI and GPU Cloud Data Centers | 0.90 | 16.2% | 3.50 | 14.54% |
| Enterprise and Edge Data Centers | 0.49 | 8.9% | 0.78 | 4.70% |
Hyperscale campuses connect at transmission voltage. Enterprise and edge sites grow slowest because most connect at distribution voltage and need little substation work of their own.
By Project Type: New Build Leads with 91.4%
New-build substations are worth USD 5.08 billion (91.4%) in 2025 and USD 12.11 billion by 2035, growing at 9.08% a year. Expansion and upgrade projects, which add transformers, bays and protection to energized campuses, are worth USD 478.04 million (8.6%) and grow at 16.06% a year to USD 2.12 billion.
DC Exclusive: The Substation Spend per MW Model and Component × Buyer Matrix
At USD 1.02 billion in 2025, power transformers for hyperscale campuses are the single largest cell of the matrix and 18.3% of all data center substation spending. It is a DC Market Insights model, not a shipment count: it is built from 53 inputs: 32 capacity cohorts (16 years of new-build and installed-base capacity from 2020 to 2035), 5 component cost shares, 4 buyer splits, 5 regional splits, 2 ownership splits, 4 grid-operator project cost estimates and a supplier order disclosure used as cross-checks.
| 2025, USD billion | Transformers | HV Switchgear | MV Switchgear | Protection and Control | Engineering and Construction | Total |
|---|---|---|---|---|---|---|
| Hyperscale Data Centers | 1.02 | 0.68 | 0.33 | 0.21 | 0.46 | 2.70 |
| Colocation Data Centers | 0.51 | 0.29 | 0.25 | 0.12 | 0.29 | 1.46 |
| AI and GPU Cloud Data Centers | 0.33 | 0.21 | 0.11 | 0.08 | 0.17 | 0.90 |
| Enterprise and Edge Data Centers | 0.16 | 0.09 | 0.09 | 0.05 | 0.10 | 0.49 |
| Total | 2.02 | 1.27 | 0.78 | 0.46 | 1.02 | 5.56 |
Hyperscale buyers spend 25.2% of their substation budget on high-voltage switchgear, against 18.0% for enterprise and edge sites, because they connect at transmission voltage. Colocation and enterprise buyers spend a larger share on medium-voltage switchgear, at 17.3% and 18.4%, because their buildings are fed at distribution voltage and divided among tenants.
The substation spend per MW model behind these figures has two inputs that any reader can check: IT capacity completed each year (12.0 GW in 2025 and 14.5 GW in 2026) and the substation spend per MW of IT load (USD 0.38 million in 2025). The model and its assumptions are explained on our research methodology page.
Regional Insights: Which Region Leads the Data Center Substation Market?
North America leads the Data Center Substation Market with 51.3% of 2025 value, and the Middle East and Africa is the fastest-growing region at 13.80% a year, because the region is adding campus-scale capacity with new transmission connections from a small installed base.
North America Leads with 51.3% Share
North American data centers spent USD 2.85 billion on substations in 2025, and the region is forecast to reach USD 6.50 billion by 2035, a CAGR of 8.60%. The United States hosted 15.9 GW of the 23.1 GW under construction worldwide at the end of September 2025, and Dominion Energy alone had 26 GW of data center demand in substation engineering by December 2024.
Asia Pacific Holds 24.6% Share
Asia Pacific is worth USD 1.37 billion in 2025 and USD 4.01 billion by 2035, a CAGR of 11.37%. BloombergNEF counted 3.2 GW under construction in Asia Pacific at the end of September 2025, slightly more than the 2.9 GW in Europe, the Middle East and Africa combined. In the DC Market Insights model, India, Malaysia and Japan add the most new substation spending outside China, and Asia Pacific gains 3.6 points of share by 2035, the largest gain of any region.
Europe Holds 15.4% Share
Europe is worth USD 856.02 million in 2025 and USD 2.08 billion by 2035, a CAGR of 9.27%. Grid connection queues, which the IEA describes as long and complex, cap the pace of new campuses, while the F-gas rules change the switchgear bill of materials on every new European project.
Latin America Holds 4.2% Share
Latin America is worth USD 233.46 million in 2025 and USD 725.84 million by 2035, a CAGR of 12.01%, led in the DC Market Insights model by Brazil at USD 101.56 million.
Middle East and Africa Holds 4.5% Share
The Middle East and Africa is worth USD 250.14 million in 2025 and USD 910.86 million by 2035, the fastest growth of any region. Saudi Arabia is the largest country market in the region at USD 67.79 million in 2025 in the DC Market Insights model, growing at 15.56% a year.
Country Analysis: Which Countries Spend the Most on Data Center Substations?
The United States is the largest country market for data center substations at USD 2.60 billion in 2025, 46.8% of global value, followed by China at USD 526.45 million (9.5%) and Canada at USD 250.93 million (4.5%). The 12 largest countries account for 81.8% of 2025 spending.
| Rank | Country | Region | 2025 (USD billion) | Share 2025 | 2035 (USD billion) | CAGR 2025-2035 |
|---|---|---|---|---|---|---|
| 1 | United States | North America | 2.60 | 46.8% | 5.83 | 8.40% |
| 2 | China | Asia Pacific | 0.53 | 9.5% | 1.33 | 9.73% |
| 3 | Canada | North America | 0.25 | 4.5% | 0.68 | 10.42% |
| 4 | Japan | Asia Pacific | 0.20 | 3.5% | 0.51 | 9.97% |
| 5 | Germany | Europe | 0.17 | 3.0% | 0.38 | 8.52% |
| 6 | United Kingdom | Europe | 0.16 | 2.9% | 0.36 | 8.36% |
| 7 | India | Asia Pacific | 0.16 | 2.9% | 0.70 | 15.98% |
| 8 | Australia | Asia Pacific | 0.13 | 2.4% | 0.40 | 11.60% |
| 9 | Brazil | Latin America | 0.10 | 1.8% | 0.30 | 11.40% |
| 10 | Malaysia | Asia Pacific | 0.10 | 1.8% | 0.35 | 13.31% |
| 11 | Ireland | Europe | 0.09 | 1.6% | 0.17 | 7.07% |
| 12 | Saudi Arabia | Middle East and Africa | 0.07 | 1.2% | 0.29 | 15.56% |
India is the fastest-growing large country market at 15.98% a year, ahead of Saudi Arabia at 15.56%, as hyperscale and colocation operators add capacity from a smaller installed base. Ireland grows slowest of the 12, at 7.07% a year, because the CRU connection policy requires new campuses to bring their own generation or storage. The country figures are a DC Market Insights allocation of the regional totals, weighted by each country’s estimated share of installed and new data center capacity.
Forecast Scenarios: How Could the 2035 Forecast Change?
The Data Center Substation Market reaches USD 14.23 billion by 2035 in the base case, with a range of USD 11.88 billion to USD 16.40 billion across the low and high scenarios.
| Scenario | Assumption from 2026 | 2035 (USD billion) | CAGR 2025-2035 |
|---|---|---|---|
| Low | Capacity additions 15% below base; more sites served from existing substations | 11.88 | 7.89% |
| Base | Additions rise to 27.0 GW a year; spend per MW reaches USD 0.44 million | 14.23 | 9.86% |
| High | Additions 12% above base; more connections above 230 kV | 16.40 | 11.42% |
The low case is what a two-year pause in AI capital spending looks like: completions slip and new campuses reuse spare capacity at existing substations. The high case assumes new transformer factories reach full output on time. On-site generation is the main swing factor, because a self-generating campus usually needs a smaller substation.
Competitive Insights: Who Leads the Data Center Substation Market?
- Hitachi Energy
- Siemens Energy
- GE Vernova
- Schneider Electric
- ABB
- Eaton
- Siemens
- Mitsubishi Electric
- Toshiba Energy Systems & Solutions
- HD Hyundai Electric
- LS Electric
- Hyosung Heavy Industries
- Powell Industries
- WEG
The three largest suppliers, Hitachi Energy, Siemens Energy and GE Vernova, together hold about 31% of the Data Center Substation Market in 2025 (DC Market Insights estimate, based on their position in high-voltage switchgear and large power transformers, which make up 59.2% of the market). GE Vernova’s Electrification segment booked USD 2.4 billion of equipment orders to support data centers in the first quarter of 2026, within total segment orders of USD 7.1 billion that rose 86% organically (Source: GE Vernova filing with the US Securities and Exchange Commission). Siemens Energy said the major contribution to its Grid Technologies order growth in the third quarter of fiscal 2026 came from its transformer business, including data center projects. Hitachi Energy is investing more than USD 1 billion in US grid equipment production, including about USD 457 million for a large power transformer facility in South Boston, Virginia. ABB named data center build-out a primary catalyst of its Electrification orders in the second quarter of 2026, and Eaton described data centers as a key growth driver. Schneider Electric, Mitsubishi Electric, Toshiba, HD Hyundai Electric, Hyosung Heavy Industries, Powell Industries and WEG compete in transformers, switchgear and power enclosures, and LS Electric signed a USD 76 million transformer order in November 2025 for US data centers, for delivery from 2026 to 2028.
Recent Developments
- In April 2025, Eaton completed its USD 1.4 billion acquisition of Fibrebond, a designer and builder of pre-integrated modular power enclosures, expanding its presence in modular solutions for hyperscale and multi-tenant data centers (Source: Eaton news release).
- In September 2025, Hitachi Energy announced more than USD 1 billion of US grid equipment investment, including about USD 457 million for a large power transformer facility in South Boston, Virginia (Source: Hitachi Energy press release).
- In November 2025, LS Electric reported a USD 312.04 million contract with a US power company for ultra-high-voltage transformers rated up to 525 kV, for a renewable power plant supplying a large data center in the southeastern United States (Source: Transformer Technology news report).
- In April 2026, GE Vernova reported USD 2.4 billion of Electrification equipment orders to support data centers in the first quarter (Source: GE Vernova SEC filing).
- In July 2026, ABB reported Electrification orders of USD 7.23 billion in the second quarter, up 60% (58% comparable), with data center build-out a primary catalyst (Source: ABB results release).
- In August 2026, Siemens reported Smart Infrastructure orders up 42% on a comparable basis to EUR 8.0 billion, including several large orders from data center customers in the US and Europe (Source: Siemens earnings release).
We follow these orders, factory investments and grid rules as they happen in our data center industry updates.
Methodology: How We Built the Data Center Substation Market Model
DC Market Insights built this market bottom-up from 16 annual capacity cohorts (2020 to 2035). Substation spend in each year weights 45% of that year’s IT capacity completions and 55% of the next year’s, because substations are energized ahead of the IT load, and prices them at a substation spend per MW of IT load that rises from USD 0.27 million in 2020 to USD 0.38 million in 2025 and USD 0.44 million by 2035. Upgrade spending was added on the installed base at 1.0% of new-build cost per MW per year in 2020, rising 0.04 points a year. The total was split by 5 components, 3 voltage levels, 3 insulation types, 2 ownership types, 4 data center types, 2 project types and 5 regions, and every split sums to the market total. The result was checked against a PJM Interconnection planning filing covering four new 230 kV data center substations and against the 23.1 GW construction pipeline counted by BloombergNEF. The analyst named on this page built the model, and the reviewer checked the arithmetic, the sources and the dates before publication.
Table of contents
- 01Introduction
- 1.1Market Definition and Scope
- 1.2Components, Voltage Levels and Buyers Covered
- 1.3Currency, Base Year and Forecast Period
- 1.4Key Questions Answered
- 02Research Methodology
- 2.1Substation Spend per MW Model
- 2.2Capacity Cohorts and Energization Timing
- 2.3Expansion and Upgrade Spending Model
- 2.4Checks Against Grid-Operator Cost Filings
- 2.5Assumptions and Limitations
- 03Executive Summary
- 3.1Market at a Glance, 2020-2035
- 3.2Key Findings
- 3.3Analyst Recommendations by Buyer Type
- 04Market Dynamics
- 4.1Drivers
- 4.2Challenges and Restraints
- 4.3Opportunities
- 4.4Trends
- 4.5Impact Analysis of Drivers and Challenges, 2025-2035
- 05Pricing and Cost Analysis
- 5.1Substation Spend per MW, 2025 and 2035
- 5.2Utility-Side vs Customer-Side Cost
- 5.3Transformer Price Trends
- 5.4Price Outlook by Component, 2026-2030
- 06Standards and Regulation
- 6.1IEEE 80 Substation Grounding
- 6.2IEC 61850 Substation Communication
- 6.3EU F-Gas Regulation and SF6-Free Switchgear
- 6.4Large-Load Interconnection Rules: Texas SB 6 and FERC RM26-4
- 6.5Ireland Data Center Connection Policy
- 07Supply Chain and Value Chain Analysis
- 7.1Power Transformer Manufacturing Capacity
- 7.2Switchgear and Protection Suppliers
- 7.3EPC Contractors and Integrators
- 7.4Lead Times and Reservation Agreements
- 08Global Data Center Substation Market Size and Forecast
- 8.1Market Size, 2020-2024
- 8.2Market Size, 2025
- 8.3Market Forecast, 2026-2035
- 8.4New-Build vs Expansion and Upgrade Spending
- 09Market by Component
- 9.1Power Transformers
- 9.2High-Voltage Switchgear
- 9.3Medium-Voltage Switchgear
- 9.4Protection, Control and Automation
- 9.5Engineering, Construction and Commissioning
- 10Market by Voltage Level
- 10.1Up to 69 kV
- 10.2Above 69 kV to 230 kV
- 10.3Above 230 kV
- 11Market by Insulation Type
- 11.1Air-Insulated Substations (AIS)
- 11.2Gas-Insulated Substations (GIS)
- 11.3Hybrid and Modular Substations
- 12Market by Ownership
- 12.1Customer-Owned Campus Substations
- 12.2Utility-Owned Delivery Substations
- 13Market by Data Center Type
- 13.1Hyperscale Data Centers
- 13.2Colocation Data Centers
- 13.3AI and GPU Cloud Data Centers
- 13.4Enterprise and Edge Data Centers
- 14Market by Project Type
- 14.1New Build
- 14.2Expansion and Upgrade
- 15DC Exclusive: Component × Buyer Matrix
- 15.1Component × Data Center Type Matrix, 2025
- 15.2Implications for Suppliers
- 16Market by Region
- 16.1North America (United States, Canada, Mexico)
- 16.2Europe (Germany, United Kingdom, Ireland, Netherlands, France, Nordics, Rest of Europe)
- 16.3Asia Pacific (China, Japan, India, Australia, Malaysia, Singapore, South Korea, Rest of Asia Pacific)
- 16.4Latin America (Brazil, Chile, Colombia, Rest of Latin America)
- 16.5Middle East and Africa (Saudi Arabia, UAE, South Africa, Rest of Middle East and Africa)
- 16.6Top 12 Countries, 2025 and 2035
- 17Regional Cross-Sections
- 17.1Region × Component, 2025 and 2035
- 17.2Region × Data Center Type, 2025 and 2035
- 18Forecast Scenarios
- 18.1Base, Low and High Cases to 2035
- 18.2Sensitivity to Capacity Additions
- 18.3Sensitivity to Substation Spend per MW
- 18.4On-Site Generation and Substation Sizing
- 19Competitive Landscape
- 19.1Market Share of Leading Suppliers, 2025
- 19.2Top-Three Concentration
- 19.3Acquisitions, Investments and Orders, 2025-2026
- 20Company Profiles
- 20.1Hitachi Energy
- 20.2Siemens Energy
- 20.3GE Vernova
- 20.4Schneider Electric
- 20.5ABB
- 20.6Eaton
- 20.7Siemens
- 20.8Mitsubishi Electric
- 20.9Toshiba Energy Systems & Solutions
- 20.10HD Hyundai Electric
- 20.11LS Electric
- 20.12Hyosung Heavy Industries
- 20.13Powell Industries
- 20.14WEG
- 21Analyst Recommendations
- 21.1For Equipment Suppliers
- 21.2For Hyperscale and Colocation Operators
- 21.3For Utilities and Investors
- Fig. 1Data Center Substation Market Size, 2020-2035
- Fig. 2IT Capacity Completed per Year, 2020-2035
- Fig. 3Substation Spend per MW, 2025 and 2035
- Fig. 4New-Build vs Expansion and Upgrade Spending, 2020-2035
- Fig. 5Market Share by Component, 2025 and 2035
- Fig. 6Market Share by Voltage Level, 2025 and 2035
- Fig. 7Component × Data Center Type Matrix, 2025
- Fig. 8Market by Region, 2025 and 2035
- Fig. 9Forecast Scenarios, 2035
- Fig. 10Top 12 Countries, 2025
- Table 1Report Attributes
- Table 2Substation Spend per MW, 2025 and 2035
- Table 3Market by Component, 2025 and 2035
- Table 4Market by Voltage Level, 2025 and 2035
- Table 5Market by Insulation Type, 2025 and 2035
- Table 6Market by Ownership, 2025 and 2035
- Table 7Market by Data Center Type, 2025 and 2035
- Table 8Market by Project Type, 2025 and 2035
- Table 9Component × Data Center Type Matrix, 2025
- Table 10Market by Region, 2025 and 2035
- Table 11Top 12 Countries, 2025 and 2035
- Table 12Forecast Scenarios, 2035
- Table 13Acquisitions, Investments and Orders, 2025-2026
About this report
Written by Satyabrat Rajawat and reviewed by Deepti Agrawal, Senior Editor, Research. Figures are built top-down and bottom-up and reconciled before publication, with 2025 as the base year.
Read our methodologyHow we built this
- Historical period2020-2024
- Base year2025
- Forecast period2026-2035
- Sizing approachTop-down + bottom-up
Need more than the report?
Advisory on this market
Due diligence, site selection and market entry work, by the analysts who wrote this report.
See consulting servicesFrequently asked questions
USD 5.56 billion in 2025, rising to USD 14.23 billion by 2035. DC Market Insights estimates the market at USD 1.66 billion in 2020.
9.86% a year from 2025 to 2035. Growth was faster, at 27.29% a year, between 2020 and 2025 as campuses of several hundred megawatts became the standard unit of construction.
About USD 0.38 million per MW of IT load in 2025, of which about USD 0.11 million per MW sits on the utility side, according to DC Market Insights estimates.
Power transformers, with USD 2.02 billion or 36.4% of the market in 2025. Protection, control and automation grows fastest among components at 12.15% a year.
North America, with USD 2.85 billion or 51.3% of 2025 value. The Middle East and Africa grows fastest at 13.80% a year.
14.32% a year is the DC Market Insights growth forecast for substations above 230 kV, from USD 1.28 billion in 2025 to USD 4.90 billion by 2035, because the largest AI campuses connect at transmission voltage.
About 31% of the market is held by Hitachi Energy, Siemens Energy and GE Vernova together (DC Market Insights estimate). Schneider Electric, ABB, Eaton, Siemens, Mitsubishi Electric, HD Hyundai Electric, LS Electric and Hyosung Heavy Industries also compete.
USD 2.60 billion in the United States, or 46.8% of 2025 spending, followed by China at USD 526.45 million. India grows fastest among large country markets at 15.98% a year (DC Market Insights estimate).
Licences, delivery and payment
Which licence should I choose?
Single User is a view-only PDF for one person. Multi User adds a printable PDF and the Excel data for unlimited users at one location. Enterprise covers your whole company and includes 100 free analyst hours.
How and when will I receive the report?
By email, within 24–48 business hours of payment, in the formats of your licence.
How can I pay?
Securely through PayPal: with a PayPal account, a debit or credit card, or PayPal Pay Later where available. Prices are in US dollars.
Can I see a sample first?
Yes. Request a free sample and we will email it to you.
Can the report be tailored to my needs?
Yes. We can add countries, segments or data cuts. Talk to an analyst about the scope you need.
Can I get an invoice or pay against a purchase order?
Write to sales@dcmarketinsights.com and our team will help.