
Data Center Generator Market Size, Share & Forecast to 2035
Market at a glance
The Data Center Generator market was worth USD 8,310.0 million in 2025 and is forecast to reach USD 19.92 billion by 2035, growing at a 9.13% CAGR. North America accounts for 44.1% of the market.
 By Satyabrat Rajawat, Senior Research Analyst, Strategic Advisory
 Reviewed by Deepti Agrawal
Last updated 7 Oct 2026
Base year 2025 PDF + Excel
Reviewed by Deepti Agrawal
Last updated 7 Oct 2026
Base year 2025 PDF + Excel
Source: DC Market Insights analysis
Key findings
Annual Capacity Additions Rise from 12.0 GW to 27.0 GW and Drive USD 14.69 Billion of New-Build Generator Spend
Generator Sets Above 3 MW Grow at 15.08% a Year
Generator Spend per MW in AI Halls Falls from USD 0.550 Million to USD 0.500 Million
Natural Gas Generator Sets Grow from USD 1.01 Billion to USD 6.02 Billion
What is inside the report
- 01Introduction
- 02Research Methodology
- 03Executive Summary
- 04Market Dynamics
- 05Pricing Analysis
- 06Standards and Regulation
- 07Supply Chain Analysis
- 08Market Size and Forecast
- 09Market by Application
- 10Market by Fuel Type
- 21chapters
- 2020-2024Historical period
- 2026-2035Forecast period
- 12Companies profiled
Regional insights
- North America44.1%
- Asia Pacific27.9%
- Europe18.6%
- Latin America4.8%
- Middle East and Africa4.6%
Segmentation
Companies profiled
- Caterpillar
- Cummins
- Rolls-Royce Power Systems
- Generac
- Rehlko
- Mitsubishi Heavy Industries (MHIET)
- HITEC Power Protection (diesel rotary UPS)
- Himoinsa
- Atlas Copco
- Aggreko
- Kirloskar Oil Engines
- Wärtsilä
Recent developments
the US EPA clarified that certain engines can operate up to 50 hours a year in non-emergency conditions under qualifying demand response programs (Source: EPA news release).
Rolls-Royce announced a USD 24 million investment in Mankato, Minnesota, to more than double production of generator sets for data centers (Source: Rolls-Royce press release).
Power Engineering reported that Joule Capital Partners' Utah data center campus, which would eventually provide 4 GW, would be powered by a fleet of Caterpillar G3520K generator sets with 1.1 GWh of battery storage (Source: Power Engineering report).
Caterpillar announced a USD 725 million expansion of its Lafayette, Indiana large engine plant to serve power generation demand including data centers (Source: Caterpillar news release).
Ireland's CRU published its Large Energy Users Connection Policy, requiring new data centers of 1 MVA or more to match 100% of their maximum import capacity with dispatchable onsite or proximate generation and/or storage (Source: DLA Piper legal briefing).
Full analysis
The Data Center Generator Market covers the engine-driven generator sets that data centers install to carry IT and cooling load when the grid fails or is unavailable, together with their enclosures, fuel systems, paralleling controls and emissions aftertreatment. DC Market Insights values the global Data Center Generator Market at USD 8.31 billion in 2025 and forecasts USD 19.92 billion by 2035, a CAGR of 9.13%. The 2025 value is built from the build itself: about 12.0 GW of new IT capacity at roughly USD 0.620 million of generator equipment per MW in conventional halls and USD 0.550 million per MW in AI halls gives USD 7.15 billion of new-build spend, replacement and upgrades on an installed base of about 119.5 GW add USD 549.59 million, and on-site prime and bridge power adds USD 618.40 million. Natural gas generators are the fastest-growing segment at 19.58% a year because DC Market Insights expects AI campuses that cannot wait for a grid connection to run gas engines as their main power source, and the Middle East and Africa is the fastest-growing region at 11.88% a year because DC Market Insights expects new AI campus capacity there to grow from a small base.
Executive Summary
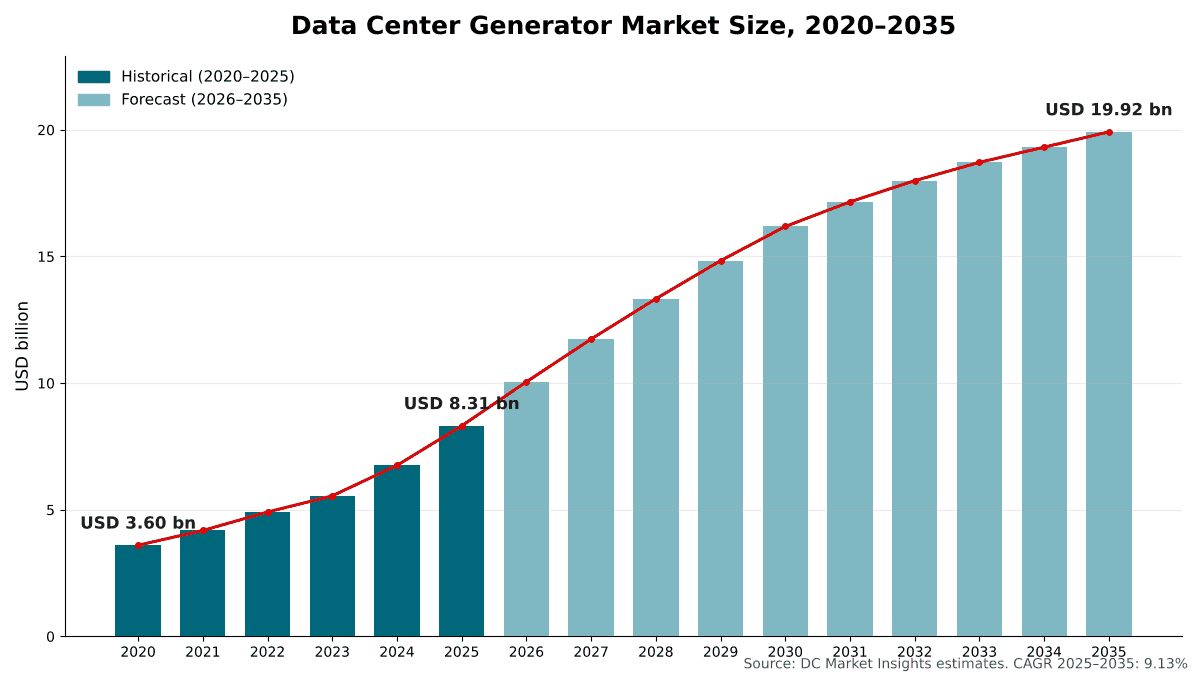
The Global Data Center Generator Market size was valued at USD 3.60 billion in 2020, reached USD 8.31 billion in 2025, and is anticipated to reach USD 19.92 billion by 2035, at a CAGR of 9.13% during the forecast period.
| Report attribute | Details |
|---|---|
| Historical Period | 2020-2024 |
| Base Year | 2025 |
| Forecast Period | 2026-2035 |
| Data Center Generator Market Size 2025 | USD 8.31 Billion |
| Data Center Generator Market, CAGR | 9.13% |
| Data Center Generator Market Size 2035 | USD 19.92 Billion |
The Data Center Generator Market grew at 18.23% a year between 2020 and 2025, and 2025 alone added 23.1% over 2024 as graphics processing unit (GPU) clusters moved from pilot halls to campus-scale builds and gas-fired prime power projects began ordering engines. In the DC Market Insights model, growth slows to 9.13% a year to 2035 because AI halls buy less standby generation per MW and diesel standby sets become a replacement and upgrade business on a much larger installed base. Annual capacity additions still more than double, from 12.0 GW in 2025 to 27.0 GW in 2035, and the installed base grows to about 315.3 GW.
Backup generation matters more as data centers take a larger share of the grid. The International Energy Agency (IEA) reports that data centers used around 415 terawatt-hours (TWh) in 2024, about 1.5% of world electricity, and expects consumption to more than double to around 945 TWh by 2030.
Market Scope: What Does the Data Center Generator Market Cover?
The Data Center Generator Market covers every engine-driven generator set installed to supply data center load, valued at first sale in current US dollars, with 2025 as the base year and forecasts to 2035. DC Market Insights sizes it at USD 8.31 billion in 2025.
Included. Diesel, natural gas and bi-fuel reciprocating generator sets used for emergency standby, prime power, bridge power before a grid connection, and peak shaving or grid support; the engine and alternator; acoustic and weatherproof enclosures; base, day and bulk fuel tanks; generator controls and paralleling controls; selective catalytic reduction and particulate filters; and the replacement of generator sets and major components on installed sites.
Excluded. Uninterruptible power supply (UPS) systems and their batteries, medium-voltage switchgear and automatic transfer switches, gas turbines, fuel cells, utility-scale battery storage, fuel purchases, installation labor and multi-year service contracts.
How the segments fit together. The application, fuel type, power rating, component and data center type splits each re-cut the same USD 8.31 billion. Prime and bridge power appears both as an application and, mostly, inside the natural gas fuel segment.
Market Drivers: What Drives the Data Center Generator Market?
Three drivers explain most of the growth in the Data Center Generator Market: capacity additions that more than double to 27.0 GW a year by 2035, gas-fired prime and bridge power that grows to USD 3.40 billion, and grid rules that turn standby generators into grid resources.
Annual Capacity Additions Rise from 12.0 GW to 27.0 GW and Drive USD 14.69 Billion of New-Build Generator Spend
The Data Center Generator Market is a build market: 86.0% of 2025 spending went into new halls. BloombergNEF counted more than 23 gigawatts (GW) of data center capacity under construction globally at the end of September 2025, with 15.9 GW of it in the United States, and more than 3.8 GW entered construction in the third quarter of 2025 alone, 58% above the quarterly average so far this decade. DC Market Insights models annual completions rising from 12.0 GW in 2025 to 22.0 GW in 2030 and 27.0 GW in 2035, which lifts new-build generator spend from USD 7.15 billion to USD 14.69 billion. Supplier results show the same pull: Caterpillar reported that sales increased in large reciprocating engines and in turbines and turbine-related services, primarily in data center applications, as its Power and Energy segment sales rose 17% to USD 8.24 billion in the second quarter of 2026 (Source: Caterpillar filing with the US Securities and Exchange Commission).
Gas-Fired Prime and Bridge Power Grows from USD 618.40 Million to USD 3.40 Billion
Some AI campuses now order generators as their main power plant, not only as backup. Joule Capital Partners’ Utah campus, which would eventually provide 4 GW of power, would be powered by a fleet of Caterpillar G3520K generator sets with 1.1 gigawatt-hours (GWh) of battery storage and combined cooling, heat and power, as Power Engineering reported in August 2025. DC Market Insights estimates that prime and bridge power was worth USD 618.40 million, or 7.4% of the market, in 2025 and grows at 18.57% a year to 17.0% of the market by 2035.
Grid Rules Turn Standby Fleets into Grid Resources
Regulators now treat data center generators as part of grid planning. The US Environmental Protection Agency (EPA) clarified in May 2025 that certain engines can operate for up to 50 hours per year in non-emergency conditions and that Duke Energy’s demand response program meets the criteria (Source: EPA news release). Inside Climate News reported in January 2026 that the US Department of Energy (DOE) has identified more than 35 GW of backup power at data center and industrial sites that can be used during emergencies to stabilize the grid. DC Market Insights expects these rules to lift spend on controls, paralleling and emissions aftertreatment faster than spend on the generator sets themselves.
Market Trends: How Is Data Center Generator Technology Changing?
The Data Center Generator Market is moving to generator sets above 3 MW, which grow at 15.08% a year, to renewable diesel and gas fuels, and to plants that run every day rather than a few hours a year.
Generator Sets Above 3 MW Grow at 15.08% a Year
Vendors keep raising the size of single generator sets for data center halls. Mitsubishi Heavy Industries Engine and Turbocharger rates its 3,000 kVA-class MGS3100R at 3,025 kVA for standby power and 2,750 kVA for prime or data center continuous power at 50 Hz, with 10-second starting. Rehlko now offers a KD Series lineup from 60 kW to over 4 MW. DC Market Insights forecasts generator sets above 3 MW to grow from USD 1.97 billion in 2025 to USD 8.03 billion in 2035, the fastest of the four power rating classes, because larger blocks cut the number of engines, enclosures and fuel connections per megawatt.
Hydrotreated Vegetable Oil Replaces Fossil Diesel in Existing Fleets
Operators are cutting generator emissions without replacing engines. EcoDataCenter switched the fuel in the 32 mtu generator sets at its Falun, Sweden site from fossil diesel to hydrotreated vegetable oil (HVO), and Rolls-Royce indicated that HVO100 can reduce lifecycle greenhouse gas emissions by up to 95% compared with fossil diesel, Power Progress reported. DC Market Insights expects HVO to keep diesel generator sets at 63.7% of value in 2035 even as natural gas takes share.
Engine Makers Add Capacity for Data Center Demand
Caterpillar announced a USD 725 million expansion of its Lafayette, Indiana engine plant in October 2025 and said that many of its engines will support power generation for AI, data centers and other critical infrastructure. Rolls-Royce said it would invest USD 24 million in Mankato, Minnesota, to more than double production, and that production there will increase by more than 120% by 2026 (Source: Rolls-Royce press release).
Market Challenges: What Holds the Data Center Generator Market Back?
Lower generator spend per MW in AI halls, air permit scrutiny and slow enterprise demand hold Data Center Generator Market growth to 9.13% a year, half the 18.23% of 2020 to 2025.
Generator Spend per MW in AI Halls Falls from USD 0.550 Million to USD 0.500 Million
AI halls buy fewer generator dollars per MW than conventional halls in the DC Market Insights model, which assumes less standby redundancy for training clusters, larger generator blocks and a growing share of campuses that use on-site gas or batteries instead of a full diesel fleet. DC Market Insights models AI-hall generator spend at USD 0.550 million per MW in 2025, 11.3% below the USD 0.620 million of a conventional hall, falling to USD 0.500 million by 2035. As AI halls rise from 35% to 66% of new capacity, the average new-build spend per MW drops even as total megawatts climb.
Air Permits and Local Opposition Slow Diesel Fleets
Ivy Main of the Sierra Club’s Virginia chapter wrote in a Virginia Mercury commentary in January 2026 that Northern Virginia’s 4,000-plus diesel generators add up to more than 11 GW of capacity and that one Amazon permit covers 173 generators at a single data center. Inside Climate News reported, citing new research, that the Virginia Department of Environmental Quality issued 170 air permits for data centers with generators as of June 2025, about 138 of them in Northern Virginia. DC Market Insights expects permit conditions to push new projects toward Tier 4 aftertreatment, renewable diesel and gas engines, which is why diesel grows only 6.18% a year.
Enterprise Data Centers Grow at Only 2.91% a Year
DC Market Insights estimates that enterprise data centers bought USD 1.55 billion of generators in 2025, 18.7% of the market, and expects their demand to grow at only 2.91% a year to USD 2.07 billion in 2035 as workloads move to cloud and colocation.
Market Opportunities: Where Are the New Revenue Pools in Data Center Generators?
The two largest new revenue pools in the Data Center Generator Market are natural gas generator sets, growing at 19.58% a year, and GPU and neocloud operators, growing at 13.46% a year.
Natural Gas Generator Sets Grow from USD 1.01 Billion to USD 6.02 Billion
The Large Energy Users Connection Policy of Ireland’s Commission for Regulation of Utilities (CRU) requires new data centers of 1 megavolt-ampere (MVA) or more to provide new dispatchable onsite or proximate generation and/or storage matching 100% of their maximum import capacity on a de-rated basis, and to source renewable electricity for at least 80% of their annual demand. DC Market Insights expects similar connection rules and grid queues elsewhere to favor gas engines that can run for long periods, and forecasts natural gas to rise from 12.1% of the market in 2025 to 30.2% by 2035.
GPU and Neocloud Operators Spend USD 2.41 Billion on Generators by 2035
DC Market Insights estimates that specialist GPU cloud operators spent USD 681.75 million on generators in 2025 and expects their spend to reach USD 2.41 billion in 2035, more than three times the 2025 level. DC Market Insights expects these operators to buy most of their capacity in 2-3 MW and above 3 MW blocks, close to the hyperscale pattern.
Pricing: How Much Do Data Centers Spend on Generators per MW?
A conventional data center hall spends about USD 0.620 million on generator equipment per MW of IT load in 2025, and an AI hall spends about USD 0.550 million per MW. These are DC Market Insights estimates covering generator sets, enclosures, fuel systems, controls and aftertreatment, excluding switchgear, installation labor and fuel.
| Generator spend per MW (USD million) | 2020 | 2025 | 2030 | 2035 |
|---|---|---|---|---|
| Conventional hall (new build) | 0.540 | 0.620 | 0.640 | 0.630 |
| AI hall (new build) | 0.500 | 0.550 | 0.530 | 0.500 |
| Replacement and upgrades per MW of installed base, per year | 0.0040 | 0.0046 | 0.0052 | 0.0058 |
| AI share of new capacity | 3% | 35% | 60% | 66% |
In the DC Market Insights model, spend per MW rises to 2025 as engine demand outruns factory capacity, then flattens as new engine plants come online.
Standards and Regulation: Which Rules Shape the Data Center Generator Market?
Four sets of rules shape how data center generators are specified and run: the ISO 8528-1 rating standard, the NFPA 110 standard for emergency and standby power, US engine emissions rules and new grid connection rules for large energy users.
ISO 8528-1:2018. The International Organization for Standardization (ISO) standard covers reciprocating internal combustion engine driven alternating current generating sets and their application, ratings and performance, for sets used in continuous, peak-load and standby applications. ISO lists the 2018 edition as current and to be revised.
NFPA 110-2025. The National Fire Protection Association (NFPA) standard covers performance requirements for emergency and standby power systems that provide an alternate source of power when the normal source fails.
US EPA engine rules. The EPA’s May 2025 clarification of the National Emission Standards for Hazardous Air Pollutants (NESHAP) for reciprocating internal combustion engines confirmed that certain engines can run up to 50 hours a year in non-emergency conditions under qualifying demand response programs.
Ireland CRU Large Energy Users Connection Policy. The policy requires new data centers of 1 MVA or more to match 100% of their maximum import capacity with dispatchable onsite or proximate generation and/or storage. DC Market Insights expects it to make on-site dispatchable capacity a condition of grid access in Ireland, not only a resilience choice.
Market Segmentation: Which Segment Leads the Data Center Generator Market?
Emergency standby leads the Data Center Generator Market with 89.6% of 2025 value, diesel leads fuels with 83.8%, and 2-3 MW generator sets are the largest power rating class at 46.2%. Natural gas generator sets are the fastest-growing segment at 19.58% a year, because DC Market Insights expects AI campuses to use gas engines for prime and bridge power where grid connections are years away.
By Application: Emergency Standby Leads with 89.6%
| Application | 2025 (USD billion) | Share 2025 | 2035 (USD billion) | CAGR 2025-2035 |
|---|---|---|---|---|
| Emergency Standby | 7.45 | 89.6% | 15.43 | 7.56% |
| Prime and Bridge Power | 0.62 | 7.4% | 3.40 | 18.57% |
| Peak Shaving and Grid Support | 0.25 | 3.0% | 1.10 | 15.95% |
Prime and bridge power gains 9.6 points of share, and peak shaving and grid support rises to 5.5% as utilities enroll data center generators in demand response programs.
By Fuel Type: Diesel Leads with 83.8%
Diesel generator sets, including sets running on renewable diesel, are worth USD 6.97 billion (83.8%) in 2025 and USD 12.69 billion by 2035, growing at 6.18% a year. Natural gas generator sets are worth USD 1.01 billion (12.1%) and grow at 19.58% a year to USD 6.02 billion. Bi-fuel and other generator sets are worth USD 340.87 million (4.1%) and grow at 13.55% a year to USD 1.22 billion.
By Power Rating: 2-3 MW Leads with 46.2%
| Power rating | 2025 (USD billion) | Share 2025 | 2035 (USD billion) | CAGR 2025-2035 |
|---|---|---|---|---|
| Below 1 MW | 1.31 | 15.8% | 1.95 | 4.04% |
| 1-2 MW | 1.19 | 14.3% | 1.81 | 4.31% |
| 2-3 MW | 3.84 | 46.2% | 8.13 | 7.78% |
| Above 3 MW | 1.97 | 23.7% | 8.03 | 15.08% |
By Component: Generator Sets Lead with 68.2%
Generator sets (engine and alternator) are worth USD 5.67 billion (68.2%) in 2025 and USD 13.31 billion by 2035, growing at 8.90% a year. Enclosures and fuel systems are worth USD 1.31 billion (15.7%) and grow at 8.63% a year to USD 2.99 billion. Controls and paralleling are worth USD 764.89 million (9.2%) and grow at 10.15% a year, and emissions aftertreatment, worth USD 573.67 million (6.9%), grows fastest at 10.89% a year to USD 1.61 billion as permits require catalysts on sets that run more often.
By Data Center Type: Hyperscale Data Centers Lead with 38.9%
| Data center type | 2025 (USD billion) | Share 2025 | 2035 (USD billion) | CAGR 2025-2035 |
|---|---|---|---|---|
| Hyperscale Data Centers | 3.23 | 38.9% | 8.72 | 10.43% |
| Colocation Data Centers | 2.34 | 28.1% | 5.40 | 8.74% |
| Enterprise Data Centers | 1.55 | 18.7% | 2.07 | 2.91% |
| Edge Data Centers | 0.51 | 6.1% | 1.31 | 9.99% |
| GPU and Neocloud Providers | 0.68 | 8.2% | 2.41 | 13.46% |
Hyperscale data centers gain 4.9 points of share by 2035.
DC Exclusive: The Generator Spend per MW Model and Power Rating × Buyer Matrix
At USD 1.74 billion in 2025, hyperscale spend on 2-3 MW generator sets is the single largest cell of the matrix and 20.9% of all data center generator spending. The matrix of generator size by buyer is a DC Market Insights model, not a shipment count, built from 64 inputs: 32 capacity cohorts (16 years of conventional and AI halls), 3 spend-per-MW curves, 16 years of prime and bridge power spend, 4 power rating classes, 5 buyer types and 4 supplier disclosures used as a growth cross-check.
| 2025, USD billion | Below 1 MW | 1-2 MW | 2-3 MW | Above 3 MW | Total |
|---|---|---|---|---|---|
| Hyperscale Data Centers | 0.07 | 0.23 | 1.74 | 1.19 | 3.23 |
| Colocation Data Centers | 0.14 | 0.36 | 1.37 | 0.47 | 2.34 |
| Enterprise Data Centers | 0.70 | 0.45 | 0.35 | 0.05 | 1.55 |
| Edge Data Centers | 0.39 | 0.09 | 0.03 | 0.00 | 0.51 |
| GPU and Neocloud Providers | 0.01 | 0.06 | 0.35 | 0.26 | 0.68 |
| Total | 1.31 | 1.19 | 3.84 | 1.97 | 8.31 |
Hyperscale buyers spend 36.8% of their generator budget on sets above 3 MW, while enterprise data centers still spend 45.2% on sets below 1 MW; a vendor strong in small standby sets is selling into the slowest-growing buyer. GPU and neocloud providers put 38.2% of their spend into sets above 3 MW, close to the hyperscale pattern.
The model multiplies new capacity (12.0 GW in 2025) and its AI share (35%) by generator spend per MW, adds replacement and upgrade spend on the installed base, then adds prime and bridge power projects. The model and its assumptions are explained on our research methodology page.
Regional Insights: Which Region Leads the Data Center Generator Market?
North America leads the Data Center Generator Market with 44.1% of 2025 value, and the Middle East and Africa is the fastest-growing region at 11.88% a year, because DC Market Insights expects AI campus capacity there to grow from a small base.
North America Leads with 44.1% Share
DC Market Insights estimates that North American operators spent USD 3.67 billion on generators in 2025, and the region is forecast to reach USD 8.25 billion in 2035, a CAGR of 8.44%. BloombergNEF reports that the United States alone hosts 15.9 GW of ongoing data center construction. Generac said it expects its commercial and industrial product sales to increase in the 30% range in 2026, primarily due to increased revenue from products sold to data center customers and the acquisition of Allmand.
Asia Pacific Holds 27.9% Share
Asia Pacific is worth USD 2.32 billion in 2025 and USD 6.11 billion by 2035, a CAGR of 10.18%. China is the largest market in the region at USD 932.48 million, and India grows fastest at 14.34% a year in the DC Market Insights country allocation. Cummins reported that its Power Systems sales rose 19% to USD 2.3 billion in the second quarter of 2026, driven primarily by power generation demand for data center markets in the United States, China and Asia Pacific. Asia Pacific gains 2.8 points of share, the largest gain of any region.
Europe Holds 18.6% Share
Europe is worth USD 1.55 billion in 2025 and USD 3.35 billion by 2035, a CAGR of 8.02%. The United Kingdom and Germany are the largest country markets in the region in the DC Market Insights country allocation.
Latin America Holds 4.8% Share
Latin America is worth USD 399.07 million in 2025 and USD 1.04 billion by 2035, a CAGR of 10.01%.
Middle East and Africa Holds 4.6% Share and Grows Fastest
The Middle East and Africa is worth USD 382.44 million in 2025 and USD 1.18 billion by 2035. In the DC Market Insights allocation, Saudi Arabia leads the region with USD 100.20 million and grows at 13.56% a year to USD 357.25 million.
Country Analysis: Which Countries Buy the Most Data Center Generators?
The United States is the largest country market for data center generators at USD 3.25 billion in 2025, 39.1% of global value, followed by China at USD 932.48 million (11.2%) and Canada at USD 370.31 million (4.5%). The 12 largest countries account for 78.0% of 2025 spending.
| Rank | Country | Region | 2025 (USD billion) | Share 2025 | 2035 (USD billion) | CAGR 2025-2035 |
|---|---|---|---|---|---|---|
| 1 | United States | North America | 3.25 | 39.1% | 7.18 | 8.25% |
| 2 | China | Asia Pacific | 0.93 | 11.2% | 2.25 | 9.21% |
| 3 | Canada | North America | 0.37 | 4.5% | 0.96 | 9.95% |
| 4 | United Kingdom | Europe | 0.33 | 3.9% | 0.67 | 7.45% |
| 5 | Japan | Asia Pacific | 0.30 | 3.7% | 0.73 | 9.13% |
| 6 | Germany | Europe | 0.29 | 3.5% | 0.64 | 8.20% |
| 7 | India | Asia Pacific | 0.23 | 2.7% | 0.87 | 14.34% |
| 8 | Australia | Asia Pacific | 0.19 | 2.3% | 0.53 | 10.84% |
| 9 | Brazil | Latin America | 0.18 | 2.2% | 0.45 | 9.69% |
| 10 | France | Europe | 0.17 | 2.0% | 0.39 | 8.70% |
| 11 | Netherlands | Europe | 0.15 | 1.7% | 0.28 | 6.69% |
| 12 | Saudi Arabia | Middle East and Africa | 0.10 | 1.2% | 0.36 | 13.56% |
India is the fastest-growing large country market at 14.34% a year, ahead of Saudi Arabia at 13.56%. The country figures are a DC Market Insights allocation of the regional totals, weighted by each country’s estimated share of installed and new data center capacity.
Forecast Scenarios: How Could the 2035 Data Center Generator Forecast Change?
The Data Center Generator Market reaches USD 19.92 billion by 2035 in the base case, with a range of USD 16.51 billion to USD 23.32 billion across the low and high scenarios.
| Scenario | Assumption from 2026 | 2035 (USD billion) | CAGR 2025-2035 |
|---|---|---|---|
| Low | Capacity additions 15% below base; prime and bridge power 30% below base as grid connections speed up | 16.51 | 7.10% |
| Base | Additions rise to 27.0 GW a year; AI share of new capacity reaches 66% | 19.92 | 9.13% |
| High | Additions 15% above base; prime and bridge power 30% above base as more campuses run on site | 23.32 | 10.87% |
The low case is a two-year pause in AI capital spending combined with faster grid connections that reduce the need for bridge power.
Competitive Insights: Who Leads the Data Center Generator Market?
- Caterpillar
- Cummins
- Rolls-Royce Power Systems
- Generac
- Rehlko
- Mitsubishi Heavy Industries (MHIET)
- HITEC Power Protection (diesel rotary UPS)
- Himoinsa
- Atlas Copco
- Aggreko
- Kirloskar Oil Engines
- Wärtsilä
DC Market Insights estimates that Caterpillar, Cummins and Rolls-Royce Power Systems are the three largest suppliers and together hold about 60% of the Data Center Generator Market in 2025 (based on each supplier’s range of large high-speed engines above 2 MW and its disclosed data center growth, set against the USD 8.31 billion market). Caterpillar reported Power and Energy sales of USD 8.24 billion in the second quarter of 2026, up 17%, and Facilities Dive reported that its power generation retail sales grew 72% in the quarter. Cummins reported Power Systems sales of USD 2.3 billion, up 19%, driven primarily by power generation demand, particularly for data center markets. Rolls-Royce said that sales of its power generation products for the data center segment grew almost 50% in 2024 and that its data center generator sets built in Mankato use mtu Series 4000 engines. Generac began shipping new large-megawatt generators to the data center market in the third quarter of 2025 and said its backlog for these products doubled over 90 days.
Recent Developments
- In May 2025, the US EPA clarified that certain engines can operate up to 50 hours a year in non-emergency conditions under qualifying demand response programs (Source: EPA news release).
- In June 2025, Rolls-Royce announced a USD 24 million investment in Mankato, Minnesota, to more than double production of generator sets for data centers (Source: Rolls-Royce press release).
- In August 2025, Power Engineering reported that Joule Capital Partners’ Utah data center campus, which would eventually provide 4 GW, would be powered by a fleet of Caterpillar G3520K generator sets with 1.1 GWh of battery storage (Source: Power Engineering report).
- In October 2025, Caterpillar announced a USD 725 million expansion of its Lafayette, Indiana large engine plant to serve power generation demand including data centers (Source: Caterpillar news release).
- In December 2025, Ireland’s CRU published its Large Energy Users Connection Policy, requiring new data centers of 1 MVA or more to match 100% of their maximum import capacity with dispatchable onsite or proximate generation and/or storage (Source: DLA Piper legal briefing).
We follow these deals, launches and capacity announcements as they happen in our data center industry updates. Related coverage of ride-through equipment is in the Data Center UPS Market report, and alternative on-site power is covered in the Small Modular Reactor Market report.
Methodology: How We Built the Data Center Generator Market Model
DC Market Insights built the Data Center Generator Market bottom-up from 16 annual capacity cohorts (2020 to 2035), each split into conventional and AI halls and priced with the generator spend per MW curves in the pricing table. Replacement and upgrade spend was added on an installed base that starts from 74.0 GW at the beginning of 2020, retires 1.1% a year and reaches 315.3 GW in 2035, and prime and bridge power projects were added as a separate annual series. The total was split by 3 applications, 3 fuel types, 4 power rating classes, 4 components, 5 data center types and 5 regions, and every split sums to the market total. The result was checked top-down against the disclosed growth of 4 listed suppliers (Caterpillar, Cummins, Rolls-Royce and Generac) and against published capacity counts: the model’s 20.9% growth for 2026 sits between Caterpillar’s 17% Power and Energy growth and Generac’s expected commercial and industrial growth in the 30% range, both of which also include non-data center products and, for Generac, an acquisition.
Table of contents
- 01Introduction
- 1.1Market Definition and Scope
- 1.2Report Coverage and Units
- 1.3Key Questions Answered
- 02Research Methodology
- 2.1Bottom-Up Capacity Cohort Model
- 2.2Generator Spend per MW Assumptions
- 2.3Top-Down Supplier Cross-Checks
- 2.4Data Sources and Fact Verification
- 03Executive Summary
- 3.1Market Snapshot, 2025 and 2035
- 3.2Key Findings
- 3.3Analyst View
- 04Market Dynamics
- 4.1Drivers
- 4.2Restraints and Challenges
- 4.3Opportunities
- 4.4Trends
- 05Pricing Analysis
- 5.1Generator Spend per MW by Hall Type
- 5.2Replacement and Upgrade Spend per MW
- 5.3Price Outlook to 2035
- 06Standards and Regulation
- 6.1ISO 8528-1 Ratings
- 6.2NFPA 110 Emergency and Standby Power
- 6.3US EPA Engine Emissions Rules
- 6.4Grid Connection Rules for Large Energy Users
- 07Supply Chain Analysis
- 7.1Engine and Alternator Suppliers
- 7.2Generator Set Packagers
- 7.3Enclosure, Fuel System and Aftertreatment Suppliers
- 7.4Distribution and Service Channels
- 08Market Size and Forecast
- 8.1Global Market Size, 2020-2035
- 8.2New-Build, Replacement and Prime Power Spend
- 8.3Capacity Additions and Installed Base
- 09Market by Application
- 9.1Emergency Standby
- 9.2Prime and Bridge Power
- 9.3Peak Shaving and Grid Support
- 10Market by Fuel Type
- 10.1Diesel
- 10.2Natural Gas
- 10.3Bi-Fuel and Other
- 11Market by Power Rating
- 11.1Below 1 MW
- 11.21-2 MW
- 11.32-3 MW
- 11.4Above 3 MW
- 12Market by Component
- 12.1Generator Sets
- 12.2Enclosures and Fuel Systems
- 12.3Controls and Paralleling
- 12.4Emissions Aftertreatment
- 13Market by Data Center Type
- 13.1Hyperscale Data Centers
- 13.2Colocation Data Centers
- 13.3Enterprise Data Centers
- 13.4Edge Data Centers
- 13.5GPU and Neocloud Providers
- 14DC Exclusive: Generator Spend per MW Model
- 14.1Power Rating × Buyer Matrix, 2025
- 14.2Model Inputs and Assumptions
- 15Market by Region
- 15.1North America (United States, Canada)
- 15.2Asia Pacific (China, Japan, India, Australia, Rest of Asia Pacific)
- 15.3Europe (United Kingdom, Germany, France, Netherlands, Rest of Europe)
- 15.4Latin America (Brazil, Rest of Latin America)
- 15.5Middle East and Africa (Saudi Arabia, Rest of Middle East and Africa)
- 16Country Analysis
- 16.1Top 12 Countries, 2025 and 2035
- 16.2Fastest-Growing Country Markets
- 17Regional Cross-Sections
- 17.1Regional Share Shifts, 2025 and 2035
- 17.2Regional Growth Rates, 2025-2035
- 18Forecast Scenarios
- 18.1Low Scenario
- 18.2Base Scenario
- 18.3High Scenario
- 19Competitive Landscape
- 19.1Market Concentration
- 19.2Supplier Positioning by Power Rating
- 19.3Capacity Expansions and Recent Developments
- 20Company Profiles
- 20.1Caterpillar
- 20.2Cummins
- 20.3Rolls-Royce Power Systems
- 20.4Generac
- 20.5Rehlko
- 20.6Mitsubishi Heavy Industries
- 20.7HITEC Power Protection
- 20.8Himoinsa
- 20.9Atlas Copco
- 20.10Aggreko
- 20.11Kirloskar Oil Engines
- 20.12Wärtsilä
- 21Analyst Recommendations
- 21.1For Generator Manufacturers
- 21.2For Data Center Operators
- 21.3For Investors
- Fig. 1Data Center Generator Market Size, 2020-2035 (USD billion)
- Fig. 2Market Share by Application, 2025 and 2035
- Fig. 3Market Share by Fuel Type, 2025 and 2035
- Fig. 4Market Share by Power Rating, 2025 and 2035
- Fig. 5Market Share by Data Center Type, 2025 and 2035
- Fig. 6Market Share by Region, 2025 and 2035
- Fig. 7Top 12 Countries by Market Size, 2025
- Fig. 8Forecast Scenarios, 2035
- Table 1Report Attributes
- Table 2Generator Spend per MW, 2020, 2025, 2030 and 2035
- Table 3Market by Application, 2025 and 2035
- Table 4Market by Fuel Type, 2025 and 2035
- Table 5Market by Power Rating, 2025 and 2035
- Table 6Market by Component, 2025 and 2035
- Table 7Market by Data Center Type, 2025 and 2035
- Table 8Power Rating × Buyer Matrix, 2025
- Table 9Market by Region, 2025 and 2035
- Table 10Top 12 Countries, 2025 and 2035
- Table 11Forecast Scenarios, 2035
- Table 12Leading Companies
About this report
Written by Satyabrat Rajawat and reviewed by Deepti Agrawal, Senior Editor, Research. Figures are built top-down and bottom-up and reconciled before publication, with 2025 as the base year.
Read our methodologyHow we built this
- Historical period2020-2024
- Base year2025
- Forecast period2026-2035
- Sizing approachTop-down + bottom-up
Need more than the report?
Advisory on this market
Due diligence, site selection and market entry work, by the analysts who wrote this report.
See consulting servicesFrequently asked questions
USD 8.31 billion in 2025, rising to USD 19.92 billion by 2035. DC Market Insights estimates the market at USD 3.60 billion in 2020.
9.13% a year from 2025 to 2035. Growth was faster, at 18.23% a year, between 2020 and 2025 as AI campuses scaled up.
Diesel, with USD 6.97 billion or 83.8% of the market in 2025. Natural gas is the fastest-growing segment at 19.58% a year as AI campuses use gas engines for prime and bridge power.
About USD 0.620 million per MW for a conventional hall and USD 0.550 million per MW for an AI hall in 2025, according to DC Market Insights estimates covering generator sets, enclosures, fuel systems, controls and aftertreatment.
North America, with USD 3.67 billion or 44.1% of 2025 value. The Middle East and Africa grows fastest at 11.88% a year.
About 60% of the market is held by Caterpillar, Cummins and Rolls-Royce Power Systems together (DC Market Insights estimate). Generac, Rehlko, Mitsubishi Heavy Industries, HITEC Power Protection, Himoinsa, Atlas Copco, Aggreko, Kirloskar Oil Engines and Wärtsilä also compete.
Hyperscale data centers, with USD 3.23 billion or 38.9% of 2025 demand. GPU and neocloud providers grow fastest at 13.46% a year.
USD 3.25 billion in the United States, or 39.1% of 2025 spending, followed by China at USD 932.48 million. India grows fastest among large country markets at 14.34% a year (DC Market Insights estimate).
Licences, delivery and payment
Which licence should I choose?
Single User is a view-only PDF for one person. Multi User adds a printable PDF and the Excel data for unlimited users at one location. Enterprise covers your whole company and includes 100 free analyst hours.
How and when will I receive the report?
By email, within 24–48 business hours of payment, in the formats of your licence.
How can I pay?
Securely through PayPal: with a PayPal account, a debit or credit card, or PayPal Pay Later where available. Prices are in US dollars.
Can I see a sample first?
Yes. Request a free sample and we will email it to you.
Can the report be tailored to my needs?
Yes. We can add countries, segments or data cuts. Talk to an analyst about the scope you need.
Can I get an invoice or pay against a purchase order?
Write to sales@dcmarketinsights.com and our team will help.