
Retail Data Center Market Size, Share & Forecast to 2035
Market at a glance
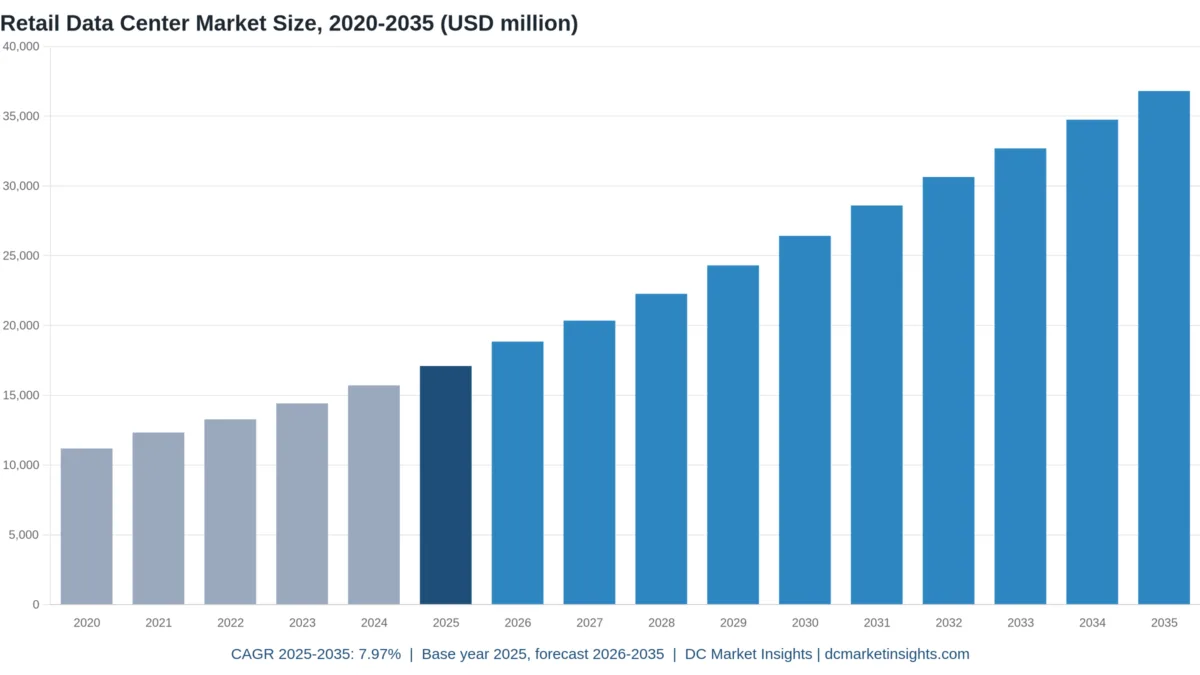
The Retail Data Center market was worth USD 17.10 billion in 2025 and is forecast to reach USD 36.80 billion by 2035, growing at a 7.97% CAGR.
 By Amit Jain, Senior Consultant, ICT & Emerging Technologies
 Reviewed by Deepti Agrawal
Last updated 26 Oct 2026
Base year 2025 PDF + Excel
What is inside the report
- 01Introduction
- 02Executive Summary
- 03Market Scope
- 04Why Market Estimates Differ
- 05Market Drivers
- 06Market Trends
- 07Market Challenges and Restraints
- 08Market Opportunities
- 09Pricing Analysis
- 10Standards and Regulation
- 18chapters
- 2020-2024Historical period
- 2026-2035Forecast period
- —Companies profiled
Segmentation
Recent developments
Casey's completed edge computing in more than 2,600 stores in ten months, and Royal Farms began rolling out at 20-25 stores a week (Source: Scale Computing)
the European Commission reported that only 770 data centres, about 36% of those in scope, filed first-round energy reports (Source: European Commission)
Schwarz Group announced a EUR 5.6 billion, 240 MW data center at Dummerstorf by 2033 (Source: Schwarz Group)
Alibaba reported June-quarter capital expenditure of RMB 67.68 billion, up 75% (Source: Alibaba Form 6-K)
the European Commission fined AliExpress EUR 550 million under the Digital Services Act (Source: European Commission)
Reliance Industries set the first 120 MW of its Jamnagar AI backbone for end-2026 (Source: Reliance Industries)
Full analysis
The Retail Data Center Market is valued at USD 18.85 billion in 2026 and is projected to reach USD 36.80 billion by 2035, up from USD 17.10 billion in 2025, a CAGR of 7.97% from 2025 to 2035 (DC Market Insights estimate). Two forces set the size of this spend. The first is card security: 51 future-dated requirements of the Payment Card Industry Data Security Standard (PCI DSS) version 4 became mandatory on 31 March 2025, including script controls on every e-commerce payment page (PCI Security Standards Council, March 2025), so retailers are moving card-data systems into segmented, audited halls. The second is a European grocer building its own cloud: Schwarz Group, owner of Lidl and Kaufland, broke ground on a EUR 11 billion, 200-megawatt (MW) campus at Lübbenau in November 2025 (Schwarz Digits, November 2025). The arithmetic behind the 2025 value: 3,700 MW of information technology (IT) load in use by retailers x USD 4.62 million of yearly spending per MW = USD 17.10 billion, of which USD 11.73 billion is servers, storage and network gear and USD 3.64 billion is colocation and hosting fees. Retail AI and personalisation is the fastest workload at 17.52% a year, and Asia Pacific is the fastest region at 9.76% because India’s organised retail and payment volumes are scaling on locally stored data.
Key Market Statistics: How Big Is the Retail Data Center Market in 2026?
DC Market Insights values retail data center spending at USD 18.85 billion in 2026, 10.23% above 2025, as GPU (graphics processing unit) racks for recommendation and demand forecasting, PCI-scoped colocation cages and store edge refreshes all add load in the same year.
- Retail data center market size 2025: USD 17.10 billion
- Market size 2026: USD 18.85 billion
- Market size 2030: USD 26.42 billion
- Market size 2035: USD 36.80 billion
- CAGR 2025-2035: 7.97% (low case 6.35%, high case 9.30%)
- Largest component: IT hardware, USD 11.73 billion or 68.6% of 2025 value
- Fastest workload: retail AI and personalisation, 17.52% a year to USD 10.87 billion by 2035
- Largest retail format: grocery and supermarkets, USD 4.62 billion in 2025; fastest: e-commerce and online marketplaces at 10.40%
- Leading region: North America, USD 6.33 billion or 37.0% of 2025 value; fastest region: Asia Pacific at 9.76%
- Largest country: United States, USD 5.73 billion in 2025; fastest large country: India at 14.97%
- Market leaders: Dell Technologies, Hewlett Packard Enterprise and Lenovo in retail servers, Scale Computing and NCR Voyix in store platforms, and Equinix and Digital Realty in retail colocation (DC Market Insights assessment)
Executive Summary: Retail Data Center Market Size, 2020-2035
The Global Retail Data Center Market size was valued at USD 11.19 billion in 2020, reached USD 17.10 billion in 2025, and is anticipated to reach USD 36.80 billion by 2035, at a CAGR of 7.97% during the forecast period. Between 2020 and 2025 spending grew 8.85% a year, faster than the coming decade, because the pandemic pushed curbside, click-and-collect and marketplace systems into production within two years; from 2025 the mix shifts from building capacity to renting it, which lowers growth but lifts the colocation line.
| Attribute | Value |
|---|---|
| Historical period | 2020-2024 |
| Base year | 2025 |
| Forecast period | 2026-2035 |
| Market size 2025 | USD 17.10 billion |
| Market size 2026 | USD 18.85 billion |
| CAGR 2025-2035 | 7.97% |
| Market size 2035 | USD 36.80 billion |
| Segments covered | Component, retail format, workload, deployment model, region, 12 countries |
Retailers are leaving their own server rooms: corporate data centers shrink from USD 5.13 billion in 2025 to USD 4.78 billion in 2035 (down 0.69% a year), while colocation and hosted private cloud almost triples to USD 20.61 billion. Store and warehouse edge, the second engine, grows to USD 11.41 billion as single-box edge platforms replace closets of separate servers in tens of thousands of stores.
What Does a Retailer Spend on Data Centers?
USD 17.10 billion in 2025: the data center capacity that store chains, grocers, department stores, pharmacies and online marketplaces own or lease for their own trading, counted from the server to the building.
Included: servers, storage and network equipment in retailer-run sites (USD 11.73 billion); colocation, wholesale and hosted private cloud fees paid by retailers (USD 3.64 billion); uninterruptible power supply (UPS), cooling and switchgear in owned sites (USD 1.24 billion); and construction, prefabricated rooms and tenant fit-out (USD 488.14 million). Store back-office servers, dark-store and fulfilment-center compute rooms count as edge capacity.
Excluded: public cloud fees, point-of-sale terminals and handheld scanners, retail software licences, the electricity bill, and the cloud businesses that retail groups sell to outside customers (Alibaba Cloud, Amazon Web Services and most of STACKIT’s third-party revenue).
How the segments fit together: every split (component, retail format, workload, deployment model, region) sums to the same USD 17.10 billion in 2025 and USD 36.80 billion in 2035. The model is built in MW: 3,700 MW in use in 2025, of which 1,554 MW is leased, 1,036 MW sits in stores and warehouses and 222 MW runs on GPU racks.
Why Do Retail Data Center Market Estimates Differ?
Published figures for this market name differ by more than three times because they count different things; the DC Market Insights value of USD 18.85 billion in 2026 covers only capacity retailers own or lease for their own operations.
Broader definitions add the public cloud fees that retailers pay, the retail technology stack (point-of-sale terminals, self-checkout kiosks, electronic shelf labels, store Wi-Fi) and retail software such as enterprise resource planning (ERP) and order management licences. Some also count the hyperscale campuses of Amazon or Alibaba as retail data centers, although most of that capacity serves outside cloud customers; Amazon spent USD 131.82 billion on property and equipment in 2025 across all its businesses (Amazon Form 10-K, February 2026). Narrower studies count only data center construction for retailers and miss the 89.9% of 2025 spending that goes to IT hardware and colocation fees.
| Element | In this report | Why |
|---|---|---|
| Servers, storage, network in retailer sites | Yes, USD 11.73 billion (2025) | Capacity the retailer buys and runs |
| Colocation and hosted private cloud fees | Yes, USD 3.64 billion | Capacity the retailer leases |
| Power, cooling, construction of owned sites | Yes, USD 1.73 billion | Data center infrastructure |
| Store and warehouse edge rooms | Yes, USD 4.79 billion (within the lines above) | Server-class compute in stores |
| Public cloud fees | No | Counted in cloud services markets |
| POS terminals, kiosks, shelf labels | No | Store technology, not data center |
| Retail software licences | No | Software market |
| Third-party cloud businesses of retail groups | No | Serves non-retail customers |
Small and mid-sized retailers are in scope: a regional grocer with a 20-kilowatt rack in a colocation cage and two edge servers per store is counted the same way as Walmart’s private cloud. Public cloud spending, point-of-sale hardware, kiosks and retail software are out of scope throughout this estimate.
What Is Driving Retail Data Center Spending?
Three drivers lift spending from USD 17.10 billion in 2025 to USD 26.42 billion in 2030: card-security rules, ransomware recovery costs and retailer-built sovereign cloud in Europe.
PCI DSS Version 4 Moves Card Data into Audited Cages
PCI DSS version 4 added 64 new requirements, and 51 of them became effective on 31 March 2025, including Requirements 6.4.3 and 11.6.1 on payment-page scripts and tamper detection (PCI Security Standards Council, March 2025). Every retailer that takes cards online must now inventory and monitor each script on its checkout pages, which pulls payment systems out of shared server rooms into segmented, logged environments. DC Market Insights estimates that colocation and hosting spending by retailers grows from USD 3.64 billion in 2025 to USD 9.55 billion in 2035, 10.13% a year, the fastest component, with card-data segmentation a main reason for the move.
Ransomware Losses Make Recovery Sites a Board Item
Marks and Spencer (M&S) told investors in May 2025 that the April 2025 cyber incident would cut 2025/26 operating profit by about GBP 300 million before mitigation, and it booked GBP 101.6 million of incident costs in the first half against GBP 100.0 million of insurance income (M&S results, November 2025). The UK National Crime Agency arrested four people over the attacks on M&S, Co-op and Harrods in July 2025. M&S had already planned GBP 200-250 million of 2025/26 capital expenditure for technology infrastructure. DC Market Insights counts USD 2.97 billion of 2025 retail data center spending under backup, security and other workloads.
Schwarz Group Builds a Grocer-Owned Cloud in Germany
Schwarz Digits, the IT arm of the Lidl and Kaufland owner, broke ground in Lübbenau on 17 November 2025 for a EUR 11 billion campus with an initial connected load of about 200 MW (Schwarz Digits, November 2025). On 27 August 2026 Schwarz Group added a second site at Dummerstorf, about EUR 5.6 billion for 240 MW by 2033 (Schwarz Group, August 2026). Schwarz Digits revenue grew 15.8% to EUR 2.2 billion in the last fiscal year. DC Market Insights counts only the share of these campuses that runs the group’s own retail systems, which is part of Europe’s USD 3.85 billion in 2025.
Which Trends Are Changing Retail Data Centers?
The USD 4.79 billion store and warehouse edge segment is being rebuilt on single-platform hardware, while GPU spending for retail AI grows 17.52% a year.
Store Edge Consolidation: 6,700 Ahold Delhaize Stores on One Platform
Ahold Delhaize runs Scale Computing’s hyperconverged edge platform in more than 6,700 stores (Scale Computing, January 2025), and Casey’s rolled out edge computing as a service to more than 2,600 of its nearly 2,900 convenience stores in ten months (Scale Computing, September 2026). Walmart describes edge clouds in its stores and clubs as one layer of its hybrid cloud, across a network of more than 10,000 stores that generates about 10 petabytes of data a day (Walmart Global Tech, September 2025). DC Market Insights puts store and warehouse edge at 1,036 MW in 2025 and 2,077 MW in 2035.
Retail Groups Buy GPU Capacity for Their Own AI
Reliance Industries, whose retail arm runs 20,160 stores, said at its June 2026 annual meeting that the first 120 MW of its Jamnagar AI backbone will be commissioned by the end of 2026 with an NVIDIA GB300 fleet equal to more than 75,000 H100 GPUs (Reliance AGM, June 2026). Alibaba’s capital expenditure rose 75% to RMB 67.68 billion (USD 9.98 billion) in the June 2026 quarter (Alibaba Form 6-K, August 2026). DC Market Insights estimates that GPU racks rise from 6% of retail MW in 2025 to 24% in 2035, lifting the AI workload to USD 10.87 billion.
Online Share Sets the Peak, Not the Average
US e-commerce reached USD 340.2 billion in the second quarter of 2026, 17.1% of retail sales (US Census Bureau, August 2026), but the unadjusted fourth-quarter 2025 share was 18.3%, and retailers size order systems for that holiday peak. In Great Britain the online share of retail sales was 28.8% in September 2026 (Office for National Statistics, October 2026). E-commerce platforms and order management account for USD 3.93 billion of 2025 retail data center spending in the DC Market Insights model.
What Holds Back Retail Data Center Investment?
Two limits keep the forecast at 7.97% a year: energy reporting duties on owned sites in the European Union (EU) and retailers’ tight capital budgets after costly automation write-downs.
EU Energy Reporting Reaches Every Retail Site Above 500 kW
The Energy Efficiency Directive requires every data center with at least 500 kilowatts (kW) of installed IT power to publish energy and water data each year by 15 May, yet only 770 sites, about 36% of those in scope, reported in the first round (European Commission data centre energy report, September 2026). EU data centers used 68 terawatt-hours (TWh) in 2024, rising to 114 TWh by 2030 on the Commission’s projection. For a grocer with a 2 MW legacy hall, the reporting duty adds cost to keeping it, one reason corporate data centers decline 0.69% a year to USD 4.78 billion by 2035.
Automation Write-Downs Make Retail Boards Cautious
Kroger booked a USD 2.5 billion impairment on its automated fulfilment network in fiscal 2025 while keeping total capital investment at USD 3.86 billion (Kroger results, March 2026). NCR Voyix retail segment revenue fell 6% to USD 1.84 billion in 2025 (NCR Voyix results, February 2026). In the DC Market Insights low case, slower store technology refreshes cut 2035 spending to USD 31.65 billion, USD 5.15 billion below the base case.
Where Are the New Retail Data Center Opportunities?
The two largest new pools are India’s retail data, which must increasingly be stored locally, and colocation for retailers leaving their own halls, worth USD 13.43 billion of added yearly spending by 2035.
India’s Data Protection Rules and Payment Volumes
India notified the Digital Personal Data Protection (DPDP) Rules on 14 November 2025 with an eighteen-month phase-in, and significant data fiduciaries can be directed to store data locally; penalties reach INR 250 crore for failed security safeguards (Press Information Bureau, November 2025). The Unified Payments Interface (UPI) handled 21.63 billion transactions in December 2025 alone. DC Market Insights forecasts India’s retail data center spending to rise from USD 547.10 million in 2025 to USD 2.21 billion in 2035, 14.97% a year, the fastest of the top 12 countries.
Retail Colocation Cages and Hosted Private Cloud
Colocation and hosted private cloud grows from USD 7.18 billion in 2025 to USD 20.61 billion in 2035, 11.12% a year. Tesco says it has consolidated to a single public cloud hosting supplier while still investing in data centres and connectivity for resilience (Tesco annual report, May 2025), the hybrid pattern that keeps PCI and recovery systems in leased cages. For operators covered in the Data Center Colocation Market report, retail is a mid-sized tenant group: USD 3.64 billion of 2025 fees.
How Much Does a Retailer Spend per MW of Data Center Capacity?
USD 4.62 million per MW in use in 2025, DC Market Insights estimates, rising to USD 5.49 million by 2035 as GPU racks lift hardware spending per MW faster than leased capacity lowers building costs.
| Year | Retail IT load in use (MW) | Total spending per MW | IT hardware per MW | Colocation and hosting rate (USD per kW-month) |
|---|---|---|---|---|
| 2020 | 2,900 | USD 3.86 million | USD 2.76 million | USD 178 |
| 2025 | 3,700 | USD 4.62 million | USD 3.17 million | USD 195 |
| 2030 | 5,000 | USD 5.28 million | USD 3.52 million | USD 205 |
| 2035 | 6,700 | USD 5.49 million | USD 3.61 million | USD 212 |
Public anchors: Schwarz Digits’ Lübbenau budget of EUR 11 billion for an initial 200 MW works out to EUR 55 million per MW including future GPU fit-out, while Dummerstorf’s EUR 5.6 billion for 240 MW is about EUR 23 million per MW. A retail AI rack costs USD 8.20 million per MW-year of servers in the DC Market Insights model in 2025, against USD 2.85 million for conventional retail servers. Walmart’s fiscal 2026 capital expenditure was USD 26.64 billion, of which USD 16.47 billion went to supply chain, customer-facing initiatives, technology and other (Walmart Form 10-K, March 2026).
Which Rules Shape Retail Data Center Design?
At least seven named rules decide where retailers keep data and how they report it, and they push about 42% of 2025 spending into leased, audited capacity.
- PCI DSS v4.0.1: published in June 2024 as a limited revision with no new requirements; v4.0 retired on 31 December 2024; 51 future-dated requirements effective 31 March 2025 (Source: PCI Security Standards Council)
- EU Cyber Resilience Act: in force 10 December 2024, reporting duties from 11 September 2026, main obligations from 11 December 2027 (Source: European Commission)
- EU Digital Services Act: AliExpress fined EUR 550 million in July 2026 and Temu EUR 200 million in May 2026 over illegal-product risks, raising record-keeping duties for marketplaces (Source: European Commission)
- EU Energy Efficiency Directive Article 12 and Delegated Regulation 2024/1364: yearly energy and water reporting for sites of 500 kW or more (Source: European Commission)
- India DPDP Act 2023 and DPDP Rules 2025: notified 14 November 2025, eighteen-month phase-in, penalties up to INR 250 crore (Source: Press Information Bureau)
- China cross-border data flow provisions: since 22 March 2024 handlers sending personal data of fewer than 100,000 people a year abroad need no security assessment (Source: Cyberspace Administration of China)
- California Consumer Privacy Act regulations: cybersecurity audits from 1 January 2026, first certifications due 1 April 2028 for businesses above USD 100 million revenue (Source: California Privacy Protection Agency)
Retail Data Center Market Segmentation: Which Segment Spends Most?
The largest component is IT hardware at USD 11.73 billion in 2025, grocery the largest retail format at USD 4.62 billion, and colocation and hosted private cloud the largest deployment model at USD 7.18 billion.
By Component
Servers, storage and network gear hold 68.6% of 2025 value; colocation and hosting services grow fastest at 10.13% a year.
| Component | 2025 (USD million) | Share 2025 | 2035 (USD million) | CAGR 2025-2035 |
|---|---|---|---|---|
| IT Hardware | USD 11,732.70 million | 68.6% | USD 24,184.32 million | 7.50% |
| Colocation and Hosting Services | USD 3,636.36 million | 21.3% | USD 9,545.09 million | 10.13% |
| Electrical and Mechanical Infrastructure | USD 1,239.64 million | 7.3% | USD 2,080.64 million | 5.31% |
| Construction and Fit-Out | USD 488.14 million | 2.9% | USD 992.92 million | 7.36% |
By Retail Format
Grocery and supermarkets spend USD 4.62 billion in 2025 because thousands of stores run fresh-food ordering, pricing and loyalty systems; e-commerce and online marketplaces grow fastest at 10.40% a year and lead by 2035 with USD 11.04 billion.
| Retail Format | 2025 (USD million) | Share 2025 | 2035 (USD million) | CAGR 2025-2035 |
|---|---|---|---|---|
| Grocery and Supermarkets | USD 4,616.14 million | 27.0% | USD 9,200.74 million | 7.14% |
| E-Commerce and Online Marketplaces | USD 4,103.24 million | 24.0% | USD 11,040.89 million | 10.40% |
| General Merchandise and Hypermarkets | USD 3,590.34 million | 21.0% | USD 6,992.56 million | 6.89% |
| Apparel and Specialty Retail | USD 2,222.59 million | 13.0% | USD 4,416.36 million | 7.11% |
| Convenience and Drug Stores | USD 1,367.75 million | 8.0% | USD 2,576.21 million | 6.54% |
| Other Retail | USD 1,196.78 million | 7.0% | USD 2,576.21 million | 7.97% |
By Workload
Store operations and point of sale is the largest workload at USD 4.62 billion in 2025, but retail AI and personalisation passes it by 2035 at USD 10.87 billion.
| Workload | 2025 (USD million) | Share 2025 | 2035 (USD million) | CAGR 2025-2035 |
|---|---|---|---|---|
| Store Operations and Point of Sale | USD 4,616.15 million | 27.0% | USD 6,992.57 million | 4.24% |
| E-Commerce Platforms and Order Management | USD 3,932.27 million | 23.0% | USD 8,096.65 million | 7.49% |
| Supply Chain and Warehouse Systems | USD 3,419.37 million | 20.0% | USD 6,624.53 million | 6.84% |
| Retail AI and Personalisation | USD 2,162.75 million | 12.6% | USD 10,867.92 million | 17.52% |
| Backup Security and Other Workloads | USD 2,966.30 million | 17.3% | USD 4,221.30 million | 3.59% |
By Deployment Model
Colocation and hosted private cloud holds 42.0% of 2025 value and grows 11.12% a year; corporate data centers shrink 0.69% a year.
| Deployment Model | 2025 (USD million) | Share 2025 | 2035 (USD million) | CAGR 2025-2035 |
|---|---|---|---|---|
| Corporate Data Centers | USD 5,129.05 million | 30.0% | USD 4,784.39 million | -0.69% |
| Store and Warehouse Edge | USD 4,787.12 million | 28.0% | USD 11,408.92 million | 9.07% |
| Colocation and Hosted Private Cloud | USD 7,180.67 million | 42.0% | USD 20,609.66 million | 11.12% |
DC Exclusive: Retailer Compute Tracker, 9 Programs, 560 MW and 19,600+ Edge Stores
DC Market Insights lists 9 named retailer data center and store-edge programs from company filings and releases in this tracker, 9 inputs in all: 560 MW of announced campus load and more than 19,600 stores on documented edge platforms. It shows where retail compute is going: three campuses belong to two retail groups that also sell cloud, while the store programs are run by grocers and convenience chains.
| Retail group | Program | Date | MW announced | Stores on edge platform | Type |
|---|---|---|---|---|---|
| Schwarz Group (Schwarz Digits, STACKIT) | Lübbenau campus, EUR 11 billion, first three modules by end-2027, room for up to 100,000 GPUs | Nov 2025 | 200 | n/a | Retailer-owned cloud |
| Schwarz Group | Dummerstorf campus, about EUR 5.6 billion, grid option of 1 GW by 2045 | Aug 2026 | 240 | n/a | Retailer-owned cloud |
| Schwarz Group (STACKIT) | 7 operating data centers in Germany and Austria serving 14,000+ store and warehouse locations | Aug 2026 | not disclosed | 14,000 | Retailer-owned cloud |
| Reliance Industries (Reliance Intelligence) | Jamnagar AI backbone, NVIDIA GB300 fleet equal to 75,000+ H100 GPUs | Jun 2026 | 120 | n/a | Retail group AI campus |
| Walmart | Triplet hybrid cloud: one private cloud in three US regions plus two vendor clouds and edge clouds in stores and clubs | Mar 2024 | not disclosed | 10,000 | Private cloud and store edge |
| Ahold Delhaize | Hyperconverged edge platform in stores | Jan 2025 | not disclosed | 6,700 | Store edge |
| Casey’s | Edge computing as a service rolled out in ten months | Sep 2026 | not disclosed | 2,600 | Store edge |
| Royal Farms | Edge rollout at 20-25 stores a week across about 300 locations | Sep 2026 | not disclosed | 300 | Store edge |
| Tesco | Data centres plus a single public cloud host; technology team doubled to 6,000+ | Apr 2026 | not disclosed | n/a | Hybrid, consolidating |
Reading the tracker: the 560 MW of campus load equals 15.1% of all retail IT load in use in 2025, but DC Market Insights counts only the part that runs retail systems; STACKIT’s 14,000+ group locations are counted once, inside Schwarz Group’s own use. The store programs add up to more than 19,600 stores, a small share of the roughly 1,036 MW of store and warehouse edge load, which is why the edge segment still has a long refresh runway to USD 11.41 billion by 2035.
Which Region Leads the Retail Data Center Market?
North America leads with USD 6.33 billion, 37.0% of 2025 value, and Asia Pacific grows fastest at 9.76% a year to become the largest region by 2035 with USD 14.32 billion.
| Region | 2025 (USD million) | Share 2025 | 2035 (USD million) | CAGR 2025-2035 |
|---|---|---|---|---|
| North America | USD 6,325.83 million | 37.0% | USD 12,144.98 million | 6.74% |
| Asia Pacific | USD 5,641.95 million | 33.0% | USD 14,316.36 million | 9.76% |
| Europe | USD 3,846.79 million | 22.5% | USD 7,360.59 million | 6.70% |
| Latin America | USD 769.36 million | 4.5% | USD 1,766.54 million | 8.67% |
| Middle East and Africa | USD 512.91 million | 3.0% | USD 1,214.50 million | 9.00% |
North America
North America spends USD 6.33 billion in 2025 and grows 6.74% a year. US e-commerce sales were USD 1,233.7 billion in 2025, 16.4% of retail and up 5.4% (US Census Bureau, March 2026), and Walmart guides fiscal 2027 capital expenditure of about USD 25-27 billion focused on technology, supply chain and customer-facing work.
Asia Pacific
Asia Pacific spends USD 5.64 billion in 2025 and is the fastest region at 9.76%. Japan’s business-to-consumer e-commerce market reached JPY 27.6 trillion in 2025, up 5.5% (Ministry of Economy, Trade and Industry, October 2026), and India adds the fastest country growth at 14.97% a year.
Europe
Europe spends USD 3.85 billion in 2025, growing 6.70% a year. In 2025, 78% of EU internet users aged 16-74 bought goods or services online (Eurostat, February 2026), and the Schwarz Group campuses in Brandenburg and Mecklenburg-Vorpommern make Germany the home of the region’s largest retailer-built capacity.
Latin America
Latin America spends USD 769.36 million in 2025 and grows 8.67% a year. Brazil’s Pix instant-payment system handled almost 80 billion transactions worth over BRL 35 trillion in 2025 (Ministry of Finance of Brazil, August 2026), and Brazil is the region’s largest country at USD 341.94 million.
Middle East and Africa
Middle East and Africa spends USD 512.91 million in 2025, the smallest region, growing 9.00% a year to USD 1.21 billion by 2035 as retailers in Saudi Arabia, the United Arab Emirates and South Africa move order, payment and loyalty systems from overseas hosting into in-country colocation.
Top 12 Countries in the Retail Data Center Market
The United States is the largest country at USD 5.73 billion in 2025, 33.5% of the global total; India is the fastest large country at 14.97% a year.
| Rank | Country | Region | 2025 (USD million) | Share 2025 | 2035 (USD million) | CAGR 2025-2035 |
|---|---|---|---|---|---|---|
| 1 | United States | North America | USD 5,727.44 million | 33.5% | USD 10,893.68 million | 6.64% |
| 2 | China | Asia Pacific | USD 2,222.59 million | 13.0% | USD 5,152.42 million | 8.77% |
| 3 | Japan | Asia Pacific | USD 957.42 million | 5.6% | USD 1,803.35 million | 6.54% |
| 4 | United Kingdom | Europe | USD 786.45 million | 4.6% | USD 1,472.12 million | 6.47% |
| 5 | Germany | Europe | USD 735.16 million | 4.3% | USD 1,361.71 million | 6.36% |
| 6 | India | Asia Pacific | USD 547.10 million | 3.2% | USD 2,208.18 million | 14.97% |
| 7 | France | Europe | USD 461.61 million | 2.7% | USD 846.47 million | 6.25% |
| 8 | South Korea | Asia Pacific | USD 444.52 million | 2.6% | USD 1,030.48 million | 8.77% |
| 9 | Canada | North America | USD 427.42 million | 2.5% | USD 883.27 million | 7.53% |
| 10 | Brazil | Latin America | USD 341.94 million | 2.0% | USD 772.86 million | 8.50% |
| 11 | Australia | Asia Pacific | USD 307.74 million | 1.8% | USD 662.45 million | 7.97% |
| 12 | Italy | Europe | USD 256.45 million | 1.5% | USD 478.44 million | 6.43% |
China ranks second at USD 2.22 billion because its large platforms keep marketplace systems on group clouds; online sales of physical goods were 26.1% of China’s retail sales in 2025 (National Bureau of Statistics, January 2026). The United Kingdom ranks fourth at USD 786.45 million, with the highest online share of any large market.
How Large Could the Retail Data Center Market Be in 2035?
Between USD 31.65 billion and USD 41.59 billion in 2035, with USD 36.80 billion as the DC Market Insights base case.
| Scenario | 2035 (USD million) | CAGR 2025-2035 | What it assumes |
|---|---|---|---|
| Low | USD 31,650.55 million | 6.35% | Slower store refreshes, more workloads moved to public cloud, AI racks at 18% of MW |
| Base | USD 36,802.97 million | 7.97% | 6,700 MW in 2035, 56% leased, AI racks at 24% of MW |
| High | USD 41,587.36 million | 9.30% | Faster retail AI build-out and data localisation in India and the Gulf |
Low Scenario
USD 31.65 billion in 2035 if retailers move more order and analytics systems to public cloud and cut store server refreshes after write-downs like Kroger’s USD 2.5 billion impairment.
Base Scenario
USD 36.80 billion in 2035, with retail IT load rising from 3,700 MW to 6,700 MW and spending per MW easing as leased capacity grows.
High Scenario
USD 41.59 billion in 2035 if retail groups follow Reliance and Schwarz Group into owned AI campuses and the DPDP Rules lead to wide local storage in India.
Who Are the Key Companies in the Retail Data Center Market?
The four largest server suppliers to retailers hold about 40% of the USD 11.73 billion of 2025 IT hardware spending (DC Market Insights estimate); facility and colocation supply is more spread out.
- Dell Technologies
- Hewlett Packard Enterprise
- Lenovo
- Cisco Systems
- NVIDIA
- Intel
- Scale Computing
- NCR Voyix
- Toshiba Global Commerce Solutions
- Schneider Electric
- Vertiv
- Eaton
- Equinix
- Digital Realty
- Schwarz Digits (STACKIT)
- Reliance Industries
- Ocado Group
Company facts: Scale Computing’s edge platform runs in more than 6,700 Ahold Delhaize stores and more than 2,600 Casey’s stores, and Royal Farms is adding 20-25 stores a week (Scale Computing, September 2026). NCR Voyix reported 2025 revenue of USD 2.69 billion, of which retail was USD 1.84 billion (NCR Voyix results, February 2026). Schwarz Digits, which runs STACKIT, grew revenue 15.8% to EUR 2.2 billion (Schwarz Group, June 2026). Ocado Technology Solutions revenue rose 13.0% to GBP 561.2 million in fiscal 2025 (Ocado Group results, 2026). Reliance Industries is also building a 168 MW data center in Jamnagar for Meta, to be delivered within two years (Reliance, June 2026).
Server Supplier Concentration, 2025
Dell Technologies, Hewlett Packard Enterprise, Lenovo and Cisco Systems together hold about 40% of retail IT hardware value in 2025 (DC Market Insights estimate); in store edge the share of hyperconverged specialists such as Scale Computing rises with each chain-wide rollout.
Recent Developments in the Retail Data Center Market
Six dated events from the last twelve months changed the 2026 outlook of USD 18.85 billion.
- In September 2026, Casey’s completed edge computing in more than 2,600 stores in ten months, and Royal Farms began rolling out at 20-25 stores a week (Source: Scale Computing)
- In September 2026, the European Commission reported that only 770 data centres, about 36% of those in scope, filed first-round energy reports (Source: European Commission)
- In August 2026, Schwarz Group announced a EUR 5.6 billion, 240 MW data center at Dummerstorf by 2033 (Source: Schwarz Group)
- In August 2026, Alibaba reported June-quarter capital expenditure of RMB 67.68 billion, up 75% (Source: Alibaba Form 6-K)
- In July 2026, the European Commission fined AliExpress EUR 550 million under the Digital Services Act (Source: European Commission)
- In June 2026, Reliance Industries set the first 120 MW of its Jamnagar AI backbone for end-2026 (Source: Reliance Industries)
Research Methodology: How DC Market Insights Sized the Retail Data Center Market
The USD 17.10 billion 2025 value is a bottom-up DC Market Insights model of 3,700 MW of retail IT load in use, about 8% of the roughly 46 gigawatts (GW) of enterprise and colocation capacity inside the 116 GW installed base, priced component by component; see the DC Market Insights research methodology.
Model Inputs
Retail IT load in use of 2,900, 3,700, 5,000 and 6,700 MW in 2020, 2025, 2030 and 2035; leased share 32%, 42%, 50% and 56%; GPU share 1.5%, 6%, 16% and 24%; store and warehouse edge share 26%, 28%, 30% and 31%. IT hardware costs USD 2.85 million per conventional MW-year and USD 8.20 million per AI MW-year in 2025; colocation and hosting average USD 195 per kW-month, so 1,554 leased MW x USD 195 x 12 = USD 3.64 billion. Owned-site electrical and mechanical spending is USD 1.24 billion and construction and fit-out USD 488.14 million. Sibling estimates use the same base: the BFSI Data Center Market at 12.8% of enterprise and colocation load and the Manufacturing Data Center Market at 11%; store edge rooms are a subset of the Edge Data Center Market.
Bound Checks
Ceiling 1: USD 17.10 billion is 3.0% of the DC Market Insights global data center market of USD 570.04 billion in 2025, below banking (5.9%) and manufacturing (3.7%). Ceiling 2: retail colocation fees of USD 3.64 billion are 4.9% of the USD 74.46 billion data center colocation market. Floor: about 19,600 stores on the named edge platforms x USD 15,000 a year of server spend = USD 294 million, well under the store and warehouse edge segment of USD 4.79 billion. Every split sums to the total in every year, and the CAGR is recomputed from the 2025 and 2035 endpoints.
Table of contents
- 01Introduction
- 1.1Report Description
- 1.2Key Market Statistics, 2025, 2026, 2030 and 2035
- 02Executive Summary
- 2.1Market Snapshot, 2025, 2026 and 2035
- 2.2Market Size Chart, 2020-2035
- 03Market Scope
- 3.1Included
- 3.2Excluded
- 3.3How the Segments Fit Together
- 04Why Market Estimates Differ
- 4.1Scope Table: In and Out of This Estimate
- 05Market Drivers
- 5.1PCI DSS Version 4 Moves Card Data into Audited Cages
- 5.2Ransomware Losses Make Recovery Sites a Board Item
- 5.3Schwarz Group Builds a Grocer-Owned Cloud in Germany
- 06Market Trends
- 6.1Store Edge Consolidation: 6,700 Ahold Delhaize Stores on One Platform
- 6.2Retail Groups Buy GPU Capacity for Their Own AI
- 6.3Online Share Sets the Peak, Not the Average
- 07Market Challenges and Restraints
- 7.1EU Energy Reporting Reaches Every Retail Site Above 500 kW
- 7.2Automation Write-Downs Make Retail Boards Cautious
- 08Market Opportunities
- 8.1India's Data Protection Rules and Payment Volumes
- 8.2Retail Colocation Cages and Hosted Private Cloud
- 09Pricing Analysis
- 9.1Spending per MW, 2020-2035
- 9.2Public Price and Size Anchors
- 10Standards and Regulation
- 10.1PCI DSS v4.0.1
- 10.2EU Cyber Resilience Act
- 10.3EU Digital Services Act
- 10.4EU Energy Efficiency Directive Article 12
- 10.5India DPDP Act 2023 and DPDP Rules 2025
- 10.6China Cross-Border Data Flow Provisions
- 10.7California Consumer Privacy Act Regulations
- 11Market Segmentation
- 11.1By Component
- 11.2IT Hardware
- 11.3Colocation and Hosting Services
- 11.4Electrical and Mechanical Infrastructure
- 11.5Construction and Fit-Out
- 11.6By Retail Format
- 11.7Grocery and Supermarkets
- 11.8E-Commerce and Online Marketplaces
- 11.9General Merchandise and Hypermarkets
- 11.10Apparel and Specialty Retail
- 11.11Convenience and Drug Stores
- 11.12Other Retail
- 11.13By Workload
- 11.14Store Operations and Point of Sale
- 11.15E-Commerce Platforms and Order Management
- 11.16Supply Chain and Warehouse Systems
- 11.17Retail AI and Personalisation
- 11.18Backup Security and Other Workloads
- 11.19By Deployment Model
- 11.20Corporate Data Centers
- 11.21Store and Warehouse Edge
- 11.22Colocation and Hosted Private Cloud
- 12DC Exclusive: Retailer Compute Tracker
- 12.1Schwarz Group (Schwarz Digits, STACKIT), Nov 2025
- 12.2Schwarz Group, Aug 2026
- 12.3Schwarz Group (STACKIT), Aug 2026
- 12.4Reliance Industries (Reliance Intelligence), Jun 2026
- 12.5Walmart, Mar 2024
- 12.6Ahold Delhaize, Jan 2025
- 12.7Casey's, Sep 2026
- 12.8Royal Farms, Sep 2026
- 12.9Tesco, Apr 2026
- 13Regional Insights
- 13.1North America
- 13.2Asia Pacific
- 13.3Europe
- 13.4Latin America
- 13.5Middle East and Africa
- 14Country Analysis
- 14.1United States
- 14.2China
- 14.3Japan
- 14.4United Kingdom
- 14.5Germany
- 14.6India
- 14.7France
- 14.8South Korea
- 14.9Canada
- 14.10Brazil
- 14.11Australia
- 14.12Italy
- 15Forecast Scenarios, 2035
- 15.1Low Scenario
- 15.2Base Scenario
- 15.3High Scenario
- 16Competitive Insights
- 16.1Server Supplier Concentration, 2025
- 16.2Dell Technologies
- 16.3Hewlett Packard Enterprise
- 16.4Lenovo
- 16.5Cisco Systems
- 16.6NVIDIA
- 16.7Intel
- 16.8Scale Computing
- 16.9NCR Voyix
- 16.10Toshiba Global Commerce Solutions
- 16.11Schneider Electric
- 16.12Vertiv
- 16.13Eaton
- 16.14Equinix
- 16.15Digital Realty
- 16.16Schwarz Digits (STACKIT)
- 16.17Reliance Industries
- 16.18Ocado Group
- 17Recent Developments
- 17.1Casey's and Royal Farms Store Edge Rollouts, September 2026
- 17.2EU Data Centre Energy Report, September 2026
- 17.3Schwarz Group Dummerstorf Campus, August 2026
- 17.4Alibaba June-Quarter Capital Expenditure, August 2026
- 17.5AliExpress Digital Services Act Fine, July 2026
- 17.6Reliance Jamnagar 120 MW AI Backbone, June 2026
- 18Research Methodology
- 18.1Model Inputs
- 18.2Bound Checks
- Fig. 1Retail Data Center Market Size, 2020-2035 (USD million)
- Table 1Market Snapshot, 2025, 2026 and 2035
- Table 2Scope Table: In and Out of This Estimate
- Table 3Spending per MW, 2020-2035
- Table 4Market by Component, 2025 and 2035
- Table 5Market by Retail Format, 2025 and 2035
- Table 6Market by Workload, 2025 and 2035
- Table 7Market by Deployment Model, 2025 and 2035
- Table 8Retailer Compute Tracker, 2024-2026
- Table 9Market by Region, 2025 and 2035
- Table 10Top 12 Countries, 2025 and 2035
- Table 112035 Forecast Scenarios
About this report
Written by Amit Jain and reviewed by Deepti Agrawal, Senior Editor, Research. Figures are built top-down and bottom-up and reconciled before publication, with 2025 as the base year.
Read our methodologyHow we built this
- Historical period2020-2024
- Base year2025
- Forecast period2026-2035
- Sizing approachTop-down + bottom-up
Need more than the report?
Advisory on this market
Due diligence, site selection and market entry work, by the analysts who wrote this report.
See consulting servicesFrequently asked questions
USD 18.85 billion in 2026, up 10.23% from USD 17.10 billion in 2025, according to DC Market Insights estimates. The market is projected to reach USD 36.80 billion by 2035, a CAGR of 7.97% from 2025.
7.97% a year from 2025 to 2035, after 8.85% a year from 2020 to 2025, as retail IT load in use rises from 3,700 MW to 6,700 MW and GPU racks climb from 6% to 24% of it.
USD 17.10 billion in 2025 was spent on data center capacity that retailers own or lease for their own trading: corporate halls, colocation cages, hosted private cloud and server rooms in stores and warehouses. Public cloud fees and point-of-sale terminals are not counted.
11.12% a year is how fast colocation and hosted private cloud grows, to USD 20.61 billion by 2035, because 51 PCI DSS v4 requirements became mandatory on 31 March 2025 and the 2025 M&S cyber attack cost about GBP 300 million of profit.
19,600+ stores in the DC Market Insights tracker: Walmart’s 10,000+ store network, 6,700+ Ahold Delhaize stores, 2,600+ Casey’s stores and about 300 Royal Farms sites. Store and warehouse edge reaches USD 11.41 billion by 2035.
Retail AI and personalisation grows fastest at 17.52% a year to USD 10.87 billion by 2035; among formats, e-commerce and online marketplaces lead at 10.40%, and corporate data centers shrink 0.69% a year.
560 MW of announced load: Schwarz Group, owner of Lidl and Kaufland, is building a EUR 11 billion, 200 MW campus at Lübbenau and a 240 MW site at Dummerstorf, and Reliance commissions 120 MW at Jamnagar by end-2026.
North America, with USD 6.33 billion or 37.0% of 2025 value. Asia Pacific grows fastest at 9.76% a year and leads by 2035; India is the fastest large country at 14.97%.
USD 547.10 million in 2025, rising to USD 2.21 billion by 2035 at 14.97% a year, the fastest of the top 12 countries, as the DPDP Rules 2025 allow local-storage directions and UPI handled 21.63 billion payments in December 2025.
USD 18.85 billion in 2026 counts only capacity retailers own or lease for their own operations. Estimates that add public cloud fees, point-of-sale hardware, retail software or the cloud businesses of Amazon and Alibaba come out several times larger.
Licences, delivery and payment
Which licence should I choose?
Single User is a view-only PDF for one person. Multi User adds a printable PDF and the Excel data for unlimited users at one location. Enterprise covers your whole company and includes 100 free analyst hours.
How and when will I receive the report?
By email, within 24–48 business hours of payment, in the formats of your licence.
How can I pay?
Securely through PayPal: with a PayPal account, a debit or credit card, or PayPal Pay Later where available. Prices are in US dollars.
Can I see a sample first?
Yes. Request a free sample and we will email it to you.
Can the report be tailored to my needs?
Yes. We can add countries, segments or data cuts. Talk to an analyst about the scope you need.
Can I get an invoice or pay against a purchase order?
Write to sales@dcmarketinsights.com and our team will help.