
Data Center Automation Market Size, Share & Forecast to 2035
Market at a glance
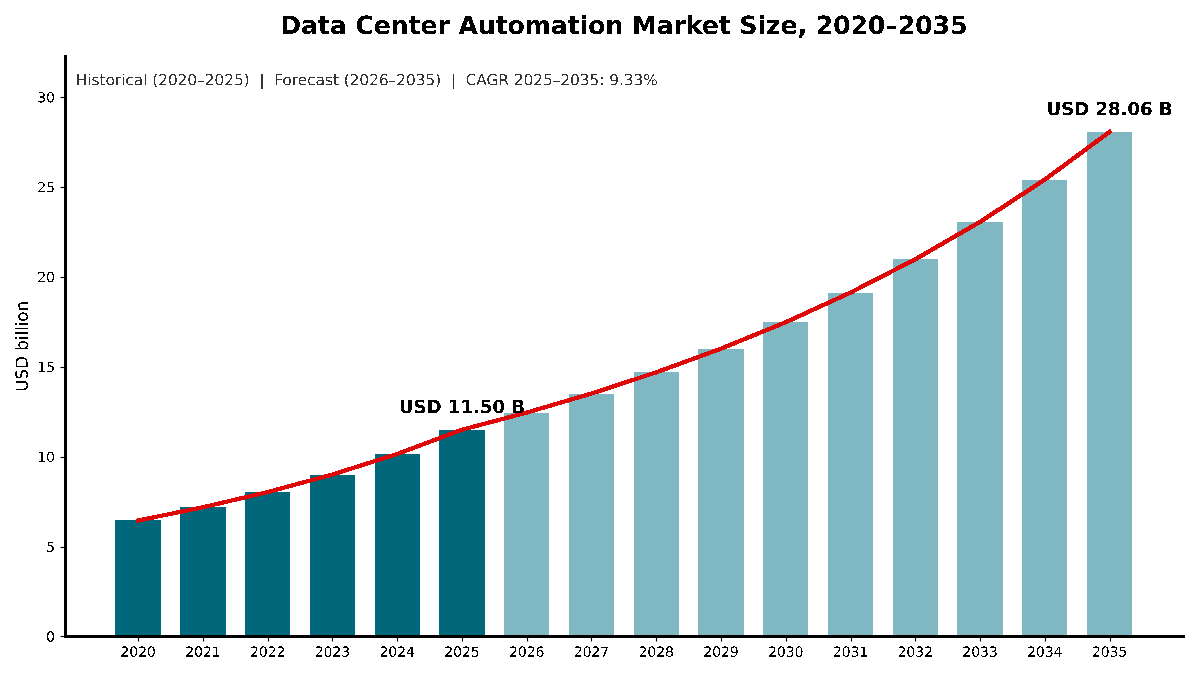
The Data Center Automation market was worth USD 11.50 billion in 2025 and is forecast to reach USD 28.06 billion by 2035, growing at a 9.33% CAGR. North America accounts for 41.7% of the market.
 By Amit Jain, Senior Consultant, ICT & Emerging Technologies
 Reviewed by Deepti Agrawal
Last updated 7 Oct 2026
Base year 2025 PDF + Excel
Reviewed by Deepti Agrawal
Last updated 7 Oct 2026
Base year 2025 PDF + Excel
Source: DC Market Insights analysis
Key findings
Staffing Gaps: 53% of Operators Struggle to Fill Vacant Roles
AI Assistants Move into Automation Platforms
Operators Trust AI for Analytics More Than for Control
GPU and Neocloud Operators Grow Automation Spend More Than Sevenfold
What is inside the report
- 01Introduction
- 02Research Methodology
- 03Executive Summary
- 04Market Dynamics
- 05Pricing and Spend Analysis
- 06Standards and Regulation
- 07Supply Chain and Value Chain Analysis
- 08Global Data Center Automation Market Size and Forecast
- 09Market by Automation Domain
- 10Market by Component
- 20chapters
- 2020-2024Historical period
- 2026-2035Forecast period
- 11Companies profiled
Regional insights
- North America41.7%
- Asia Pacific26.3%
- Europe22.8%
- Latin America4.7%
- Middle East and Africa4.5%
Segmentation
Companies profiled
- IBM (HashiCorp)
- Red Hat
- Broadcom (VMware)
- Cisco
- Hewlett Packard Enterprise (Juniper Networks)
- Arista Networks
- Nutanix
- Schneider Electric
- Vertiv
- ServiceNow
- Dynatrace
Recent developments
IBM completed its acquisition of HashiCorp at an enterprise value of USD 6.4 billion, which brought Terraform, described by IBM as a leader for infrastructure provisioning in hybrid and multi-cloud environments, into IBM (Source: IBM newsroom release).
Broadcom announced general availability of VMware Cloud Foundation 9.0, which includes fleet management for planning, scheduling and executing upgrades (Source: Broadcom press release).
HPE completed its USD 14 billion acquisition of Juniper Networks (Source: Data Center Dynamics news report).
Vertiv acquired Waylay NV, a developer of hyperautomation and generative AI software, to strengthen AI-driven monitoring and control of power and cooling systems (Source: Vertiv press release).
Cisco announced Nexus Dashboard 4.1, which unifies Nexus Fabric Controller, Orchestrator and Insights in one application (Source: Cisco blog post).
Red Hat made Ansible Automation Platform 2.6 generally available with the Ansible Lightspeed intelligent assistant built into the user interface (Source: Red Hat blog post).
Full analysis
The Data Center Automation Market covers the software platforms and services that automate the configuration, provisioning, scheduling, monitoring and remediation of data center networks, servers, storage, workloads and facility power and cooling systems. DC Market Insights values the global Data Center Automation Market at USD 11.50 billion in 2025 and forecasts USD 28.06 billion by 2035, a CAGR of 9.33%. The 2025 value is built from the installed base: about 116.0 GW of installed IT capacity across five operator types, multiplied by third-party automation spend that ranges from USD 0.0503 million per MW per year at hyperscale sites to USD 0.1862 million per MW per year in enterprise data centers, gives a weighted average of about USD 0.099 million per MW and a total of USD 11.50 billion. GPU and neocloud providers are the fastest-growing segment at 22.24% a year because their installed capacity rises from 4.5 GW to 40.0 GW in the DC Market Insights model, and the Middle East and Africa is the fastest-growing region at 12.53% a year as new campuses are built with automated operations from day one.
Executive Summary
The Global Data Center Automation Market size was valued at USD 6.45 billion in 2020, reached USD 11.50 billion in 2025, and is anticipated to reach USD 28.06 billion by 2035, at a CAGR of 9.33% during the forecast period.
| Report attribute | Details |
|---|---|
| Historical Period | 2020-2024 |
| Base Year | 2025 |
| Forecast Period | 2026-2035 |
| Data Center Automation Market Size 2025 | USD 11.50 Billion |
| Data Center Automation Market, CAGR | 9.33% |
| Data Center Automation Market Size 2035 | USD 28.06 Billion |
DC Market Insights estimates that the market grew at 12.27% a year between 2020 and 2025, and that 2025 added 13.3% over 2024, as operators automated network fabrics, server provisioning and alarm handling to run more capacity with the same number of people. Growth eases to 9.33% a year from 2025 to 2035 because most new capacity is built by hyperscale operators, which write much of their own automation code and buy less third-party software per MW than enterprises.
Market Scope: What Does the Data Center Automation Market Cover?
The Data Center Automation Market covers third-party software and services that replace manual operating steps inside data centers, valued at first sale in current US dollars, with 2025 as the base year and forecasts to 2035. DC Market Insights sizes it at USD 11.50 billion in 2025.
Included. Network automation (intent-based fabric managers and configuration tools), server and compute provisioning and configuration management, including infrastructure-as-code tools, storage automation, workload automation and job scheduling, facility automation for power, cooling and data center infrastructure management (DCIM), artificial intelligence for IT operations (AIOps) and automated remediation, plus the professional services and managed services that design, integrate and run these tools.
Excluded. Servers, switches, storage arrays, power and cooling equipment themselves, data center robotics hardware, general enterprise IT service management outside the data center, public cloud consumption charges, and automation code that operators write and run with their own staff.
How the segments fit together. The automation-domain split, the component split, the deployment split, the end-user split and the vertical split each re-cut the same USD 11.50 billion, so every split sums to the market total.
Market Drivers: What Drives the Data Center Automation Market?
Three drivers explain most of the growth in the Data Center Automation Market: a hiring gap that now affects 53% of operators, installed capacity that DC Market Insights expects to grow from about 116.0 GW to about 313.0 GW by 2035, and outages caused by human error and broken procedures.
Staffing Gaps: 53% of Operators Struggle to Fill Vacant Roles
Automation is the main way operators run more megawatts without more engineers. In its 2026 global survey, the Uptime Institute reported that 53% of operators have difficulty finding qualified candidates for vacant roles, up from 46% in 2025, and that 28% have had staff hired away by competitors. In 2025, Uptime also found that, for the first time, more operators found it harder to recruit and retain senior people than early-career staff. DC Market Insights estimates that enterprise data centers spend USD 0.1862 million per MW per year on third-party automation in 2025, almost four times the hyperscale level, because enterprises cannot build large in-house automation teams.
Installed IT Capacity Grows from About 116.0 GW to About 313.0 GW
The Data Center Automation Market is an installed-base market: software subscriptions and managed services are paid on capacity that is already running. The International Energy Agency (IEA) reported that data centers used about 415 terawatt-hours (TWh) of electricity in 2024, around 1.5% of global consumption, and expects this to more than double to around 945 TWh by 2030 (Source: IEA Energy and AI executive summary). The IEA also put global data center investment at half a trillion dollars in 2024. For the United States, BloombergNEF (BNEF) forecasts that US data center power demand could reach 106 GW by 2035, up from about 25 GW of operating data centers in 2024, as reported by Utility Dive. DC Market Insights models global installed IT capacity at about 116.0 GW in 2025 and about 313.0 GW in 2035.
Human Error Causes Major Outages at Nearly 40% of Organizations
Uptime Institute’s 2025 outage analysis found that nearly 40% of organizations suffered a major outage caused by human error over the previous three years, and that 85% of these incidents stemmed from staff failing to follow procedures or from flawed procedures. The share caused by failure to follow procedures rose by ten percentage points compared with 2024. Automated runbooks, configuration checks and closed-loop remediation turn procedures into code, which is why DC Market Insights forecasts AIOps and automated remediation to grow at 11.79% a year, the fastest of the six automation domains.
Market Trends: How Is Data Center Automation Changing?
The Data Center Automation Market is moving toward AI assistants inside automation tools, unified network fabric managers and software that controls power and cooling as well as IT; DC Market Insights expects cloud-delivered tools to grow at 13.56% a year as a result.
AI Assistants Move into Automation Platforms
Automation vendors now build generative AI assistants into the tools operators already use. Red Hat Ansible Automation Platform 2.6, generally available in October 2025, integrates the Ansible Lightspeed intelligent assistant directly into the user interface and adds a self-service automation portal that lets IT operations teams offer automation to a broader set of users. In the Uptime Institute 2026 survey, 71% of respondents said they would trust an adequately trained AI system to perform automated analytics on sensor data or prioritize alarms. DC Market Insights values AIOps and automated remediation at USD 1.62 billion in 2025 and USD 4.94 billion by 2035.
Network Fabric Managers Consolidate into Single Consoles
Network automation is the largest automation domain at USD 2.73 billion (23.7%) in 2025. Suppliers are folding separate controllers into one product: Cisco Nexus Dashboard 4.1 unifies Cisco Nexus Fabric Controller, Orchestrator and Insights into a single application and offers lifecycle management of multiple data center networks through one interface. Hewlett Packard Enterprise (HPE) now sells Apstra Data Center Director, which HPE describes as intent-based networking that is hardware and device operating system vendor agnostic.
Facility Automation Joins the IT Control Layer
Power and cooling suppliers are buying and building automation software. Vertiv acquired Waylay NV, a Belgium-based developer of hyperautomation and generative AI software, as part of its investment in AI-driven monitoring and control of power and cooling systems. Schneider Electric describes its AI infrastructure offer as spanning advanced hardware, intelligent software and services. DC Market Insights values facility automation (power, cooling and DCIM) at USD 2.11 billion in 2025, growing at 10.14% a year to USD 5.53 billion by 2035.
Market Challenges: What Holds the Data Center Automation Market Back?
Limited trust in autonomous actions and fragmented tool estates are the two constraints that DC Market Insights expects to hold enterprise data centers to 3.62% annual growth in automation spend, the slowest of the five operator types.
Operators Trust AI for Analytics More Than for Control
Operators accept automation for low-risk tasks first. The Uptime Institute reported that expectations for AI’s operational benefits declined slightly in 2026, and that trust remains highest for lower-risk applications such as sensor data analytics and predictive maintenance. DC Market Insights assumes the share of AIOps and automated remediation rises from 14.1% of the market in 2025 to 17.6% in 2035, a gradual shift rather than a jump.
Fragmented Tools Raise Integration Costs
Most data centers run separate tools for network, server, storage, workload and facility automation, often from different suppliers. DC Market Insights estimates that professional services, mostly integration work that connects these tools, account for USD 3.14 billion (27.3%) of the market in 2025. Professional services grow at only 7.14% a year, slower than software platforms at 10.02%, as platforms consolidate.
Market Opportunities: Where Are the New Revenue Pools?
The two largest new revenue pools in the Data Center Automation Market are GPU and neocloud providers, whose automation spend grows at 22.24% a year, and regulatory reporting that turns energy and efficiency data into a compliance requirement.
GPU and Neocloud Operators Grow Automation Spend More Than Sevenfold
DC Market Insights estimates that specialist GPU cloud operators spent USD 439.20 million on third-party automation in 2025, and DC Market Insights expects their spend to reach USD 3.27 billion in 2035. These operators run dense clusters with small teams, so automated provisioning and fabric management pay back quickly. Their network fabrics are covered in the Data Center Networking Market report.
Energy Reporting Rules Create Demand for Automated Data Collection
Commission Delegated Regulation (EU) 2024/1364 sets out the information and key performance indicators that operators of data centers with an installed information technology power demand of at least 500 kW must report to a European database (Source: EUR-Lex, Delegated Regulation (EU) 2024/1364). Schneider Electric added model-based automated sustainability metric reporting to EcoStruxure IT to help customers meet requirements such as the European Energy Efficiency Directive (EED). DC Market Insights expects Europe’s automation spend to grow from USD 2.62 billion in 2025 to USD 5.78 billion in 2035, with reporting automation one of the reasons. Operators that modernize older halls to meet these rules are covered in the Data Center Transformation Market report.
Pricing: How Much Do Data Centers Spend on Automation per MW?
The average data center spends about USD 0.099 million per MW of installed IT capacity per year on third-party automation software and services in 2025, according to DC Market Insights estimates, with enterprise sites at USD 0.1862 million and hyperscale sites at USD 0.0503 million.
| Automation spend per MW per year (USD million) | 2020 | 2025 | 2035 |
|---|---|---|---|
| Hyperscale Data Centers | 0.0418 | 0.0503 | 0.0457 |
| Colocation Data Centers | 0.0603 | 0.0847 | 0.1023 |
| Enterprise Data Centers | 0.1397 | 0.1862 | 0.2484 |
| Edge Data Centers | 0.0904 | 0.1408 | 0.1612 |
| GPU and Neocloud Providers | 0.1188 | 0.0976 | 0.0818 |
The weighted average falls from about USD 0.099 million per MW in 2025 to about USD 0.090 million per MW in 2035, even though spend per MW rises for colocation, enterprise and edge sites. The reason is mix: hyperscale and GPU capacity, which buy the least third-party automation per MW, grow fastest.
Standards and Regulation: Which Rules Shape Data Center Automation?
Five sets of rules and standards shape the Data Center Automation Market: European Union energy reporting, national efficiency targets, efficiency metrics, server management interfaces and network data models.
EU data center rating scheme. Commission Delegated Regulation (EU) 2024/1364 of 14 March 2024 establishes the first phase of a common Union rating scheme for data centers and sets the reporting duty at an installed IT power demand of at least 500 kW.
Germany’s Energy Efficiency Act (EnEfG). A 2026 draft amendment, as summarized by the law firm Orrick, proposes values that would ease the power usage effectiveness (PUE) target for 1 July 2027 from 1.5 to 1.6 and for 1 July 2030 from 1.3 to 1.4, and raise the target for new data centers from 1.2 or below to 1.3 or below.
ISO/IEC 30134-2:2026. The International Organization for Standardization (ISO) published the updated PUE standard in January 2026, replacing the 2016 edition. The Uptime Institute put the 2026 industry average PUE at 1.52.
DMTF Redfish. Redfish, from the Distributed Management Task Force (DMTF), is a standard designed to deliver simple and secure management for converged, hybrid IT and the software-defined data center (SDDC).
IETF YANG and ASHRAE thermal guidelines. RFC 7950 from the Internet Engineering Task Force (IETF) defines YANG 1.1, a data modeling language for configuration data, state data, remote procedure calls and notifications used by network management protocols. On the facility side, the American Society of Heating, Refrigerating and Air-Conditioning Engineers (ASHRAE) recommends an inlet temperature range of 18 to 27°C for air-cooled IT equipment in Classes A1 to A4 (18 to 22°C for the high-density Class H1), the band that automated cooling controls hold.
Market Segmentation: Which Segment Leads the Data Center Automation Market?
Network automation leads the Data Center Automation Market by domain with 23.7% of 2025 value, software platforms lead by component with 57.6%, and enterprise data centers lead buyers with 47.0%. GPU and neocloud providers are the fastest-growing segment at 22.24% a year, because their installed capacity grows almost ninefold by 2035 in the DC Market Insights model.
By Automation Domain: Network Automation Leads with 23.7%
| Automation domain | 2025 (USD billion) | Share 2025 | 2035 (USD billion) | CAGR 2025-2035 |
|---|---|---|---|---|
| Network Automation | 2.73 | 23.7% | 7.13 | 10.09% |
| Server and Compute Provisioning | 2.48 | 21.6% | 5.30 | 7.89% |
| Storage Automation | 1.02 | 8.9% | 2.05 | 7.19% |
| Workload Automation and Scheduling | 1.54 | 13.4% | 3.11 | 7.29% |
| Facility Automation (Power, Cooling and DCIM) | 2.11 | 18.3% | 5.53 | 10.14% |
| AIOps and Automated Remediation | 1.62 | 14.1% | 4.94 | 11.79% |
Network automation gains share because AI clusters multiply the number of switch ports and fabric changes per MW.
By Component: Software Platforms Lead with 57.6%
| Component | 2025 (USD billion) | Share 2025 | 2035 (USD billion) | CAGR 2025-2035 |
|---|---|---|---|---|
| Software Platforms | 6.62 | 57.6% | 17.20 | 10.02% |
| Professional Services | 3.14 | 27.3% | 6.26 | 7.14% |
| Managed Automation Services | 1.74 | 15.1% | 4.60 | 10.24% |
Managed automation services grow fastest among components because operators that cannot hire enough engineers buy the outcome instead of the tool.
By End-user: Enterprise Data Centers Lead with 47.0%
| End-user | 2025 (USD billion) | Share 2025 | 2035 (USD billion) | CAGR 2025-2035 |
|---|---|---|---|---|
| Enterprise Data Centers | 5.40 | 47.0% | 7.70 | 3.62% |
| Colocation Data Centers | 2.71 | 23.6% | 7.98 | 11.40% |
| Hyperscale Data Centers | 2.32 | 20.1% | 6.85 | 11.47% |
| Edge Data Centers | 0.63 | 5.5% | 2.26 | 13.54% |
| GPU and Neocloud Providers | 0.44 | 3.8% | 3.27 | 22.24% |
Enterprises hold only about a quarter of installed capacity in the DC Market Insights model but buy almost half of third-party automation, because they buy rather than build. Colocation overtakes enterprise spending by 2035 as providers automate tenant onboarding, power billing and cooling at portfolio scale.
By Deployment: On-Premises Leads with 52.3%
On-premises automation software is worth USD 6.01 billion (52.3%) in 2025 and grows at 6.01% a year to USD 10.77 billion by 2035. Hybrid deployments, with a cloud control plane and on-site agents, are worth USD 3.29 billion (28.6%) and grow at 11.14% a year. Cloud-delivered software as a service (SaaS) is worth USD 2.20 billion (19.1%) and grows fastest at 13.56% a year, reaching USD 7.83 billion by 2035.
By Vertical: IT and Telecom Lead with 38.4%
IT and telecom operators account for USD 4.41 billion (38.4%) of 2025 demand and grow at 9.81% a year. Banking, financial services and insurance (BFSI) follows with USD 2.10 billion (18.3%), then government and defense with USD 1.29 billion (11.2%), retail and e-commerce with USD 1.12 billion (9.7%), healthcare with USD 931.24 million (8.1%), energy and utilities with USD 735.80 million (6.4%) and others with USD 908.25 million (7.9%). Energy and utilities grow fastest outside IT and telecom at 10.63% a year.
DC Exclusive: The Automation Spend per MW Model and Domain × Operator Matrix
At USD 1.44 billion in 2025, server and compute provisioning in enterprise data centers is the single largest cell of the matrix and 12.5% of all data center automation spending.
| 2025, USD billion | Hyperscale | Colocation | Enterprise | Edge | GPU and Neocloud | Total |
|---|---|---|---|---|---|---|
| Network Automation | 0.72 | 0.65 | 1.09 | 0.15 | 0.12 | 2.73 |
| Server and Compute Provisioning | 0.35 | 0.47 | 1.44 | 0.13 | 0.09 | 2.48 |
| Storage Automation | 0.11 | 0.22 | 0.62 | 0.04 | 0.03 | 1.02 |
| Workload Automation and Scheduling | 0.19 | 0.20 | 1.01 | 0.06 | 0.08 | 1.54 |
| Facility Automation (Power, Cooling and DCIM) | 0.57 | 0.77 | 0.54 | 0.16 | 0.07 | 2.11 |
| AIOps and Automated Remediation | 0.38 | 0.40 | 0.70 | 0.09 | 0.05 | 1.62 |
| Total | 2.32 | 2.71 | 5.40 | 0.63 | 0.44 | 11.50 |
Hyperscale operators spend 31% of their third-party automation budget on network automation, while colocation providers spend 28% on facility automation, the highest facility share of any buyer, because power and cooling are what they sell. Enterprise data centers spend 57% of their budget on server provisioning, storage and workload scheduling, the domains that grow slowest.
The matrix and every figure on this page come from a DC Market Insights model, not a shipment or license count: the market is built from 36 inputs: 15 capacity anchors (5 operator types in 2020, 2025 and 2035), 15 automation spend-per-MW anchors and 6 automation-domain shares, with intermediate years interpolated. The model and its assumptions are explained on our research methodology page.
Regional Insights: Which Region Leads the Data Center Automation Market?
North America leads the Data Center Automation Market with 41.7% of 2025 value, and the Middle East and Africa is the fastest-growing region at 12.53% a year, because, in the DC Market Insights view, new campuses there are built with automated operations from the start.
North America Leads with 41.7% Share
DC Market Insights estimates that North American operators spent USD 4.80 billion on data center automation in 2025, and the region is forecast to reach USD 10.89 billion in 2035, a CAGR of 8.55%. The IEA expects the United States to account for by far the largest share of the projected increase in data center electricity use to 2030.
Asia Pacific Holds 26.3% Share
Asia Pacific is worth USD 3.02 billion in 2025 and USD 8.28 billion by 2035, a CAGR of 10.60%. The IEA names China as the second-largest source of growth in data center electricity use.
Europe Holds 22.8% Share
Europe is worth USD 2.62 billion in 2025 and USD 5.78 billion by 2035, a CAGR of 8.23%. EU reporting rules and national PUE targets tilt European demand toward facility automation.
Latin America Holds 4.7% Share
Latin America is worth USD 540.35 million in 2025 and USD 1.43 billion by 2035, a CAGR of 10.23%, led by Brazil.
Middle East and Africa Holds 4.5% Share
The Middle East and Africa is worth USD 517.36 million in 2025 and USD 1.68 billion by 2035, growing at 12.53% a year, the fastest of any region. DC Market Insights expects new hyperscale and AI campuses in the Gulf to start with automated network and facility operations, which raises spend per MW compared with older sites elsewhere.
Country Analysis: Which Countries Spend the Most on Data Center Automation?
The United States is the largest country market for data center automation at USD 4.28 billion in 2025, 37.2% of global value, followed by China at USD 1.11 billion (9.6%) and the United Kingdom at USD 622.13 million (5.4%).
| Rank | Country | Region | 2025 (USD billion) | Share 2025 | 2035 (USD billion) | CAGR 2025-2035 |
|---|---|---|---|---|---|---|
| 1 | United States | North America | 4.28 | 37.2% | 9.63 | 8.45% |
| 2 | China | Asia Pacific | 1.11 | 9.6% | 2.92 | 10.22% |
| 3 | United Kingdom | Europe | 0.62 | 5.4% | 1.29 | 7.60% |
| 4 | Japan | Asia Pacific | 0.60 | 5.2% | 1.41 | 8.92% |
| 5 | Germany | Europe | 0.59 | 5.1% | 1.30 | 8.22% |
| 6 | Canada | North America | 0.52 | 4.5% | 1.26 | 9.33% |
| 7 | France | Europe | 0.35 | 3.0% | 0.76 | 8.20% |
| 8 | India | Asia Pacific | 0.30 | 2.6% | 1.16 | 14.45% |
| 9 | Australia | Asia Pacific | 0.28 | 2.4% | 0.74 | 10.23% |
| 10 | Brazil | Latin America | 0.25 | 2.2% | 0.65 | 9.84% |
| 11 | Netherlands | Europe | 0.24 | 2.1% | 0.51 | 7.69% |
| 12 | South Korea | Asia Pacific | 0.22 | 1.9% | 0.57 | 9.92% |
India is the fastest-growing large country market at 14.45% a year, as hyperscale and colocation operators add capacity and buy automation with it. The country figures are a DC Market Insights allocation of the regional totals, weighted by each country’s estimated share of installed and new data center capacity and its mix of enterprise and cloud operators.
Forecast Scenarios: How Could the 2035 Forecast Change?
The Data Center Automation Market reaches USD 28.06 billion by 2035 in the base case, with a range of USD 23.43 billion to USD 32.05 billion across the low and high scenarios.
| Scenario | Assumption from 2026 | 2035 (USD billion) | CAGR 2025-2035 |
|---|---|---|---|
| Low | Installed capacity about 10% below base and spend per MW about 7% lower as hyperscale and GPU operators build more automation in-house | 23.43 | 7.38% |
| Base | Installed capacity reaches about 313.0 GW; weighted spend about USD 0.090 million per MW | 28.06 | 9.33% |
| High | Installed capacity about 8% above base and spend per MW about 6% higher as colocation and enterprise sites adopt closed-loop AIOps faster | 32.05 | 10.80% |
The high case assumes operators trust automated control actions sooner than survey results suggest today. The make-or-buy decision of the largest operators is the main swing factor: a 15% change in hyperscale spend per MW moves the 2035 total by about USD 1.03 billion.
Competitive Insights: Who Leads the Data Center Automation Market?
- IBM (HashiCorp)
- Red Hat
- Broadcom (VMware)
- Cisco
- Hewlett Packard Enterprise (Juniper Networks)
- Arista Networks
- Nutanix
- Schneider Electric
- Vertiv
- ServiceNow
- Dynatrace
The Data Center Automation Market is fragmented: DC Market Insights estimates that no single supplier holds more than about 6% of the market, because network, server, workload and facility automation are sold by different supplier groups. As a reference point, HashiCorp’s last reported annual revenue of USD 583.1 million for the fiscal year ended January 31, 2024 (Source: HashiCorp annual report filed with the US Securities and Exchange Commission), equals about 5.7% of a USD 10.15 billion market in 2024; even that share is an upper bound, because not all of HashiCorp’s revenue comes from data center automation. IBM completed its acquisition of HashiCorp for USD 35 per share in cash, an enterprise value of USD 6.4 billion, and describes Terraform as a leader for infrastructure provisioning in hybrid and multi-cloud environments. HPE completed its acquisition of Juniper Networks, a deal that doubles the size of HPE’s networking business (Source: HPE filing with the US Securities and Exchange Commission). In the DC Market Insights view, Cisco and HPE compete mainly in network automation, Red Hat and IBM in configuration management and provisioning, Schneider Electric and Vertiv in facility automation, and ServiceNow and Dynatrace in AIOps and automated remediation. ServiceNow and Dynatrace agreed a multi-year collaboration to advance autonomous IT operations, with Dynatrace bringing root cause analysis, prediction and automated remediation.
Recent Developments
- In February 2025, IBM completed its acquisition of HashiCorp at an enterprise value of USD 6.4 billion, which brought Terraform, described by IBM as a leader for infrastructure provisioning in hybrid and multi-cloud environments, into IBM (Source: IBM newsroom release).
- In June 2025, Broadcom announced general availability of VMware Cloud Foundation 9.0, which includes fleet management for planning, scheduling and executing upgrades (Source: Broadcom press release).
- In July 2025, HPE completed its USD 14 billion acquisition of Juniper Networks (Source: Data Center Dynamics news report).
- In August 2025, Vertiv acquired Waylay NV, a developer of hyperautomation and generative AI software, to strengthen AI-driven monitoring and control of power and cooling systems (Source: Vertiv press release).
- In September 2025, Cisco announced Nexus Dashboard 4.1, which unifies Nexus Fabric Controller, Orchestrator and Insights in one application (Source: Cisco blog post).
- In October 2025, Red Hat made Ansible Automation Platform 2.6 generally available with the Ansible Lightspeed intelligent assistant built into the user interface (Source: Red Hat blog post).
We follow these deals, launches and capacity announcements as they happen in our data center industry updates.
Methodology: How We Built the Data Center Automation Market Model
DC Market Insights built this market bottom-up from installed IT capacity for 5 operator types (hyperscale, colocation, enterprise, edge, and GPU and neocloud), anchored in 2020, 2025 and 2035 and interpolated for the years between: about 77.8 GW in 2020, 116.0 GW in 2025 and 313.0 GW in 2035. Each operator type has its own third-party automation spend per MW per year. Capacity multiplied by spend per MW gives the market in each year: USD 6.45 billion in 2020, USD 11.50 billion in 2025, USD 17.48 billion in 2030 and USD 28.06 billion in 2035. The total was split by 6 automation domains, 3 components, 3 deployment models, 5 end-users, 7 verticals and 5 regions, and every split sums to the market total. The result was checked top-down against supplier disclosures: HashiCorp’s USD 583.1 million fiscal 2024 revenue as an upper-bound share of about 6%, Nutanix’s fiscal 2025 revenue of USD 2.54 billion as a scale check, and the IEA estimate of half a trillion dollars of data center investment in 2024, against which automation spending of USD 10.15 billion in 2024 is about 2%. The analyst named on this page built the model, and the reviewer checked the arithmetic, the sources and the dates before publication.
Table of contents
- 01Introduction
- 1.1Market Definition and Scope
- 1.2Automation Domains, Buyers and Regions Covered
- 1.3Currency, Base Year and Forecast Period
- 1.4Key Questions Answered
- 02Research Methodology
- 2.1Automation Spend per MW Model
- 2.2Installed Capacity by Operator Type
- 2.3Make-or-Buy Assumptions by Operator Type
- 2.4Top-Down Check Against Supplier Disclosures
- 2.5Assumptions and Limitations
- 03Executive Summary
- 3.1Market at a Glance, 2020-2035
- 3.2Key Findings
- 3.3Analyst Recommendations by Buyer Type
- 04Market Dynamics
- 4.1Drivers
- 4.2Challenges and Restraints
- 4.3Opportunities
- 4.4Trends
- 4.5Impact Analysis of Drivers and Challenges, 2025-2035
- 05Pricing and Spend Analysis
- 5.1Automation Spend per MW by Operator Type, 2020, 2025 and 2035
- 5.2Weighted Average Spend per MW, 2020-2035
- 5.3Subscription and Services Pricing Models
- 06Standards and Regulation
- 6.1Commission Delegated Regulation (EU) 2024/1364
- 6.2Germany's Energy Efficiency Act (EnEfG)
- 6.3ISO/IEC 30134-2:2026 (PUE)
- 6.4DMTF Redfish
- 6.5IETF YANG and ASHRAE Thermal Guidelines
- 07Supply Chain and Value Chain Analysis
- 7.1Software Platform Suppliers
- 7.2Equipment Suppliers with Automation Software
- 7.3System Integrators and Managed Service Providers
- 7.4Mergers and Platform Consolidation
- 08Global Data Center Automation Market Size and Forecast
- 8.1Market Size, 2020-2024
- 8.2Market Size, 2025
- 8.3Market Forecast, 2026-2035
- 09Market by Automation Domain
- 9.1Network Automation
- 9.2Server and Compute Provisioning
- 9.3Storage Automation
- 9.4Workload Automation and Scheduling
- 9.5Facility Automation (Power, Cooling and DCIM)
- 9.6AIOps and Automated Remediation
- 10Market by Component
- 10.1Software Platforms
- 10.2Professional Services
- 10.3Managed Automation Services
- 11Market by Deployment
- 11.1On-Premises
- 11.2Hybrid
- 11.3Cloud-Delivered (SaaS)
- 12Market by End-user
- 12.1Hyperscale Data Centers
- 12.2Colocation Data Centers
- 12.3Enterprise Data Centers
- 12.4Edge Data Centers
- 12.5GPU and Neocloud Providers
- 13Market by Vertical
- 13.1IT and Telecom
- 13.2BFSI
- 13.3Government and Defense
- 13.4Healthcare
- 13.5Retail and E-commerce
- 13.6Energy and Utilities
- 13.7Others
- 14DC Exclusive: Domain × Operator Matrix
- 14.1Automation Domain × Operator Type Matrix, 2025
- 14.2Implications for Suppliers
- 15Market by Region
- 15.1North America (United States, Canada)
- 15.2Europe (United Kingdom, Germany, France, Netherlands, Rest of Europe)
- 15.3Asia Pacific (China, Japan, India, Australia, South Korea, Rest of Asia Pacific)
- 15.4Latin America (Brazil, Rest of Latin America)
- 15.5Middle East and Africa
- 15.6Top 12 Countries, 2025 and 2035
- 16Regional Cross-Sections
- 16.1Region Shares, 2025 and 2035
- 16.2Region Growth Rates, 2025-2035
- 17Forecast Scenarios
- 17.1Base, Low and High Cases to 2035
- 17.2Sensitivity to Installed Capacity
- 17.3Sensitivity to Hyperscale Make-or-Buy Decisions
- 18Competitive Landscape
- 18.1Market Fragmentation and Largest Supplier Share, 2025
- 18.2Mergers and Acquisitions, 2025
- 18.3Product Launches, 2025
- 19Company Profiles
- 19.1IBM (HashiCorp)
- 19.2Red Hat
- 19.3Broadcom (VMware)
- 19.4Cisco
- 19.5Hewlett Packard Enterprise (Juniper Networks)
- 19.6Arista Networks
- 19.7Nutanix
- 19.8Schneider Electric
- 19.9Vertiv
- 19.10ServiceNow
- 19.11Dynatrace
- 20Analyst Recommendations
- 20.1For Automation Software Suppliers
- 20.2For Data Center Operators
- 20.3For Investors
- Fig. 1Data Center Automation Market Size, 2020-2035
- Fig. 2Installed IT Capacity by Operator Type, 2020, 2025 and 2035
- Fig. 3Automation Spend per MW by Operator Type, 2020, 2025 and 2035
- Fig. 4Market Share by Automation Domain, 2025 and 2035
- Fig. 5Market Share by Component, 2025 and 2035
- Fig. 6Market Share by End-user, 2025 and 2035
- Fig. 7Automation Domain × Operator Type Matrix, 2025
- Fig. 8Market by Region, 2025 and 2035
- Fig. 9Top 12 Countries, 2025
- Fig. 10Forecast Scenarios, 2035
- Table 1Report Attributes
- Table 2Automation Spend per MW, 2020, 2025 and 2035
- Table 3Market by Automation Domain, 2025 and 2035
- Table 4Market by Component, 2025 and 2035
- Table 5Market by Deployment, 2025 and 2035
- Table 6Market by End-user, 2025 and 2035
- Table 7Market by Vertical, 2025 and 2035
- Table 8Automation Domain × Operator Type Matrix, 2025
- Table 9Market by Region, 2025 and 2035
- Table 10Top 12 Countries, 2025 and 2035
- Table 11Forecast Scenarios, 2035
- Table 12Mergers, Acquisitions and Launches, 2025
- Table 13Company Profiles: Products and Data Center Focus
About this report
Written by Amit Jain and reviewed by Deepti Agrawal, Senior Editor, Research. Figures are built top-down and bottom-up and reconciled before publication, with 2025 as the base year.
Read our methodologyHow we built this
- Historical period2020-2024
- Base year2025
- Forecast period2026-2035
- Sizing approachTop-down + bottom-up
Need more than the report?
Advisory on this market
Due diligence, site selection and market entry work, by the analysts who wrote this report.
See consulting servicesFrequently asked questions
USD 11.50 billion in 2025, rising to USD 28.06 billion by 2035. DC Market Insights estimates the market at USD 6.45 billion in 2020.
9.33% a year from 2025 to 2035. Growth was faster, at 12.27% a year, between 2020 and 2025 as operators automated networks, servers and alarm handling.
Network automation, with USD 2.73 billion or 23.7% of the market in 2025. AIOps and automated remediation is the fastest-growing domain at 11.79% a year.
About USD 0.099 million per MW of installed IT capacity per year in 2025, according to DC Market Insights estimates, from USD 0.0503 million at hyperscale sites to USD 0.1862 million in enterprise data centers.
North America, with USD 4.80 billion or 41.7% of 2025 value. The Middle East and Africa grows fastest at 12.53% a year.
No single supplier holds more than about 6% of the market (DC Market Insights estimate). IBM, Red Hat, Broadcom, Cisco, Hewlett Packard Enterprise, Arista Networks, Nutanix, Schneider Electric, Vertiv, ServiceNow and Dynatrace are the suppliers profiled in this report.
Enterprise data centers, with USD 5.40 billion or 47.0% of 2025 demand. GPU and neocloud providers grow fastest at 22.24% a year.
53% of operators report difficulty finding qualified candidates, and nearly 40% of organizations suffered a major outage caused by human error over three years, according to the Uptime Institute.
Licences, delivery and payment
Which licence should I choose?
Single User is a view-only PDF for one person. Multi User adds a printable PDF and the Excel data for unlimited users at one location. Enterprise covers your whole company and includes 100 free analyst hours.
How and when will I receive the report?
By email, within 24–48 business hours of payment, in the formats of your licence.
How can I pay?
Securely through PayPal: with a PayPal account, a debit or credit card, or PayPal Pay Later where available. Prices are in US dollars.
Can I see a sample first?
Yes. Request a free sample and we will email it to you.
Can the report be tailored to my needs?
Yes. We can add countries, segments or data cuts. Talk to an analyst about the scope you need.
Can I get an invoice or pay against a purchase order?
Write to sales@dcmarketinsights.com and our team will help.