
Rugged Server Market Size, Share & Forecast to 2035
Market at a glance
The Rugged Server market was worth USD 1,070.0 million in 2025 and is forecast to reach USD 2,670.0 million by 2035, growing at a 9.57% CAGR. North America accounts for 44.2% of the market.
 By Amit Jain, Senior Consultant, ICT & Emerging Technologies
 Reviewed by Deepti Agrawal
Last updated 7 Oct 2026
Base year 2025 PDF + Excel
Reviewed by Deepti Agrawal
Last updated 7 Oct 2026
Base year 2025 PDF + Excel
Source: DC Market Insights analysis
Key findings
Defense Programs Lift Military Rugged Server Spend from USD 591.27 Million to USD 1.45 Billion
Short-Depth Chassis Replace Full-Depth Racks
Qualification Cycles Lag Processor Generations
GPU Retrofits Across Existing Defense Platforms
What is inside the report
- 01Introduction
- 02Research Methodology
- 03Executive Summary
- 04Market Dynamics
- 05Pricing Analysis
- 06Standards and Regulation
- 07Supply Chain Analysis
- 08Market Size and Forecast
- 09Market by End Use
- 10Market by Form Factor
- 20chapters
- 2020-2024Historical period
- 2026-2035Forecast period
- 12Companies profiled
Regional insights
- North America44.2%
- Europe23.8%
- Asia Pacific22.1%
- Middle East and Africa6.2%
- Latin America3.7%
Segmentation
Companies profiled
- Dell Technologies
- Hewlett Packard Enterprise (HPE)
- Lenovo
- Supermicro
- Mercury Systems
- Curtiss-Wright
- Kontron
- Crystal Group
- Trenton Systems
- General Micro Systems
- Systel
- Advantech
Recent developments
Dell introduced the PowerEdge XR9700, an IP66-rated outdoor server with closed-loop liquid cooling that operates from -40°C to 46°C and supports up to 15 5G sectors for cloud RAN and edge AI (Source: The Mobile Network news report).
HPE expanded its rugged ProLiant edge portfolio with the EL2000 chassis, EL220 and EL240 Gen12 servers and the DL145 Gen11, rated from -40°C to 55°C with optional NVIDIA RTX PRO Blackwell GPUs (Source: HPE announcement).
Mercury Systems received a multi-year order from distributor Blue Raven for 1,000 RTBX06 BuiltSECURE rugged servers, its largest production order for its Common Processing Architecture servers (Source: Mercury Systems press release).
Curtiss-Wright introduced the PacStar 810 rugged edge server with a 64-core AMD EPYC processor, up to 1 TB of DDR5 memory and a GPU with 96 GB of GDDR7 memory (Source: Military & Aerospace Electronics product report).
Kontron launched the µDARC ruggedized microserver, an IP67 sealed Arm-based system that draws less than 5 W and weighs 735 g (Source: Kontron press release).
Crystal Group integrated Intel Xeon 6 processors with up to 144 cores into its rugged computing portfolio (Source: Crystal Group press release).
Full analysis
The Rugged Server Market covers rack-mount, short-depth, small form factor and outdoor enclosed servers built to keep running through shock, vibration, extreme temperature, dust, moisture and electromagnetic interference, for defense, telecom, industrial, energy, transport and public safety use. DC Market Insights values the global Rugged Server Market at USD 1.07 billion in 2025 and forecasts USD 2.67 billion by 2035, a CAGR of 9.57%. The 2025 value is built from units and prices: about 67,200 rugged servers shipped across 6 end uses at an average of USD 15,909 per unit, from USD 9,774 for an industrial edge server to USD 23,848 for a fully rugged military server. GPU-accelerated servers are the fastest-growing segment at 16.11% a year because inference workloads are moving into vehicles, command posts and cell sites, and Asia Pacific is the fastest-growing region at 10.46% a year in the DC Market Insights model, led by India, South Korea and Australia.
Executive Summary
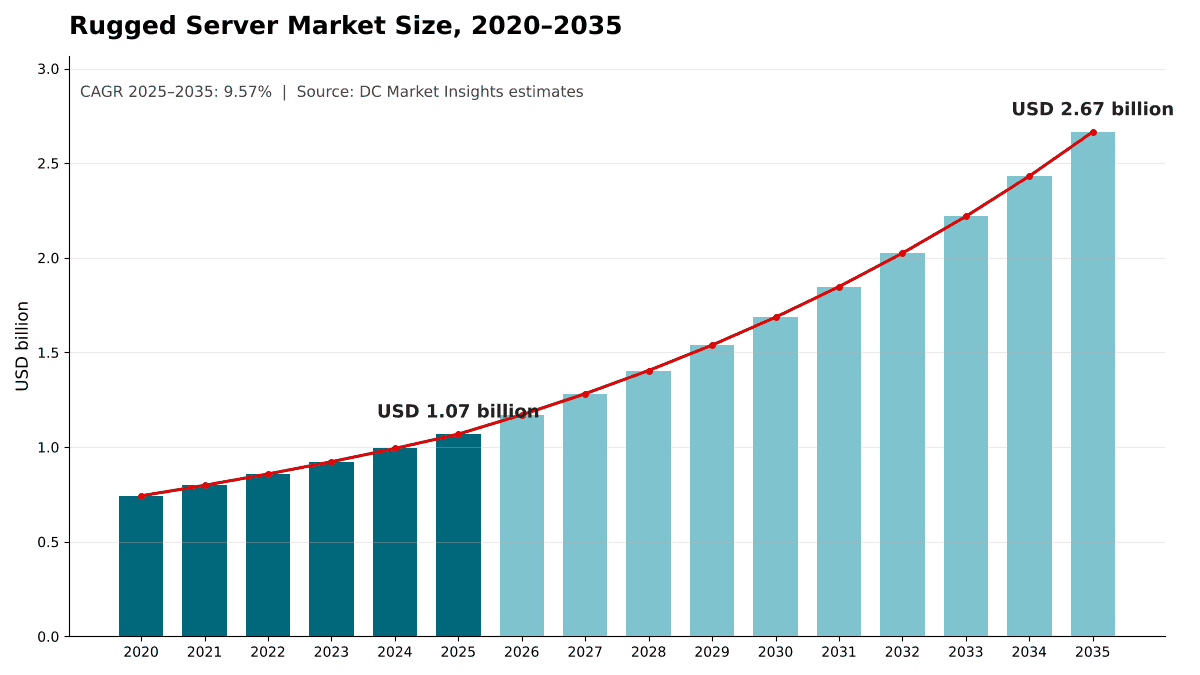
The Global Rugged Server Market size was valued at USD 742.61 million in 2020, reached USD 1.07 billion in 2025, and is anticipated to reach USD 2.67 billion by 2035, at a CAGR of 9.57% during the forecast period.
| Report attribute | Details |
|---|---|
| Historical Period | 2020-2024 |
| Base Year | 2025 |
| Forecast Period | 2026-2035 |
| Rugged Server Market Size 2025 | USD 1.07 Billion |
| Rugged Server Market, CAGR | 9.57% |
| Rugged Server Market Size 2035 | USD 2.67 Billion |
The market grew at 7.55% a year between 2020 and 2025, and 2025 added 7.6% over 2024. In the DC Market Insights model, military and defense buyers supplied about half of that growth as vehicles, ships and aircraft took on more server-class computing. DC Market Insights expects growth to accelerate to 9.57% a year from 2025 to 2035 for three reasons: allied defense budgets are rising toward the targets agreed in 2025, operators of cloud radio access networks (cloud RAN) are moving servers onto poles and rooftops, and graphics processing unit (GPU) servers are now being built in rugged form. Unit shipments rise from about 67,200 in 2025 to about 143,600 in 2035, and the average price per unit rises from USD 15,909 to USD 18,556 as more servers ship with accelerators.
Market Scope: What Does the Rugged Server Market Cover?
The Rugged Server Market covers servers designed and tested to operate outside a conditioned data hall, valued at first sale in current US dollars, with 2025 as the base year and forecasts to 2035. DC Market Insights sizes it at USD 1.07 billion in 2025.
Included. Fully rugged servers qualified to military environmental and electromagnetic standards, telecom-grade servers built to Network Equipment-Building System (NEBS) requirements, semi-rugged and industrial servers with extended temperature ranges, outdoor enclosed servers for pole, wall and rooftop mounting, and the integrated storage, accelerators, power supplies and enclosures sold with them.
Excluded. Rugged laptops, tablets and handheld computers, single-board computers and embedded modules sold on their own, mission computers integrated into avionics, standard data center servers, software and services, and installation labor.
How the segments fit together. Every rugged server sold in 2025 sits once in each of 4 splits: end use (who buys it), form factor (what shape it is), ruggedization level (which standard it is built to) and compute configuration (whether it carries an accelerator). Each split sums to USD 1.07 billion in 2025 and USD 2.67 billion in 2035. Edge sites that also host standard servers are covered in the Edge Computing Market report.
Market Drivers: What Drives the Rugged Server Market?
Military and defense buyers account for 55.3% of rugged server spending in 2025, so defense budgets set the pace of the Rugged Server Market, with telecom edge deployments and AI inference at the edge adding the fastest new demand.
Defense Programs Lift Military Rugged Server Spend from USD 591.27 Million to USD 1.45 Billion
DC Market Insights estimates military and defense spending on rugged servers at USD 591.27 million in 2025, rising to USD 1.45 billion in 2035, a CAGR of 9.36%. Budget commitments support that path. At their June 2025 summit in The Hague, NATO allies committed to invest 5% of gross domestic product (GDP) annually on core defense requirements and defense- and security-related spending by 2035, with at least 3.5% of GDP on core defense (Source: The Hague Summit Declaration). The US Department of Defense requested USD 961.60 billion for fiscal 2026, of which USD 113.30 billion comes through reconciliation. Supplier order books are rising with these budgets: Mercury Systems ended fiscal 2026 with a backlog of over USD 1.90 billion, about USD 540.00 million higher than a year earlier, on fiscal 2026 bookings of USD 1.50 billion and a book-to-bill ratio of 1.57.
AI Inference Moves into Vehicles, Ships and Command Posts
GPU-accelerated rugged servers are worth USD 292.79 million in 2025 and reach USD 1.30 billion by 2035, a CAGR of 16.11% and the fastest of any segment in the model. Sensor processing, video analytics and command-and-control software now need server-class compute at the point of collection. Suppliers have responded with accelerated designs: Curtiss-Wright’s PacStar 810, introduced in September 2026, pairs a 64-core AMD EPYC processor with a GPU carrying 96 GB of GDDR7 memory in a system of about 20 pounds for mobile data centers, expeditionary command posts and vehicle platforms. HPE’s rugged ProLiant edge systems offer NVIDIA RTX PRO 4500 or 6000 Blackwell Server Edition GPUs. DC Market Insights forecasts the GPU-accelerated share of the market to rise from 27.4% in 2025 to 48.9% in 2035.
Cloud RAN Takes Servers onto Poles and Rooftops
Telecommunications is the fastest-growing end use at 11.36% a year, from USD 163.58 million in 2025 to USD 479.91 million in 2035. Many cloud RAN servers must sit at the cell site. In February 2026, Dell introduced the PowerEdge XR9700, an IP66-rated outdoor server that operates from -40°C to 46°C with closed-loop liquid cooling and supports up to 15 5G sectors in a single server, designed for utility poles, rooftops and building walls. Supermicro sells pole-mountable outdoor edge systems with IP65 enclosures that operate from -40°C to 50°C depending on configuration. Outdoor enclosed servers are the fastest-growing form factor at 13.05% a year.
Market Trends: How Are Rugged Servers Changing?
Rugged servers are getting shorter, more powerful and more secure: short-depth edge servers grow at 10.99% a year, against 7.65% for full rack-mount designs.
Short-Depth Chassis Replace Full-Depth Racks
Vehicle bays, ship compartments and telecom cabinets rarely fit a standard server. Dell’s PowerEdge XR11 and XR12 use a 16-inch chassis, less than half the depth of a standard server, and are NEBS, MIL-STD and marine compliant. General Micro Systems builds its Shorty 4 rack-mount servers for surface combatants and submarines on a 16-inch deep frame. DC Market Insights values short-depth edge servers at USD 259.66 million (24.3%) in 2025 and USD 736.44 million (27.6%) in 2035.
Data Center Processors Reach the Rugged Edge
Rugged suppliers now ship the same processor generations as data center servers. In February 2025, Crystal Group integrated Intel Xeon 6 processors with up to 144 cores into its rugged computing portfolio. HPE’s rugged ProLiant DL145 Gen11 uses AMD EPYC 8005 series processors with up to 84 cores, and its EL220 and EL240 Gen12 servers use Intel Xeon 6. Mercury Systems describes its BuiltSECURE servers as using the latest data center-class compute silicon. The gap between a rugged server and a data hall server is now the enclosure, cooling and qualification, not the processor.
Trusted Supply Chains Become a Purchase Requirement
Defense buyers increasingly specify where boards are designed and built. Mercury Systems’ Rugged Trusted BuiltSECURE (RTB) servers use US-designed and manufactured motherboards, Trenton Systems supplied servers with FIPS 140-2-certified self-encrypting drives for a Joint All-Domain Command and Control (JADC2) program, and Kontron markets its µDARC microserver as free of International Traffic in Arms Regulations (ITAR) controls. Security features add cost per unit and favor suppliers with domestic manufacturing.
Market Challenges: What Holds the Rugged Server Market Back?
A price premium of about 2.4 times over industrial edge servers and long qualification cycles are the two constraints that DC Market Insights expects to slow the Rugged Server Market, together with the heat that accelerators bring into sealed enclosures.
Qualification Cycles Lag Processor Generations
A fully rugged military server costs USD 23,848 on average in 2025 against USD 9,774 for an industrial edge server, according to DC Market Insights estimates. Much of the difference pays for testing to environmental and electromagnetic standards and for long-term supply. Kontron, for example, guarantees a minimum of 10 years of production availability for its µDARC microserver. Each new processor generation must be requalified, so rugged platforms often trail data center launches, and defense programs that lock a configuration for years keep CPU-only servers in production. CPU-only servers still hold 63.8% of 2025 value and grow at only 4.90% a year.
Accelerators Bring Heat into Sealed Enclosures
Dust, salt fog and moisture push designers toward sealed enclosures, but a sealed box cannot move air through a GPU. Liquid cooling is the response at the top end: Dell’s PowerEdge XR9700 uses a closed-loop liquid cooling system with a heater module for outdoor deployment. DC Market Insights expects cooling to stay the main design limit on rugged GPU servers through 2030, which keeps the GPU-accelerated share below half of market value through 2035.
Market Opportunities: Where Are the New Revenue Pools?
The two largest new revenue pools in the Rugged Server Market are GPU-accelerated servers, which add USD 1.01 billion of annual sales between 2025 and 2035, and European defense demand, which grows at 10.15% a year.
GPU Retrofits Across Existing Defense Platforms
Ground vehicles, ships and aircraft already carry rugged servers that were specified before AI workloads existed. Replacing them with accelerated units lifts the military average price from USD 23,848 in 2025 to USD 30,231 in 2035 in the DC Market Insights model. Suppliers that can fit a GPU into an existing short-depth slot win the refresh without a platform redesign. Server makers following the same shift in the data hall are covered in the Data Center Server Market report.
Europe Rebuilds Defense Computing Capacity
Europe is worth USD 254.32 million in 2025 and USD 668.47 million by 2035. The NATO commitment to reach 5% of GDP by 2035 includes up to 1.5% of GDP to protect critical infrastructure, defend networks and strengthen civil preparedness and resilience, which widens demand beyond armed forces to grid operators and public safety networks. Germany grows fastest among large European markets at 11.33% a year.
Pricing: How Much Does a Rugged Server Cost?
A rugged server sold for USD 15,909 on average in 2025, and DC Market Insights forecasts USD 18,556 by 2035. Prices vary by end use with the level of ruggedization, testing and security each buyer requires.
| Average price per unit (USD) | 2025 | 2035 | Units 2025 | Units 2035 |
|---|---|---|---|---|
| Military and Defense | 23,848 | 30,231 | 24,793 | 47,867 |
| Telecommunications | 11,120 | 12,162 | 14,711 | 39,460 |
| Industrial and Manufacturing | 9,774 | 11,456 | 12,118 | 26,406 |
| Energy and Utilities | 12,587 | 14,608 | 6,571 | 12,569 |
| Transportation | 11,935 | 13,716 | 5,183 | 10,485 |
| Government and Public Safety | 13,374 | 15,830 | 3,790 | 6,851 |
| All end uses | 15,909 | 18,556 | 67,166 | 143,638 |
Military prices rise fastest, at about 2.4% a year, because accelerators, encryption and domestic manufacturing add content to each unit. Telecom prices rise slowest, at under 1% a year, because operators buy outdoor servers in volume against fixed per-site budgets.
Standards and Regulation: Which Rules Shape Rugged Servers?
Four families of standards decide where a rugged server may be deployed: military environmental and electromagnetic standards, NEBS telecom requirements, ingress protection ratings and security certifications.
MIL-STD-810H. MIL-STD-810 is the US military environmental test standard. Change 1 of revision H, released in May 2022, includes a complete rewrite of Method 509 for salt fog and corrosive environments. HPE’s rugged ProLiant edge systems adhere to MIL-STD-810H.
MIL-STD-461. MIL-STD-461 is the US military electromagnetic compatibility standard, and revision G addresses electromagnetic interference protection. Curtiss-Wright’s PacStar 810 is designed to MIL-STD-810 and MIL-STD-461, and HPE’s systems adhere to MIL-STD-461G.
NEBS. GR-63-CORE covers physical protection, including temperature and humidity ranges, fire resistance and spread, and vibration and earthquake survivability; GR-1089-CORE covers electromagnetic compatibility, electrostatic discharge, and power and grounding safety. HPE’s rugged systems adhere to NEBS Level 3, which covers seismic events, thermal performance and fire resistance for remote deployments. Outdoor telecom servers also follow enclosure requirements such as GR-487-CORE and GR-3108-CORE, which Supermicro cites for its outdoor edge systems.
IEC 60529. The IEC 60529 standard of the International Electrotechnical Commission (IEC) defines the IP Code for degrees of protection provided by enclosures for electrical equipment rated up to 72.5 kV. Outdoor servers are sold by IP rating, such as IP65 for Supermicro’s outdoor edge systems and IP66 for Dell’s PowerEdge XR9700.
Security certification. Federal Information Processing Standard (FIPS) 140-2 validated self-encrypting drives and export-control status under ITAR are common requirements in defense tenders, as the Trenton Systems and Kontron examples above show.
Market Segmentation: Which Segment Leads the Rugged Server Market?
Military and defense lead the Rugged Server Market with 55.3% of 2025 value, rack-mount servers lead form factors with 41.6%, and fully rugged MIL-STD servers lead ruggedization levels with 55.4%. GPU-accelerated servers are the fastest-growing segment at 16.11% a year, against 10.78% for FPGA and other accelerated servers and 4.90% for CPU-only servers, because AI inference is moving to the point where sensor data is collected.
By End Use: Military and Defense Lead with 55.3%
| End use | 2025 (USD billion) | Share 2025 | 2035 (USD billion) | CAGR 2025-2035 |
|---|---|---|---|---|
| Military and Defense | 0.59 | 55.3% | 1.45 | 9.36% |
| Telecommunications | 0.16 | 15.3% | 0.48 | 11.36% |
| Industrial and Manufacturing | 0.12 | 11.1% | 0.30 | 9.83% |
| Energy and Utilities | 0.08 | 7.7% | 0.18 | 8.30% |
| Transportation | 0.06 | 5.8% | 0.14 | 8.80% |
| Government and Public Safety | 0.05 | 4.7% | 0.11 | 7.90% |
Telecommunications gains 2.7 points of share by 2035 as cloud RAN moves compute to cell sites. Energy and utilities, transportation and government and public safety each lose share while growing in value.
By Form Factor: Rack-Mount Servers Lead with 41.6%
| Form factor | 2025 (USD billion) | Share 2025 | 2035 (USD billion) | CAGR 2025-2035 |
|---|---|---|---|---|
| Rackmount Servers (1U-4U) | 0.44 | 41.6% | 0.93 | 7.65% |
| Short-Depth Edge Servers | 0.26 | 24.3% | 0.74 | 10.99% |
| Small Form Factor and Box Servers | 0.24 | 22.8% | 0.59 | 9.21% |
| Outdoor Enclosed Servers | 0.12 | 11.3% | 0.41 | 13.05% |
Rack-mount servers of 1U to 4U remain the standard for shipboard and shelter-based systems, but lose 6.7 points of share to short-depth and outdoor designs.
By Ruggedization Level: Fully Rugged MIL-STD Servers Lead with 55.4%
Fully rugged MIL-STD servers are worth USD 591.98 million (55.4%) in 2025 and USD 1.39 billion in 2035, growing at 8.93% a year. Telecom-grade NEBS servers are worth USD 231.88 million (21.7%) and grow fastest at 10.95% a year to USD 655.15 million. Semi-rugged and industrial servers are worth USD 244.70 million (22.9%) and grow at 9.71% a year to USD 618.10 million.
By Compute Configuration: GPU-Accelerated Servers Grow Fastest at 16.11%
| Compute configuration | 2025 (USD billion) | Share 2025 | 2035 (USD billion) | CAGR 2025-2035 |
|---|---|---|---|---|
| CPU-Only Servers | 0.68 | 63.8% | 1.10 | 4.90% |
| GPU-Accelerated Servers | 0.29 | 27.4% | 1.30 | 16.11% |
| FPGA and Other Accelerated Servers | 0.09 | 8.8% | 0.26 | 10.78% |
GPU-accelerated servers overtake CPU-only servers in value by 2035, reaching USD 1.30 billion against USD 1.10 billion. Field-programmable gate array (FPGA) servers keep a steady niche in signal intelligence and electronic warfare, where fixed-function processing at low power matters more than general AI throughput.

DC Exclusive: The Rugged Server Units-and-Price Model and End-Use × Form-Factor Matrix
At USD 315.91 million in 2025, military rack-mount servers are the single largest cell of the matrix and 29.6% of all rugged server spending. The matrix cross-tabulates who buys rugged servers against what shape they buy.
| 2025, USD billion | Rackmount | Short-Depth | Small Form Factor | Outdoor Enclosed | Total |
|---|---|---|---|---|---|
| Military and Defense | 0.32 | 0.09 | 0.17 | 0.01 | 0.59 |
| Telecommunications | 0.03 | 0.06 | 0.01 | 0.07 | 0.16 |
| Industrial and Manufacturing | 0.03 | 0.05 | 0.03 | 0.01 | 0.12 |
| Energy and Utilities | 0.02 | 0.03 | 0.01 | 0.02 | 0.08 |
| Transportation | 0.02 | 0.02 | 0.02 | 0.00 | 0.06 |
| Government and Public Safety | 0.02 | 0.01 | 0.01 | 0.01 | 0.05 |
| Total | 0.44 | 0.26 | 0.24 | 0.12 | 1.07 |
Military buyers spend 53.4% of their budget on rack-mount servers and 29.1% on small form factor and box servers, while telecom operators spend 42.5% on outdoor enclosed servers and 36.5% on short-depth servers. Industrial buyers favor short-depth servers at 39.4%. A supplier strong only in full-depth rack-mount servers is therefore tied to the military budget cycle, while outdoor and short-depth designs open the two fastest-growing end uses. Figures in the matrix are rounded to two decimals; row and column totals use unrounded values.
The matrix is a DC Market Insights model, not a shipment count. It is built from 90 inputs: 36 cohort parameters (2020 units, 2020 unit price and four growth rates for each of 6 end uses), 24 end-use × form-factor weights, 20 segment shares and 10 regional shares. Multiplying units by price for each end use and year gives the market; the matrix weights are then balanced so that every row matches its end-use total and every column matches its form-factor total. The model and its assumptions are explained on our research methodology page.
Regional Insights: Which Region Leads the Rugged Server Market?
North America leads the Rugged Server Market with 44.2% of 2025 value, and Asia Pacific is the fastest-growing region at 10.46% a year, led in the DC Market Insights model by India, South Korea and Australia.
North America Leads with 44.2% Share
North America is worth USD 472.30 million in 2025 and USD 1.08 billion by 2035, a CAGR of 8.65%. US demand is anchored by a fiscal 2026 Department of Defense budget request of USD 961.60 billion, and Mercury Systems, a US defense specialist, reports a growing backlog. North America loses 3.6 points of share by 2035 as allied spending catches up, not because its volume slows.
Europe Holds 23.8% Share
Europe is worth USD 254.32 million in 2025 and USD 668.47 million by 2035, a CAGR of 10.15%. The NATO spending commitment drives defense demand in the United Kingdom, Germany and France, the three largest European country markets in DC Market Insights estimates.
Asia Pacific Holds 22.1% Share and Grows Fastest
Asia Pacific is worth USD 236.15 million in 2025 and USD 638.89 million by 2035, a CAGR of 10.46%. China is the largest country market in the region in DC Market Insights estimates, while India grows fastest among all 12 large country markets at 13.66% a year.
Middle East and Africa Holds 6.2% Share
The Middle East and Africa is worth USD 66.25 million in 2025 and USD 170.85 million by 2035, a CAGR of 9.94%. Israel and Saudi Arabia account for about half of regional demand in DC Market Insights estimates, from defense programs and from oil, gas and utility operators that run servers at remote sites.
Latin America Holds 3.7% Share
Latin America is worth USD 39.54 million in 2025 and USD 104.22 million by 2035, a CAGR of 10.18%, led in DC Market Insights estimates by mining, energy and telecom edge deployments.
Country Analysis: Which Countries Buy the Most Rugged Servers?
The United States is the largest country market for rugged servers at USD 430.74 million in 2025, 40.3% of global value, followed by China at USD 61.87 million (5.8%) and the United Kingdom at USD 54.42 million (5.1%). The 12 largest countries account for 77.6% of 2025 spending.
| Rank | Country | Region | 2025 (USD billion) | Share 2025 | 2035 (USD billion) | CAGR 2025-2035 |
|---|---|---|---|---|---|---|
| 1 | United States | North America | 0.43 | 40.3% | 0.98 | 8.57% |
| 2 | China | Asia Pacific | 0.06 | 5.8% | 0.16 | 9.64% |
| 3 | United Kingdom | Europe | 0.05 | 5.1% | 0.13 | 9.29% |
| 4 | Germany | Europe | 0.05 | 4.4% | 0.14 | 11.33% |
| 5 | Canada | North America | 0.04 | 3.9% | 0.10 | 9.49% |
| 6 | France | Europe | 0.04 | 3.8% | 0.10 | 9.72% |
| 7 | Japan | Asia Pacific | 0.04 | 3.7% | 0.10 | 9.43% |
| 8 | South Korea | Asia Pacific | 0.03 | 2.7% | 0.08 | 11.07% |
| 9 | India | Asia Pacific | 0.03 | 2.5% | 0.10 | 13.66% |
| 10 | Australia | Asia Pacific | 0.03 | 2.4% | 0.07 | 10.87% |
| 11 | Israel | Middle East and Africa | 0.02 | 1.7% | 0.04 | 8.77% |
| 12 | Saudi Arabia | Middle East and Africa | 0.01 | 1.4% | 0.05 | 11.83% |
India is the fastest-growing country market at 13.66% a year, ahead of Saudi Arabia at 11.83% and Germany at 11.33%. The country figures are a DC Market Insights allocation of the regional totals, weighted by each country’s estimated share of defense equipment spending and telecom and industrial edge deployments.
Forecast Scenarios: How Could the 2035 Forecast Change?
The Rugged Server Market reaches USD 2.67 billion by 2035 in the base case, with a range of USD 2.17 billion to USD 3.18 billion across the low and high scenarios.
| Scenario | Assumption from 2026 | 2035 (USD billion) | CAGR 2025-2035 |
|---|---|---|---|
| Low | Unit growth 2.2 points a year below base in every end use | 2.17 | 7.33% |
| Base | Shipments rise to about 143,600 units; GPU share of value reaches 48.9% | 2.67 | 9.57% |
| High | Unit growth 1.9 points a year above base in every end use | 3.18 | 11.51% |
The low case reflects allied defense budgets that fall short of the 2035 targets and slower cloud RAN rollouts. The high case assumes allies meet the NATO commitment on schedule and cloud RAN reaches more cell sites than in the base case. Unit prices are held at the base path in both cases, so the range reflects volume risk only.
Competitive Insights: Who Leads the Rugged Server Market?
- Dell Technologies
- Hewlett Packard Enterprise (HPE)
- Lenovo
- Supermicro
- Mercury Systems
- Curtiss-Wright
- Kontron
- Crystal Group
- Trenton Systems
- General Micro Systems
- Systel
- Advantech
DC Market Insights estimates that the five largest suppliers hold about 38% of the Rugged Server Market in 2025, so the market remains fragmented between general server makers and defense specialists. The estimate sets the USD 1.07 billion market against the scale of the specialists’ disclosed businesses: Mercury Systems reported fiscal 2025 net sales of USD 912.00 million (Source: Mercury Systems annual report filed with the US Securities and Exchange Commission) and USD 984.00 million in fiscal 2026, and Curtiss-Wright reported Defense Electronics sales of USD 1.02 billion in 2025, up 12%, with 2026 guidance of 4% to 6% growth for the segment. Both businesses cover far more than servers, so rugged servers are a minority of each. Mercury states that its additions of Themis and Germane gave it a significant footprint in the rugged server business. Dell, HPE, Lenovo and Supermicro compete with ruggedized versions of their mainstream platforms aimed at telecom, industrial and defense edge sites, while Mercury, Curtiss-Wright, Crystal Group, Trenton Systems, General Micro Systems and Systel compete on fully rugged defense servers. Kontron, with 2025 revenue of EUR 1.61 billion, supplies rugged systems such as the µDARC microserver, and Advantech supplies industrial and telecom servers.
Recent Developments
- In February 2026, Dell introduced the PowerEdge XR9700, an IP66-rated outdoor server with closed-loop liquid cooling that operates from -40°C to 46°C and supports up to 15 5G sectors for cloud RAN and edge AI (Source: The Mobile Network news report).
- In April 2026, HPE expanded its rugged ProLiant edge portfolio with the EL2000 chassis, EL220 and EL240 Gen12 servers and the DL145 Gen11, rated from -40°C to 55°C with optional NVIDIA RTX PRO Blackwell GPUs (Source: HPE announcement).
- In May 2026, Mercury Systems received a multi-year order from distributor Blue Raven for 1,000 RTBX06 BuiltSECURE rugged servers, its largest production order for its Common Processing Architecture servers (Source: Mercury Systems press release).
- In September 2026, Curtiss-Wright introduced the PacStar 810 rugged edge server with a 64-core AMD EPYC processor, up to 1 TB of DDR5 memory and a GPU with 96 GB of GDDR7 memory (Source: Military & Aerospace Electronics product report).
- In May 2025, Kontron launched the µDARC ruggedized microserver, an IP67 sealed Arm-based system that draws less than 5 W and weighs 735 g (Source: Kontron press release).
- In February 2025, Crystal Group integrated Intel Xeon 6 processors with up to 144 cores into its rugged computing portfolio (Source: Crystal Group press release).
We follow these launches, contracts and defense budget decisions as they happen in our data center industry updates.
Methodology: How We Built the Rugged Server Market Model
DC Market Insights built this market bottom-up from 6 end-use cohorts over 16 years (2020 to 2035), each with its own unit shipments and average price per unit, giving 96 unit-and-price pairs. Unit growth for 2020 to 2025 ranges from 4.1% a year in government and public safety to 12.4% in telecommunications, and unit growth for 2025 to 2035 ranges from 6.1% to 10.4% a year. Prices drift upward between 0.4% and 2.4% a year as accelerators and security features are added. The total was split by 4 form factors, 3 ruggedization levels, 3 compute configurations and 5 regions, and every split sums to the market total. Country values allocate each regional total by country weights. The result was checked top-down against the disclosed revenue of 2 listed defense computing suppliers, Mercury Systems and Curtiss-Wright, and against product launches by 6 general server makers and specialists in the last 24 months. The low and high scenarios shift unit growth in every end use while holding prices at the base path. The analyst named on this page built the model, and the reviewer checked the arithmetic, the sources and the dates before publication.
Table of contents
- 01Introduction
- 1.1Market Definition and Scope
- 1.2Inclusions and Exclusions
- 1.3Currency, Base Year and Forecast Period
- 02Research Methodology
- 2.1Units-and-Price Model Design
- 2.2Data Sources and Fact Verification
- 2.3Top-Down Cross-Checks
- 2.4Assumptions and Limitations
- 03Executive Summary
- 3.1Market Size, 2020-2035
- 3.2Key Findings
- 04Market Dynamics
- 4.1Drivers
- 4.2Trends
- 4.3Challenges
- 4.4Opportunities
- 05Pricing Analysis
- 5.1Average Price per Unit by End Use, 2025 and 2035
- 5.2Unit Shipments by End Use, 2025 and 2035
- 06Standards and Regulation
- 6.1MIL-STD-810H and MIL-STD-461
- 6.2NEBS GR-63-CORE and GR-1089-CORE
- 6.3IEC 60529 Ingress Protection
- 6.4Security Certification and Export Controls
- 07Supply Chain Analysis
- 7.1Processors and Accelerators
- 7.2Enclosures, Cooling and Power
- 7.3Integrators and Distributors
- 08Market Size and Forecast
- 8.1Market Value, 2020-2035
- 8.2Unit Shipments, 2020, 2025, 2030 and 2035
- 09Market by End Use
- 9.1Military and Defense
- 9.2Telecommunications
- 9.3Industrial and Manufacturing
- 9.4Energy and Utilities
- 9.5Transportation
- 9.6Government and Public Safety
- 10Market by Form Factor
- 10.1Rackmount Servers (1U-4U)
- 10.2Short-Depth Edge Servers
- 10.3Small Form Factor and Box Servers
- 10.4Outdoor Enclosed Servers
- 11Market by Ruggedization Level
- 11.1Fully Rugged (MIL-STD)
- 11.2Telecom-Grade (NEBS)
- 11.3Semi-Rugged and Industrial
- 12Market by Compute Configuration
- 12.1CPU-Only Servers
- 12.2GPU-Accelerated Servers
- 12.3FPGA and Other Accelerated Servers
- 13DC Exclusive: End-Use × Form-Factor Matrix
- 13.1Matrix Values, 2025
- 13.2Model Inputs
- 14Market by Region
- 14.1North America (United States, Canada)
- 14.2Europe (United Kingdom, Germany, France, Rest of Europe)
- 14.3Asia Pacific (China, Japan, South Korea, India, Australia, Rest of Asia Pacific)
- 14.4Latin America
- 14.5Middle East and Africa (Israel, Saudi Arabia, Rest of Middle East and Africa)
- 15Country Analysis
- 15.1Top 12 Countries, 2025 and 2035
- 15.2Fastest-Growing Countries
- 16Regional Cross-Sections
- 16.1Region Shares, 2025 and 2035
- 16.2Region Growth Rates, 2025-2035
- 17Forecast Scenarios
- 17.1Low, Base and High Cases, 2035
- 17.2Swing Factors
- 18Competitive Landscape
- 18.1Market Concentration, 2025
- 18.2General Server Makers and Defense Specialists
- 18.3Recent Developments
- 19Company Profiles
- 19.1Dell Technologies
- 19.2Hewlett Packard Enterprise (HPE)
- 19.3Lenovo
- 19.4Supermicro
- 19.5Mercury Systems
- 19.6Curtiss-Wright
- 19.7Kontron
- 19.8Crystal Group
- 19.9Trenton Systems
- 19.10General Micro Systems
- 19.11Systel
- 19.12Advantech
- 20Analyst Recommendations
- 20.1For Suppliers
- 20.2For Defense and Telecom Buyers
- 20.3For Investors
- Fig. 1Rugged Server Market Size, 2020-2035
- Fig. 2Rugged Server Market by Region, 2025 and 2035
- Fig. 3Rugged Server Market by Compute Configuration, 2025 and 2035
- Fig. 4End-Use × Form-Factor Matrix, 2025
- Fig. 5Forecast Scenarios, 2035
- Table 1Report Attributes
- Table 2Average Price per Unit and Units by End Use, 2025 and 2035
- Table 3Market by End Use, 2025 and 2035
- Table 4Market by Form Factor, 2025 and 2035
- Table 5Market by Ruggedization Level, 2025 and 2035
- Table 6Market by Compute Configuration, 2025 and 2035
- Table 7End-Use × Form-Factor Matrix, 2025
- Table 8Market by Region, 2025 and 2035
- Table 9Top 12 Countries, 2025 and 2035
- Table 10Forecast Scenarios, 2035
About this report
Written by Amit Jain and reviewed by Deepti Agrawal, Senior Editor, Research. Figures are built top-down and bottom-up and reconciled before publication, with 2025 as the base year.
Read our methodologyHow we built this
- Historical period2020-2024
- Base year2025
- Forecast period2026-2035
- Sizing approachTop-down + bottom-up
Need more than the report?
Advisory on this market
Due diligence, site selection and market entry work, by the analysts who wrote this report.
See consulting servicesFrequently asked questions
USD 1.07 billion in 2025, rising to USD 2.67 billion by 2035. DC Market Insights estimates the market at USD 742.61 million in 2020.
9.57% a year from 2025 to 2035, faster than the 7.55% a year recorded between 2020 and 2025, as defense budgets rise and AI inference moves to the edge.
Military and defense, with USD 591.27 million or 55.3% of the market in 2025. Telecommunications is the fastest-growing end use at 11.36% a year.
USD 15,909 on average in 2025, from USD 9,774 for an industrial edge server to USD 23,848 for a fully rugged military server, according to DC Market Insights estimates.
GPU-accelerated servers, at 16.11% a year from USD 292.79 million in 2025 to USD 1.30 billion by 2035, as AI inference moves into vehicles, command posts and cell sites.
North America, with USD 472.30 million or 44.2% of 2025 value. Asia Pacific grows fastest at 10.46% a year.
The five largest suppliers hold about 38% of the market (DC Market Insights estimate). Dell Technologies, HPE, Lenovo, Supermicro, Mercury Systems, Curtiss-Wright, Kontron, Crystal Group, Trenton Systems, General Micro Systems, Systel and Advantech compete.
USD 430.74 million in the United States, or 40.3% of 2025 spending, followed by China at USD 61.87 million. India grows fastest at 13.66% a year (DC Market Insights estimate).
Licences, delivery and payment
Which licence should I choose?
Single User is a view-only PDF for one person. Multi User adds a printable PDF and the Excel data for unlimited users at one location. Enterprise covers your whole company and includes 100 free analyst hours.
How and when will I receive the report?
By email, within 24–48 business hours of payment, in the formats of your licence.
How can I pay?
Securely through PayPal: with a PayPal account, a debit or credit card, or PayPal Pay Later where available. Prices are in US dollars.
Can I see a sample first?
Yes. Request a free sample and we will email it to you.
Can the report be tailored to my needs?
Yes. We can add countries, segments or data cuts. Talk to an analyst about the scope you need.
Can I get an invoice or pay against a purchase order?
Write to sales@dcmarketinsights.com and our team will help.