
Data Center Busway Market Size, Share & Forecast to 2035
Market at a glance
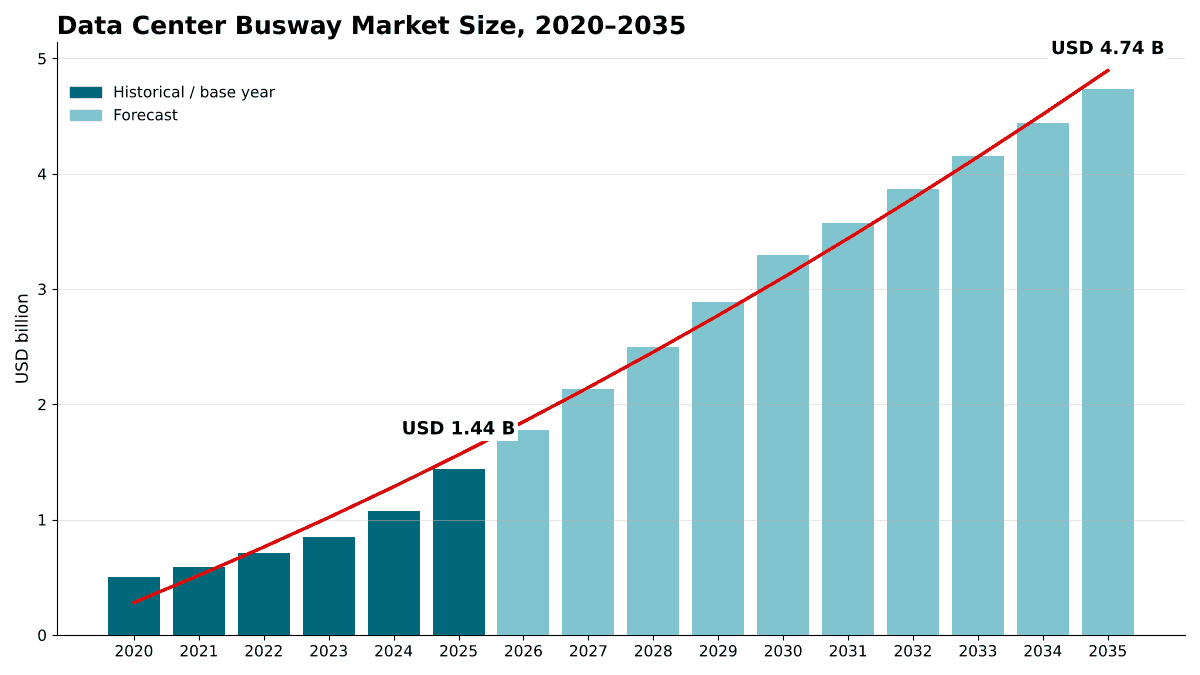
The Data Center Busway market was worth USD 1,440.0 million in 2025 and is forecast to reach USD 4,740.0 million by 2035, growing at a 12.65% CAGR. North America accounts for 44.8% of the market.
 By Satyabrat Rajawat, Senior Research Analyst, Strategic Advisory
 Reviewed by Deepti Agrawal
Last updated 10 Oct 2026
Base year 2025 PDF + Excel
Reviewed by Deepti Agrawal
Last updated 10 Oct 2026
Base year 2025 PDF + Excel
Source: DC Market Insights analysis
Key findings
Busway Content Reaches USD 0.105 Million per New MW as Completions Double
Compact Track Designs Save White Space
Long Buying Timelines for High-Ampacity Busway
GPU and Neocloud Operators Grow Busway Spend to USD 772.33 million
What is inside the report
- 01Introduction
- 02Research Methodology
- 03Executive Summary
- 04Market Dynamics
- 05Pricing and Cost Analysis
- 06Standards and Regulation
- 07Supply Chain and Value Chain Analysis
- 08Global Data Center Busway Market Size and Forecast
- 09Market by Product Type
- 10Market by Current Rating
- 21chapters
- 2020-2024Historical period
- 2026-2035Forecast period
- 10Companies profiled
Regional insights
- North America44.8%
- Asia Pacific27.1%
- Europe18.3%
- Latin America5.1%
- Middle East and Africa4.7%
Segmentation
Companies profiled
- Schneider Electric
- Siemens
- Legrand
- Vertiv
- Eaton
- ABB
- LS Cable & System
- EAE Group
- CHINT
- USA TrackBusway
Recent developments
Schneider Electric unveiled I-Line Track, a medium power distribution busway for data centers with hot-pluggable tap-off units that it says is 60% more compact than mainstream products (Source: Schneider Electric press release).
Legrand announced the acquisition of Linkk Busway Systems, a Malaysian power busbar specialist for data center grey space with annual revenue of around EUR 45 million and more than 240 employees (Source: Legrand press release).
LS Cable & System USA opened a logistics hub at Port Crossing Commerce Center in La Porte, Texas, near Houston, to support its busduct business (Source: LS Cable & System USA announcement).
Vertiv introduced a double-stack configuration of its PowerBar Track busway, rated up to 2000A under UL 857 and up to 2500A under IEC 61439-6, in copper and aluminum (Source: Vertiv press release).
Siemens announced more than USD 165 million to expand US manufacturing, with more than 350 new jobs, and named busway systems among the products that route power within large data center campuses (Source: Siemens press release).
USA TrackBusway made its 225A-per-phase track busway available for purchase, with 450A splitters that divide a run into two 225A-per-phase sections (Source: USA TrackBusway announcement).
Full analysis
The Data Center Busway Market covers the prefabricated busbar trunking systems (busways) that carry low-voltage power inside data center buildings: feeder busway in the grey space between switchgear, uninterruptible power supply (UPS) systems and distribution boards, and plug-in and track busway over the white space, together with tap-off units, fittings and monitoring modules. DC Market Insights values the global Data Center Busway Market at USD 1.44 billion in 2025 and forecasts USD 4.74 billion by 2035, a CAGR of 12.65%. The 2025 value is built from the build itself: about 12.0 GW of new IT capacity, of which 48% uses overhead busway in the white space at about USD 0.110 million per MW (USD 633.60 million) and 55% uses feeder busway in the grey space at about USD 0.095 million per MW (USD 627.00 million), while retrofit and expansion work on an installed base of about 112.2 GW adds USD 179.57 million. Track busway is the fastest-growing segment at 16.15% a year because AI rows change rack power faster than whip-and-PDU layouts can be rewired, and the Middle East and Africa is the fastest-growing region at 15.43% a year as campus-scale capacity is added from a small base.
Executive Summary
The Global Data Center Busway Market size was valued at USD 499.50 million in 2020, reached USD 1.44 billion in 2025, and is anticipated to reach USD 4.74 billion by 2035, at a CAGR of 12.65% during the forecast period.
| Report attribute | Details |
|---|---|
| Historical Period | 2020-2024 |
| Base Year | 2025 |
| Forecast Period | 2026-2035 |
| Data Center Busway Market Size 2025 | USD 1.44 Billion |
| Data Center Busway Market, CAGR | 12.65% |
| Data Center Busway Market Size 2035 | USD 4.74 Billion |
DC Market Insights estimates that the market grew at 23.59% a year between 2020 and 2025, and that 2025 alone added 34.1% over 2024, when spending stood at USD 1.07 billion. Two forces did most of the work: annual capacity completions doubled from 6.0 GW in 2020 to 12.0 GW in 2025 in the DC Market Insights capacity model, and the share of new halls designed around overhead busway rose from 30% to 48%. Growth slows to 12.65% a year from 2025 to 2035 as adoption nears saturation in hyperscale halls, and the market passes USD 3.29 billion in 2030.
Busway is a small line in a data center budget but a decisive one for speed. Cushman & Wakefield puts average greenfield development costs at USD 17.6 million per MW for the most modern facilities, up 21% per MW since its previous guide; DC Market Insights estimates blended busway content at about USD 0.105 million per new MW in 2025, well under 1% of that figure, yet the busway decides how fast a hall can be energized and how cheaply its rows can be re-powered.
Market Scope: What Does the Data Center Busway Market Cover?
DC Market Insights sizes the Data Center Busway Market at USD 1.44 billion in 2025. The market covers enclosed busbar trunking systems rated up to 1,000 V alternating current (AC) or 1,500 V direct current (DC) that distribute power inside data center buildings, valued at first sale in current US dollars, with 2025 as the base year and forecasts to 2035.
Included. Feeder busway that links transformers, low-voltage switchgear, UPS systems and power distribution boards in the grey space; plug-in busway with fixed outlets along the run; track busway with continuous slots for hot-pluggable tap-off units above rack rows; copper and aluminum conductor variants; tap-off and plug-in units; elbows, tees, end feeds, hangers and other fittings; and branch-circuit monitoring and metering modules sold with the busway.
Excluded. Medium-voltage busduct on the utility side, rack power distribution units (PDUs) mounted inside the cabinet, switchgear, UPS systems and transformers themselves, power cables and whips, and installation labor.
How the segments fit together. Product type, current rating, conductor, component, deployment and end-user each re-cut the same USD 1.44 billion. Feeder busway maps to grey-space spending, while plug-in and track busway map to white-space spending; retrofit spending is shared between them.
Market Drivers: What Drives the Data Center Busway Market?
Completions rising from 12.0 GW to 27.0 GW a year drive most of the growth. Three drivers explain the Data Center Busway Market: the build pipeline, the shift of white-space power from cable whips to overhead track, and higher rack currents that push buyers toward higher-ampere busway.
Busway Content Reaches USD 0.105 Million per New MW as Completions Double
New construction accounts for 87.5% of 2025 spending, so the market follows the build pipeline. BloombergNEF counted more than 23 GW of data center capacity under construction worldwide at the end of September 2025, with about three quarters of it in the United States, and more than 3.8 GW of new IT capacity entered construction in the third quarter of 2025 alone. DC Market Insights models annual completions rising from 12.0 GW in 2025 to 22.0 GW in 2030 and 27.0 GW in 2035, which lifts new-build busway spending from USD 1.26 billion to USD 4.20 billion.
Overhead Busway Forecast in 70% of New White Space by 2035
Overhead track lets an operator add or move a rack by clicking in a tap-off unit instead of pulling a new cable from a floor PDU. Expert panel commentary published by Legrand puts the saving at 15–30% against PDUs and whips once installation, labor and future modifications are counted. DC Market Insights estimates that 48% of new white space used overhead busway in 2025, up from 30% in 2020, and forecasts 62% in 2030 and 70% in 2035. Track busway grows from USD 380.83 million to USD 1.70 billion over the forecast period.
Ratings Above 2,500 A Grow Fastest at 16.39%
DC Market Insights expects AI rows to draw more current per run, and supplier launches point the same way: Legrand’s 2025 launches included 6,000A busway distribution systems, and Vertiv’s PowerBar Track double-stack configuration reaches 2,500A under IEC 61439-6. Busway rated above 2,500 A is worth USD 286.59 million in 2025 and is the fastest-growing rating class at 16.39% a year, reaching 27.6% of the market by 2035. Supply decisions for those halls follow the wider electrical chain covered in the Data Center Power Market report.
Market Trends: How Is Data Center Busway Changing?
The Data Center Busway Market is moving toward compact track designs, aluminum conductors and built-in metering, with monitoring and metering the fastest-growing component at 18.89% a year.
Compact Track Designs Save White Space
Suppliers now compete on footprint. Schneider Electric’s I-Line Track medium power distribution busway uses an open track design with self-locking, hot-pluggable tap-off units and is 60% more compact than mainstream market products, according to the company. Vertiv positions its double-stack PowerBar Track as a way to preserve white space for AI demand. Smaller runs leave more ceiling room for cooling pipework and cable trays.
Monitoring and Metering Grows to 10.8% of Spend
Operators want branch-level energy data, so metering moves into the tap-off unit. Schneider’s I-Line Track uploads monitoring data in real time to dashboards in the cloud or at the edge. DC Market Insights values monitoring and metering modules at USD 90.73 million (6.3%) in 2025 and USD 511.73 million by 2035.
Aluminum Gains Share Against Copper
Suppliers increasingly offer both conductor types; Vertiv’s double-stack track ships in copper and aluminum variants. Copper still dominates at USD 983.64 million (68.3%) in 2025, but DC Market Insights forecasts aluminum to grow at 14.95% a year against 11.42% for copper, reaching 38.8% of value by 2035.
Market Challenges: What Holds the Data Center Busway Market Back?
Lead times and plenum rules cap growth of the Data Center Busway Market at 12.65% a year. DC Market Insights expects these two constraints to explain why the forecast growth rate of 12.65% sits well below the 23.59% of 2020 to 2025.
Long Buying Timelines for High-Ampacity Busway
USA TrackBusway, which made its 225A-per-phase track busway available in June 2026, said that as data centers demand more high-ampacity busway, many data center, industrial and commercial teams face longer buying timelines for overhead power systems. Cushman & Wakefield also cites critical equipment lead times as one cause of the 21% rise in development costs per MW. LS Cable & System USA opened a logistics hub in La Porte, Texas, in part to shorten busduct lead times.
Plenum and Access Rules Limit Where Busway Can Run
In North America, Article 368 of NFPA 70, the National Electrical Code (NEC) published by the National Fire Protection Association (NFPA), governs busway installation; as Schneider Electric summarizes it, section 368.10(B) permits busways behind access panels provided the busways are totally enclosed and of non-ventilating construction and the joints stay accessible for maintenance. Schneider Electric recommends against installing busway in any plenum that carries environmental air, because a failure would release smoke and gases into the air-handling system. Halls with ceiling return plenums need design changes before busway can replace cable.
Market Opportunities: Where Are the New Revenue Pools?
Graphics processing unit (GPU) and neocloud operators are the fastest-growing revenue pool at 17.82% a year. The second new pool is retrofit work on an installed base that DC Market Insights expects to grow from 112.2 GW to 299.9 GW by 2035.
GPU and Neocloud Operators Grow Busway Spend to USD 772.33 million
Specialist GPU cloud operators spent USD 149.78 million on busway in 2025, and DC Market Insights expects their spend to reach USD 772.33 million in 2035, more than five times the 2025 level. They fit out leased shells at speed and re-rack often, which suits track systems that take new tap-off units without an outage. Siemens’ LData busbar trunking system, rated from 1000 A to 2500 A, is marketed for data centers that need continuous availability and allows retrofits without interrupting operations.
Retrofit and Expansion Reaches USD 539.75 million by 2035
DC Market Insights expects older halls built with floor PDUs and whips to be re-powered for higher-density racks. DC Market Insights models retrofit and expansion spending at about USD 1,600 per installed MW in 2025, or USD 179.57 million, rising to USD 539.75 million in 2035. Retrofit buyers favor plug-in and track busway that can be hung over live rows, and the work often comes bundled with the rack-level power covered in our Data Center High-Voltage Direct Current (HVDC) Market report.
Pricing: How Much Do Data Centers Spend on Busway per MW?
A new hall that uses overhead busway in the white space spends about USD 0.110 million per MW of IT load on white-space busway in 2025, and a hall with feeder busway in the grey space spends about USD 0.095 million per MW on it. These are DC Market Insights estimates covering busway sections, tap-off units, fittings and monitoring, excluding labor.
| Busway spend and adoption | 2020 | 2025 | 2030 | 2035 |
|---|---|---|---|---|
| White-space busway (USD million per MW) | 0.100 | 0.110 | 0.118 | 0.125 |
| Grey-space feeder busway (USD million per MW) | 0.085 | 0.095 | 0.098 | 0.100 |
| Share of new white space with busway | 30% | 48% | 62% | 70% |
| Share of new grey space with feeder busway | 45% | 55% | 63% | 68% |
| Retrofit spend per installed MW (USD) | 1,200 | 1,600 | 1,700 | 1,800 |
Spend per MW rises slowly in both lines, by about 1% a year, because higher rack currents call for higher-rated and double-stacked runs, while competition among suppliers and the shift to aluminum hold down the price per ampere.
Standards and Regulation: Which Rules Shape Data Center Busway?
Three sets of rules decide which busway a data center may install. They are the International Electrotechnical Commission (IEC) 61439-6 product standard, the Underwriters Laboratories (UL) 857 and CSA C22.2 No. 27 product standards in North America, and the installation rules of NFPA 70.
IEC 61439-6:2012. IEC 61439-6, Low-voltage switchgear and controlgear assemblies, Part 6: Busbar trunking systems (busways) applies to busbar trunking systems whose rated voltage does not exceed 1,000 V AC or 1,500 V DC. Legrand tests and manufactures its Zucchini high-power busbar range, rated 630 to 6,300 amps, to IEC 61439-1 and 6.
UL 857. UL 857 is the UL safety standard for busways, with CSA C22.2 No. 27 as the Canadian counterpart. Vertiv rates its double-stack track at up to 2000A under UL 857, and LS Cable & System’s Data-way busway had earned UL 857 and UL 891 certification by June 2026.
NFPA 70 Article 368. The NEC article on busways sets where they may be installed, including the conditions for runs behind access panels.
Ratings differ by standard: Vertiv’s double-stack track is rated up to 2000A under UL 857 and up to 2500A under IEC 61439-6.
Market Segmentation: Which Segment Leads the Data Center Busway Market?
Feeder busway leads the Data Center Busway Market with USD 707.81 million, or 49.1% of 2025 value. Hyperscale data centers lead buyers with USD 629.35 million (43.7%), and copper conductors hold 68.3%. Among product types, track busway is the fastest-growing segment at 16.15% a year, against 11.38% for feeder and 10.54% for plug-in busway, because new AI and colocation rows are designed around hot-pluggable tap-off units.
By Product Type: Feeder Busway Leads with 49.1%
| Product type | 2025 (USD billion) | Share 2025 | 2035 (USD billion) | CAGR 2025-2035 |
|---|---|---|---|---|
| Feeder Busway | 0.71 | 49.1% | 2.08 | 11.38% |
| Track Busway | 0.38 | 26.4% | 1.70 | 16.15% |
| Plug-in Busway | 0.35 | 24.4% | 0.96 | 10.54% |
Feeder busway keeps the largest share because nearly every large hall uses it between switchgear and UPS systems, while track busway gains 9.5 points of share by 2035 as it displaces both whips and fixed-outlet plug-in runs.
By Current Rating: 801 A to 2,500 A Leads with 43.7%
| Current rating | 2025 (USD billion) | Share 2025 | 2035 (USD billion) | CAGR 2025-2035 |
|---|---|---|---|---|
| Up to 800 A | 0.52 | 36.4% | 1.38 | 10.15% |
| 801 A to 2,500 A | 0.63 | 43.7% | 2.05 | 12.54% |
| Above 2,500 A | 0.29 | 19.9% | 1.31 | 16.39% |
By Conductor: Copper Leads with 68.3%
| Conductor | 2025 (USD billion) | Share 2025 | 2035 (USD billion) | CAGR 2025-2035 |
|---|---|---|---|---|
| Copper | 0.98 | 68.3% | 2.90 | 11.42% |
| Aluminum | 0.46 | 31.7% | 1.84 | 14.95% |
By Component: Busway Sections Lead with 53.8%
| Component | 2025 (USD billion) | Share 2025 | 2035 (USD billion) | CAGR 2025-2035 |
|---|---|---|---|---|
| Busway Sections | 0.77 | 53.8% | 2.35 | 11.76% |
| Tap-off and Plug-in Units | 0.41 | 28.7% | 1.43 | 13.20% |
| Fittings and Accessories | 0.16 | 11.2% | 0.44 | 10.66% |
| Monitoring and Metering | 0.09 | 6.3% | 0.51 | 18.89% |
Tap-off and plug-in units are worth USD 413.33 million in 2025 and grow at 13.20% a year, faster than the sections they plug into, because every rack move or upgrade buys a new unit.
By Deployment: New Build Leads with 87.5%
| Deployment | 2025 (USD billion) | Share 2025 | 2035 (USD billion) | CAGR 2025-2035 |
|---|---|---|---|---|
| New Build | 1.26 | 87.5% | 4.20 | 12.79% |
| Retrofit and Expansion | 0.18 | 12.5% | 0.54 | 11.63% |
By End-user: Hyperscale Data Centers Lead with 43.7%
| End-user | 2025 (USD billion) | Share 2025 | 2035 (USD billion) | CAGR 2025-2035 |
|---|---|---|---|---|
| Hyperscale Data Centers | 0.63 | 43.7% | 2.22 | 13.42% |
| Colocation Data Centers | 0.43 | 29.6% | 1.28 | 11.66% |
| Enterprise Data Centers | 0.23 | 16.3% | 0.46 | 7.06% |
| GPU and Neocloud Providers | 0.15 | 10.4% | 0.77 | 17.82% |
Hyperscale data centers are run mainly by the large cloud service providers and grow at 13.42% a year. Enterprise data centers grow slowest at 7.06% as workloads move to cloud and colocation, and their share falls from 16.3% to 9.8%.
DC Exclusive: The Busway Spend per MW Model and Product Type × Buyer Matrix
At USD 302.31 million in 2025, hyperscale feeder busway is the single largest cell of the matrix and 21.0% of all data center busway spending. The matrix below cross-tabulates what is bought and who buys it. It is a DC Market Insights model, not a shipment count: it is built from 16 annual capacity cohorts (2020 to 2035), each priced with separate white-space and grey-space busway costs per MW, and allocated across 3 product types and 4 buyer types. In all, the model is built from 46 inputs: 16 capacity cohorts, 4 adoption and cost curves sampled at 4 benchmark years (16 points), 3 retrofit rates, 3 product-type splits, 4 buyer splits, and 4 bound checks.
| 2025, USD billion | Feeder Busway | Track Busway | Plug-in Busway | Total |
|---|---|---|---|---|
| Hyperscale Data Centers | 0.30 | 0.17 | 0.16 | 0.63 |
| Colocation Data Centers | 0.22 | 0.12 | 0.09 | 0.43 |
| Enterprise Data Centers | 0.12 | 0.04 | 0.07 | 0.23 |
| GPU and Neocloud Providers | 0.07 | 0.05 | 0.03 | 0.15 |
| Total | 0.71 | 0.38 | 0.35 | 1.44 |
GPU and neocloud providers spend 32% of their busway budget on track busway, the highest track share of any buyer, while enterprise data centers still spend 31% on fixed-outlet plug-in busway; a supplier strong only in plug-in runs is selling into the slowest-growing buyer. Hyperscale buyers put 48% of spend into feeder busway because their grey-space power rooms are the largest per site.
The model was checked against four bounds. The new-build busway spend of USD 1.26 billion equals about 0.6% of the construction value implied by 12.0 GW at USD 17.6 million per MW, inside the 0.4% to 1.0% band we accept for low-voltage distribution hardware; the market sits far below the USD 10.23 billion of 2025 net sales reported by Vertiv alone across all its critical infrastructure products; the market sits well below the EUR 2.4 billion of 2025 data center sales that Legrand reports across all its product lines; and it is many times the roughly EUR 45 million annual revenue of Linkk Busway Systems, a single regional specialist. The model and its assumptions are explained on our research methodology page.
Regional Insights: Which Region Leads the Data Center Busway Market?
North America leads the Data Center Busway Market with 44.8% of 2025 value, and the Middle East and Africa is the fastest-growing region at 15.43% a year, because DC Market Insights expects large new campuses to be added there from a small installed base.
North America Leads with 44.8% Share
North American operators spent USD 645.19 million on busway in 2025, and the region is forecast to reach USD 1.95 billion in 2035, a CAGR of 11.71%. The United States hosted 15.9 GW of the 23.1 GW of capacity under construction worldwide in BloombergNEF’s count, and supplier investment follows: Siemens is expanding US manufacturing, LS Cable & System USA added a busduct logistics hub near Houston, and USA TrackBusway sells direct from Columbus, Ohio. North America loses 3.6 points of share by 2035 as other regions build faster.
Asia Pacific Holds 27.1% Share
Asia Pacific is worth USD 390.29 million in 2025 and USD 1.43 billion by 2035, a CAGR of 13.84%, and gains the most share of any region. In the DC Market Insights allocation, China is the largest market, while India and Malaysia grow fastest. Legrand’s announced acquisition of Linkk Busway Systems, based in Beranang, Selangor, brings a Malaysian grey-space busbar specialist into the group.
Europe Holds 18.3% Share
Europe is worth USD 263.55 million in 2025 and USD 800.76 million by 2035, a CAGR of 11.75%. DC Market Insights expects retrofit work in older colocation halls to be a larger part of demand than in other regions.
Latin America Holds 5.1% Share
Latin America is worth USD 73.45 million in 2025 and USD 274.82 million by 2035, a CAGR of 14.11%, led by Brazil.
Middle East and Africa Holds 4.7% Share
The Middle East and Africa is worth USD 67.69 million in 2025 and USD 284.30 million by 2035. Saudi Arabia is the largest country market in the region in the DC Market Insights allocation. Investors weighing new markets can read how we assess power, fiber routes and permitting in our data center site selection and feasibility work.
Country Analysis: Which Countries Buy the Most Data Center Busway?
The United States is the largest country market for data center busway at USD 575.51 million in 2025, 40.0% of global value, followed by China at USD 145.19 million (10.1%) and Canada at USD 69.68 million (4.8%). The 12 largest countries account for 79.8% of 2025 spending.
| Rank | Country | Region | 2025 (USD billion) | Share 2025 | 2035 (USD billion) | CAGR 2025-2035 |
|---|---|---|---|---|---|---|
| 1 | United States | North America | 0.58 | 40.0% | 1.71 | 11.48% |
| 2 | China | Asia Pacific | 0.15 | 10.1% | 0.48 | 12.62% |
| 3 | Canada | North America | 0.07 | 4.8% | 0.25 | 13.44% |
| 4 | Japan | Asia Pacific | 0.06 | 3.9% | 0.17 | 11.95% |
| 5 | United Kingdom | Europe | 0.05 | 3.7% | 0.15 | 10.85% |
| 6 | Germany | Europe | 0.05 | 3.5% | 0.15 | 11.34% |
| 7 | India | Asia Pacific | 0.05 | 3.2% | 0.24 | 17.93% |
| 8 | Australia | Asia Pacific | 0.04 | 2.5% | 0.13 | 13.47% |
| 9 | Brazil | Latin America | 0.03 | 2.3% | 0.12 | 13.82% |
| 10 | France | Europe | 0.03 | 2.0% | 0.09 | 12.34% |
| 11 | Malaysia | Asia Pacific | 0.03 | 1.9% | 0.12 | 15.63% |
| 12 | Netherlands | Europe | 0.03 | 1.8% | 0.07 | 10.43% |
India is the fastest-growing large country market at 17.93% a year, ahead of Malaysia at 15.63%, as hyperscale and colocation operators add capacity outside the established Asian hubs. The country figures are a DC Market Insights allocation of the regional totals, weighted by each country’s estimated share of installed and new data center capacity.
Forecast Scenarios: How Could the 2035 Forecast Change?
The Data Center Busway Market reaches USD 4.74 billion by 2035 in the base case, with a range of USD 3.70 billion to USD 5.71 billion across the low and high scenarios.
| Scenario | Assumption from 2026 | 2035 (USD billion) | CAGR 2025-2035 |
|---|---|---|---|
| Low | Capacity completions 15% below base; busway adoption 10% below base | 3.70 | 9.89% |
| Base | Completions rise to 27.0 GW a year; white-space adoption reaches 70% | 4.74 | 12.65% |
| High | Completions 15% above base; busway adoption 6% above base | 5.71 | 14.77% |
The low case is what a two-year pause in AI capital spending looks like: completions slip and more halls keep floor PDUs and whips. Higher-voltage and direct-current distribution at the rack is the main technical swing factor: it changes the current each run must carry, which affects the rating mix more than the total.
Competitive Insights: Who Leads the Data Center Busway Market?
- Schneider Electric
- Siemens
- Legrand
- Vertiv
- Eaton
- ABB
- LS Cable & System
- EAE Group
- CHINT
- USA TrackBusway
DC Market Insights estimates that the five largest suppliers, Schneider Electric, Siemens, Legrand, Vertiv and Eaton, together hold about 58% of the 2025 market, based on the breadth of their data center busway ranges and their regional manufacturing footprints; busway sales are not reported separately in the disclosures reviewed. Legrand reports data center sales of EUR 2.4 billion in 2025, 26% of group sales of EUR 9,480.6 million and up from EUR 0.7 billion in 2020, and covers both spaces through Starline track busway in the white space and Zucchini and Linkk busbar in the grey space. Vertiv reported 2025 net sales of USD 10.23 billion and a backlog of USD 15.0 billion and sells PowerBar track busway. Schneider Electric competes with I-Line Track, Siemens with its SIVACON 8PS LData system, and Eaton with Pow-R-Way III busway, which H5 Data Centers selected for its facilities. ABB offers busway rated from 225 to 6000A AC, and lists data centers among the industries it serves. LS Cable & System is expanding its US busway business, led by its Data-way product, EAE Group supplies E-Line busbar for metering cabinet rows in the white space, CHINT sells HV&LV busway, and USA TrackBusway competes as a manufacturer-direct track specialist.
Recent Developments
- In April 2024, Schneider Electric unveiled I-Line Track, a medium power distribution busway for data centers with hot-pluggable tap-off units that it says is 60% more compact than mainstream products (Source: Schneider Electric press release).
- In June 2025, Legrand announced the acquisition of Linkk Busway Systems, a Malaysian power busbar specialist for data center grey space with annual revenue of around EUR 45 million and more than 240 employees (Source: Legrand press release).
- In January 2026, LS Cable & System USA opened a logistics hub at Port Crossing Commerce Center in La Porte, Texas, near Houston, to support its busduct business (Source: LS Cable & System USA announcement).
- In March 2026, Vertiv introduced a double-stack configuration of its PowerBar Track busway, rated up to 2000A under UL 857 and up to 2500A under IEC 61439-6, in copper and aluminum (Source: Vertiv press release).
- In March 2026, Siemens announced more than USD 165 million to expand US manufacturing, with more than 350 new jobs, and named busway systems among the products that route power within large data center campuses (Source: Siemens press release).
- In June 2026, USA TrackBusway made its 225A-per-phase track busway available for purchase, with 450A splitters that divide a run into two 225A-per-phase sections (Source: USA TrackBusway announcement).
We follow these launches, deals and capacity announcements as they happen in our data center industry updates.
Methodology: How We Built the Data Center Busway Market Model
DC Market Insights built this market bottom-up from 16 annual capacity cohorts (2020 to 2035). Each cohort was split into white space and grey space: white-space busway spend equals completed MW × the share of new white space using overhead busway (48% in 2025) × busway cost per MW (USD 0.110 million in 2025), and grey-space spend equals completed MW × the share using feeder busway (55%) × feeder cost per MW (USD 0.095 million). Retrofit and expansion spending was added on the installed base at USD 1,200 per installed MW in 2020, rising to USD 1,800 in 2035. Because none of the supplier disclosures reviewed reports data center busway sales, the market is a DC Market Insights model with bound checks rather than a single top-down check, using the four bounds listed in the DC Exclusive section. The total was split by 3 product types, 3 current ratings, 2 conductors, 4 components, 2 deployment types, 4 buyer types and 5 regions, and every split sums to the market total. Country values allocate each regional total by country weights for installed and new capacity. The analyst named on this page built the model, and the reviewer checked the arithmetic, the sources and the dates before publication.
Table of contents
- 01Introduction
- 1.1Market Definition and Scope
- 1.2Product Types, Buyers and Regions Covered
- 1.3Currency, Base Year and Forecast Period
- 1.4Key Questions Answered
- 02Research Methodology
- 2.1Busway Spend per MW Model
- 2.2Capacity Cohorts: White Space and Grey Space
- 2.3Retrofit and Expansion Spending Model
- 2.4Bound Checks Against Supplier Disclosures and Construction Costs
- 2.5Assumptions and Limitations
- 03Executive Summary
- 3.1Market at a Glance, 2020-2035
- 3.2Key Findings
- 3.3Analyst Recommendations by Buyer Type
- 04Market Dynamics
- 4.1Drivers
- 4.2Challenges and Restraints
- 4.3Opportunities
- 4.4Trends
- 4.5Impact Analysis of Drivers and Challenges, 2025-2035
- 05Pricing and Cost Analysis
- 5.1White-Space Busway Spend per MW, 2020-2035
- 5.2Grey-Space Feeder Busway Spend per MW, 2020-2035
- 5.3Busway Adoption Share of New Capacity, 2020-2035
- 5.4Track Busway vs PDUs and Whips: Cost of Ownership
- 06Standards and Regulation
- 6.1IEC 61439-6 Busbar Trunking Systems
- 6.2UL 857 and CSA C22.2 No. 27
- 6.3NFPA 70 Article 368
- 6.4Ratings Under UL and IEC Standards
- 07Supply Chain and Value Chain Analysis
- 7.1Copper and Aluminum Conductors
- 7.2Busway Manufacturing and Regional Capacity
- 7.3Distribution, Agents and Installers
- 7.4Lead Times and Logistics
- 08Global Data Center Busway Market Size and Forecast
- 8.1Market Size, 2020-2024
- 8.2Market Size, 2025
- 8.3Market Forecast, 2026-2035
- 8.4New-Build vs Retrofit Spending
- 09Market by Product Type
- 9.1Feeder Busway
- 9.2Track Busway
- 9.3Plug-in Busway
- 10Market by Current Rating
- 10.1Up to 800 A
- 10.2801 A to 2,500 A
- 10.3Above 2,500 A
- 11Market by Conductor
- 11.1Copper
- 11.2Aluminum
- 12Market by Component
- 12.1Busway Sections
- 12.2Tap-off and Plug-in Units
- 12.3Fittings and Accessories
- 12.4Monitoring and Metering
- 13Market by Deployment
- 13.1New Build
- 13.2Retrofit and Expansion
- 14Market by End-user
- 14.1Hyperscale Data Centers
- 14.2Colocation Data Centers
- 14.3Enterprise Data Centers
- 14.4GPU and Neocloud Providers
- 15DC Exclusive: Product Type × Buyer Matrix
- 15.1Product Type × End-user Matrix, 2025
- 15.2Bound Checks
- 15.3Implications for Suppliers
- 16Market by Region
- 16.1North America (United States, Canada)
- 16.2Europe (United Kingdom, Germany, France, Netherlands, Rest of Europe)
- 16.3Asia Pacific (China, Japan, India, Australia, Malaysia, Singapore, Rest of Asia Pacific)
- 16.4Latin America (Brazil, Rest of Latin America)
- 16.5Middle East and Africa (Saudi Arabia, Rest of Middle East and Africa)
- 16.6Top 12 Countries, 2025 and 2035
- 17Regional Cross-Sections
- 17.1Regional Shares, 2025 and 2035
- 17.2Country Shares Within Regions, 2025 and 2035
- 18Forecast Scenarios
- 18.1Base, Low and High Cases to 2035
- 18.2Sensitivity to Capacity Completions
- 18.3Sensitivity to Busway Adoption
- 19Competitive Landscape
- 19.1Top-Five Supplier Concentration, 2025
- 19.2Product Launches, 2024-2026
- 19.3Acquisitions and Capacity Investments, 2025-2026
- 20Company Profiles
- 20.1Schneider Electric
- 20.2Siemens
- 20.3Legrand
- 20.4Vertiv
- 20.5Eaton
- 20.6ABB
- 20.7LS Cable & System
- 20.8EAE Group
- 20.9CHINT
- 20.10USA TrackBusway
- 21Analyst Recommendations
- 21.1For Busway Suppliers
- 21.2For Hyperscale and Colocation Operators
- 21.3For Investors
- Fig. 1Data Center Busway Market Size, 2020-2035
- Fig. 2New Data Center Capacity Completed per Year, 2020-2035
- Fig. 3Busway Spend per MW, White Space and Grey Space, 2020-2035
- Fig. 4New-Build vs Retrofit Spending, 2020-2035
- Fig. 5Market Share by Product Type, 2025 and 2035
- Fig. 6Market Share by End-user, 2025 and 2035
- Fig. 7Product Type × End-user Matrix, 2025
- Fig. 8Market by Region, 2025 and 2035
- Fig. 9Forecast Scenarios, 2025-2035
- Fig. 10Top 12 Countries, 2025
- Table 1Report Attributes
- Table 2Busway Spend and Adoption per MW, 2020-2035
- Table 3Market by Product Type, 2025 and 2035
- Table 4Market by Current Rating, 2025 and 2035
- Table 5Market by Conductor, 2025 and 2035
- Table 6Market by Component, 2025 and 2035
- Table 7Market by Deployment, 2025 and 2035
- Table 8Market by End-user, 2025 and 2035
- Table 9Product Type × End-user Matrix, 2025
- Table 10Market by Region, 2025 and 2035
- Table 11Top 12 Countries, 2025 and 2035
- Table 12Forecast Scenarios, 2035
- Table 13Company Profiles: Products and Data Center Focus
About this report
Written by Satyabrat Rajawat and reviewed by Deepti Agrawal, Senior Editor, Research. Figures are built top-down and bottom-up and reconciled before publication, with 2025 as the base year.
Read our methodologyHow we built this
- Historical period2020-2024
- Base year2025
- Forecast period2026-2035
- Sizing approachTop-down + bottom-up
Need more than the report?
Advisory on this market
Due diligence, site selection and market entry work, by the analysts who wrote this report.
See consulting servicesFrequently asked questions
USD 1.44 billion in 2025, rising to USD 4.74 billion by 2035. DC Market Insights estimates the market at USD 499.50 million in 2020.
12.65% a year from 2025 to 2035. Growth was faster, at 23.59% a year, between 2020 and 2025 as capacity completions doubled and more halls adopted overhead busway.
Feeder busway, with USD 707.81 million or 49.1% of the market in 2025. Track busway is the fastest-growing product type at 16.15% a year.
About USD 0.110 million per MW for white-space busway and USD 0.095 million per MW for grey-space feeder busway in 2025, according to DC Market Insights estimates that exclude labor.
North America, with USD 645.19 million or 44.8% of 2025 value. The Middle East and Africa grows fastest at 15.43% a year.
Schneider Electric, Siemens, Legrand, Vertiv and Eaton together hold about 58% of the market (DC Market Insights estimate). ABB, LS Cable & System, EAE Group, CHINT and USA TrackBusway also compete.
Hyperscale data centers, with USD 629.35 million or 43.7% of 2025 demand. GPU and neocloud providers grow fastest at 17.82% a year.
USD 575.51 million in the United States, or 40.0% of 2025 spending, followed by China at USD 145.19 million. India grows fastest among large country markets at 17.93% a year (DC Market Insights estimate).
Licences, delivery and payment
Which licence should I choose?
Single User is a view-only PDF for one person. Multi User adds a printable PDF and the Excel data for unlimited users at one location. Enterprise covers your whole company and includes 100 free analyst hours.
How and when will I receive the report?
By email, within 24–48 business hours of payment, in the formats of your licence.
How can I pay?
Securely through PayPal: with a PayPal account, a debit or credit card, or PayPal Pay Later where available. Prices are in US dollars.
Can I see a sample first?
Yes. Request a free sample and we will email it to you.
Can the report be tailored to my needs?
Yes. We can add countries, segments or data cuts. Talk to an analyst about the scope you need.
Can I get an invoice or pay against a purchase order?
Write to sales@dcmarketinsights.com and our team will help.