
Data Center Copper Electrical Materials Market Size, Share & Forecast to 2035
Market at a glance
The Data Center Copper Electrical Materials market was worth USD 3,790.0 million in 2025 and is forecast to reach USD 10.85 billion by 2035, growing at a 11.08% CAGR.
 By Amit Jain, Senior Consultant, ICT & Emerging Technologies
 Reviewed by Deepti Agrawal
Last updated 4 Nov 2026
Base year 2025 PDF + Excel
Key findings
LME Copper Averages About USD 13,539 per Tonne in 2026
NVIDIA's 800 VDC Design Cuts Rack Copper by 45%
Metal Price Swings Pass Straight to Buyers
Busbar Profiles and Shapes Worth USD 2.60 billion by 2035
What is inside the report
- 01Introduction
- 02Executive Summary
- 03Market Scope
- 04Market Dynamics
- 05Pricing Analysis
- 06Standards and Regulation
- 07Market Segmentation by Application
- 08Market Segmentation by Product Form
- 09Market Segmentation by Data Center Type
- 10Market Segmentation by Voltage Level
- 17chapters
- 2020-2024Historical period
- 2026-2035Forecast period
- 17Companies profiled
Segmentation
Companies profiled
- Southwire
- Prysmian (Encore Wire)
- Aurubis
- Nexans
- LS Cable and System
- Freeport-McMoRan
- Codelco
- Mitsubishi Materials (Luvata)
- Wieland
- KME
- Furukawa Electric
- Mueller Industries
- Legrand (Starline)
- Schneider Electric
- Eaton
- ABB
- Siemens
Recent developments
Prysmian completed its acquisition of Encore Wire at USD 290 per share (Source: Prysmian).
Proclamation 10962 set a 50% tariff on semi-finished copper products from 1 August 2025 (Source: Federal Register).
Aurubis reported wire rod output of 869,000 tonnes for fiscal 2024/25 (Source: Aurubis).
the United States applied copper duties to full customs value from 6 April 2026 (Source: The White House).
LS Cable and System said Gaon Cable's US unit would invest USD 50 million to double data center cable capacity (Source: LS Cable and System).
Southwire announced an investment of more than USD 256 million in Starkville, Mississippi, linked to data center growth (Source: Southwire).
the World Bank's Pink Sheet put the third-quarter copper average at USD 14,114 per tonne (Source: World Bank).
Prysmian reported 23.7% organic growth in North American Industrial and Construction and a more than EUR 700 million McKinney programme (Source: Prysmian).
Full analysis
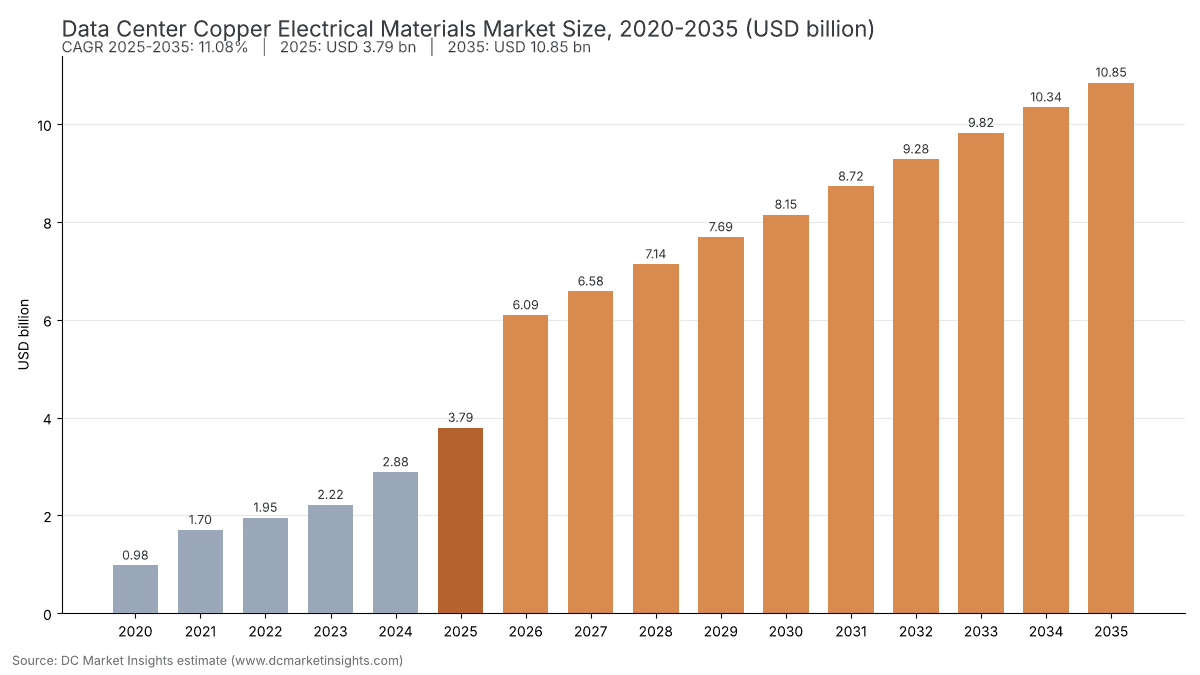
The Data Center Copper Electrical Materials Market is valued at USD 6.09 billion in 2026 and is projected to reach USD 10.85 billion by 2035, up from USD 3.79 billion in 2025, a CAGR of 11.08% from 2025 to 2035 (DC Market Insights estimate). Two numbers move the money here: the tonnes of copper each megawatt of new capacity locks into cable, busbar, switchgear windings and earthing grids, and the London Metal Exchange (LME) price at which that metal is bought. Microsoft’s Chicago data center used 2,177 tonnes of copper, or 27 tonnes per megawatt (MW) of applied power, according to BHP, while the World Bank put the 2026 LME copper average at about USD 13,539 per tonne for January to October, 36% above the 2025 average of USD 9,947. The 2025 receipt is 12,000 MW of new IT capacity × 26.19 tonnes of electrical copper per MW = 314.3 thousand tonnes, plus 116 GW of installed capacity × 0.25 tonnes per MW for refresh and retrofits = 29.0 thousand tonnes, a total of 343.3 thousand tonnes × USD 11,047 per tonne (LME USD 9,947 plus USD 1,100 fabrication premium) = USD 3.79 billion. DC Distribution grows fastest at 29.81% a year as 800-volt direct current racks arrive, and the Middle East and Africa is the fastest region at 14.89%, led by new-build campuses in Saudi Arabia growing 16.79% a year.
Key Market Statistics: How Big Is the Data Center Copper Electrical Materials Market in 2026?
The Data Center Copper Electrical Materials Market reaches USD 6.09 billion in 2026, 60.70% above the USD 3.79 billion of 2025, according to DC Market Insights estimates, because copper prices and new capacity rose together.
- Market size 2025: USD 3.79 billion (343.3 thousand tonnes)
- Market size 2026: USD 6.09 billion (411.8 thousand tonnes)
- Market size 2030: USD 8.15 billion
- Market size 2035: USD 10.85 billion (755.5 thousand tonnes)
- CAGR 2025-2035: 11.08% (low case 7.45%, high case 14.01%)
- Largest application: Power Cable and Building Wire, USD 1.14 billion or 30.0% of 2025 value
- Fastest segment: DC Distribution, 29.81% a year
- Leading region: North America, 45.0% of 2025 value; fastest region Middle East and Africa at 14.89%
- Largest country: United States, USD 1.54 billion in 2025
- Leading suppliers: Southwire, Prysmian (with Encore Wire), Aurubis, Nexans and LS Cable and System together hold about 31% of 2025 value (DC Market Insights estimate)
Key Takeaways: What Decides Copper Spend in Data Centers?
- Price sets the 2026 jump, because the LME average rose from USD 9,947 to about USD 13,600 per tonne: the Data Center Copper Electrical Materials Market grows 60.70% while tonnes grow 19.95%.
- Power distribution dominates, because 75% of data center copper sits in power distribution and 22% in grounding and interconnection, according to the Copper Development Association.
- Busway gains share, because high-density AI halls feed power overhead: Busway and Busbar Trunking rises from 15.0% to 20.0% of value by 2035.
- Intensity falls slowly, because 800 VDC cuts rack-level copper by 45% (NVIDIA): copper per new MW slips from 26.19 to 25.10 tonnes by 2035.
Executive Summary: What Is the Data Center Copper Electrical Materials Market Worth?
The Global Data Center Copper Electrical Materials Market size was valued at USD 976.03 million in 2020, reached USD 3.79 billion in 2025, and is anticipated to reach USD 10.85 billion by 2035, at a CAGR of 11.08% during the forecast period.
| Attribute | Value |
|---|---|
| Historical period | 2020-2024 |
| Base year | 2025 |
| Forecast period | 2026-2035 |
| Market size 2025 | USD 3.79 billion |
| Market size 2026 | USD 6.09 billion |
| CAGR 2025-2035 | 11.08% |
| Market size 2035 | USD 10.85 billion |
| Volume 2025 | 343.3 thousand tonnes |
| Unit | USD million, current prices |
Growth in the Data Center Copper Electrical Materials Market averaged 31.19% a year from 2020 to 2025, as new IT capacity rose from 4.6 GW to 12.0 GW and the copper price rose from USD 6,174 to USD 9,947 per tonne on the World Bank Pink Sheet. From 2026 the pace settles at 11.08% a year: tonnage grows 8.21% a year as completions approach 27 GW in 2035, while DC Market Insights assumes the price eases from about USD 13,600 in 2026 to USD 12,000 in 2030 before tracking inflation.
What Does the Data Center Copper Electrical Materials Market Include?
The Data Center Copper Electrical Materials Market covers USD 3.79 billion of 2025 spending on the copper metal that goes into a data center’s power path and earthing, valued at the LME price plus the premium for rod, wire, busbar, strip and stranded conductor.
Included
- Copper conductor in medium and low voltage power cable, building wire and metal-clad cable inside the site
- Copper busbar and busway trunking, switchgear busbars and transformer, generator, UPS and motor windings
- Earthing grids, bonding conductors, lightning protection and grounding busbars
- In-rack busbars, power shelves and power cords up to the server power supply
Excluded
- The value added by cable insulation, enclosures and assembly, covered in the Data Center Power Cable Market and the Data Center Busway Market
- Copper foil in server printed circuit boards and copper signal cables between accelerators, covered in the AI Server Copper Foil Market
- Copper in plumbing, cooling coils and heat exchangers (about 3% of data center copper)
- Copper in utility substations and transmission lines outside the site fence
How the segments fit together
Each segment dimension of the Data Center Copper Electrical Materials Market sums to the same USD 3.79 billion in 2025: the application view splits it by electrical system, the product-form view by the copper semi-product bought, the data-center-type view by buyer and the voltage view by distribution level.
Why Do Data Center Copper Electrical Materials Market Estimates Differ?
Estimates for copper in data centers differ because some count every tonne in the building and its IT, while the DC Market Insights figure of USD 6.09 billion for 2026 counts only electrical copper inside the fence, at metal-plus-fabrication value.
BHP puts all data center copper at about 0.5 million tonnes a year today, rising six-fold to about 3 million tonnes by 2050; that wider total includes copper inside servers, network gear and connections to the grid. Other definitions price copper at the finished value of cable and switchgear, which adds insulation, enclosure and assembly value to the metal, or add plumbing and cooling copper. This edition keeps 343.3 thousand tonnes in 2025, or about 69% of BHP’s total. Smaller buyers sit inside the scope: enterprise and edge sites, regional colocation operators and electrical contractors buying rod and wire for them.
| Element | Counted here | Why |
|---|---|---|
| Power cable and wire conductor | Yes, USD 1.14 billion | Metal in the site power path |
| Grounding and bonding | Yes, USD 860.83 million | 22% of data center copper (CDA) |
| Busway and switchgear copper | Yes, USD 1.18 billion | Conductors and windings |
| Cable insulation and assembly value | No | Product value, not metal |
| Server PCB foil and signal cables | No | IT equipment copper |
| Plumbing and cooling coils | No | Thermal, not electrical |
Market Drivers: Why Is Data Center Copper Spend Rising?
Three forces add USD 4.36 billion to the Data Center Copper Electrical Materials Market between 2025 and 2030: a record copper price, electrical suppliers’ data center order books and United States tariffs that reroute where rod and wire are made.
LME Copper Averages About USD 13,539 per Tonne in 2026
The World Bank’s monthly series shows copper at USD 13,012 per tonne in January 2026 and USD 14,508 in October, an average of about USD 13,539, against USD 9,947 for 2025. Because data center buyers pay for copper on a pass-through basis, the price step alone adds about USD 1.50 billion to the Data Center Copper Electrical Materials Market in 2026 on 411.8 thousand tonnes. The United States Geological Survey (USGS) reported a record 2025 COMEX average of USD 4.80 per pound, about USD 10,580 per tonne, in its Mineral Commodity Summaries 2026.
Legrand Data Center Sales Reach EUR 2.4 Billion, 26% of Revenue
Data center sales at Legrand, which makes Starline busways, reached EUR 2.4 billion or 26% of group sales in 2025, up from EUR 0.7 billion in 2020, according to its full-year 2025 results. Eaton reported Electrical Americas data center orders up about 200% and data center revenue up about 40% in the fourth quarter of 2025, and Vertiv ended 2025 with a USD 15.0 billion backlog. Each of these orders carries copper: DC Market Insights counts 26.19 tonnes of electrical copper per new MW, so the 14.5 GW completed in 2026 needs about 380 thousand tonnes.
Section 232 Tariff of 50% Moves Rod and Wire Production Into the United States
Proclamation 10962 of 30 July 2025 placed a 50% tariff on semi-finished copper products and copper-intensive derivatives such as cables and electrical components from 1 August 2025, according to the Federal Register, and a proclamation of 2 April 2026 applied the duty to full customs value from 6 April 2026. United States copper demand from data centers, USD 1.54 billion in 2025, is therefore served more by domestic rod mills: Prysmian is spending more than EUR 700 million at Encore Wire in McKinney, Texas, on a second rod mill and metal-clad cable for data centers, and Southwire is investing more than USD 256 million in Starkville, Mississippi.
Market Trends: How Is Copper Use per Megawatt Changing?
Copper per new MW in the Data Center Copper Electrical Materials Market falls from 26.19 tonnes in 2025 to 25.10 tonnes in 2035 (DC Market Insights estimate), as higher voltages thin the conductors while busway takes share from cable.
NVIDIA’s 800 VDC Design Cuts Rack Copper by 45%
A 1 MW rack fed at 54 volts direct current needs up to 200 kilograms of copper busbar, and an 800-volt direct current (VDC) design reduces copper requirements by 45%, according to NVIDIA’s May 2025 architecture paper. DC Market Insights applies that saving to the rack and row layer, about 20% of electrical copper, on 70% of AI capacity by 2035, so DC Distribution grows from USD 151.69 million in 2025 to USD 2.06 billion by 2035 while total intensity falls only 4.2%.
Busduct Revenue at LS Eco Energy Tripled in the First Half of 2026
LS Eco Energy said busduct revenue more than tripled year on year in the first half of 2026 and is investing about KRW 8 billion in Vietnam to double its busduct capacity from the second half of 2027. Busway and Busbar Trunking in the Data Center Copper Electrical Materials Market grows at 14.33% a year, the fastest application, because overhead busway replaces runs of parallel cable in high-density AI halls.
Market Challenges: What Makes Copper Hard to Budget for Data Centers?
Price swings and thrifting are the two main risks to the Data Center Copper Electrical Materials Market: a 10% move in the copper price changes 2026 value by about USD 560.04 million.
Metal Price Swings Pass Straight to Buyers
Cable makers report at fixed standard copper prices, EUR 5,500 per tonne at Prysmian and EUR 5,000 at Nexans, and pass the difference to customers through metal adjustment clauses. Schneider Electric reported about EUR 0.9 billion of copper within its 2025 costs. For a 100 MW campus the USD 38.76 million copper bill at 2026 prices moved by about USD 11.95 million between the 2025 average of USD 9,947 and the October 2026 price of USD 14,508 per tonne (DC Market Insights estimate).
Tariffs Split the United States Price From the World Price
The COMEX average of USD 4.80 per pound in 2025 sat about 9% above the LME cash average of USD 4.40 reported by the USGS, and the April 2026 change to full customs value widened the gap for imported cable and busway. Buyers in the United States, 40.7% of the 2025 market, carry that premium on every imported tonne.
Market Opportunities: Where Will Data Center Copper Demand Grow Most?
Two opportunities stand out in the Data Center Copper Electrical Materials Market: busbar profiles for AI halls and new campuses in India and Saudi Arabia, together worth USD 3.48 billion by 2035 (the groups overlap only where Indian and Saudi sites buy busbar).
Busbar Profiles and Shapes Worth USD 2.60 billion by 2035
Busbar Profiles and Shapes grow from USD 720.52 million in 2025 at 13.71% a year. Aurubis produced 175,000 tonnes of shapes in fiscal 2024/25, and Mitsubishi Materials targets oxygen-free copper for data center and AI busbars, so producers of high-conductivity flat products gain the most from busway and switchgear demand.
India and Saudi Arabia Add USD 707.07 million
India grows from USD 117.56 million to USD 627.10 million at 18.22% a year, and Saudi Arabia from USD 53.09 million to USD 250.62 million at 16.79%, the two fastest large countries in the Data Center Copper Electrical Materials Market. Both build mostly new campuses, so nearly all demand is first-fit copper at 25.70 tonnes per MW rather than replacement.
Pricing: What Does Copper Cost per Tonne and per MW in Data Centers?
Delivered electrical copper for data centers costs USD 14,800 per tonne in 2026 (DC Market Insights estimate), or about USD 0.39 million per MW of new IT capacity.
| Year | LME copper (USD per tonne) | Fabrication premium (USD per tonne) | Delivered price (USD per tonne) | Copper per MW (tonnes) | Copper cost per MW (USD million) |
|---|---|---|---|---|---|
| 2020 | 6,174 | 900 | 7,074 | 26.19 | 0.19 |
| 2025 | 9,947 | 1,100 | 11,047 | 26.19 | 0.29 |
| 2026 | 13,600 | 1,200 | 14,800 | 26.19 | 0.39 |
| 2030 | 12,000 | 1,299 | 13,299 | 25.70 | 0.34 |
| 2035 | 12,927 | 1,434 | 14,361 | 25.10 | 0.36 |
Public anchors: the World Bank LME series for 2020 to 2026, the USGS COMEX average of USD 4.80 per pound for 2025, and the standard copper prices of EUR 5,500 and EUR 5,000 per tonne used by Prysmian and Nexans. Fabrication premiums blend wire rod with busbar and strip and are DC Market Insights estimates; 2027-2035 LME values are DC Market Insights assumptions, not forecasts by the sources named.
Standards and Regulation: Which Rules Shape Copper Use in Data Centers?
Trade rules and wiring codes govern the Data Center Copper Electrical Materials Market: three United States proclamations between July 2025 and June 2026 set copper import duties, while electrical codes fix how much conductor and earthing each site needs.
- Proclamation 10962 (30 July 2025): 50% tariff on semi-finished copper products and copper-intensive derivatives from 1 August 2025, with a phased refined-copper duty of 15% from 2027 and 30% from 2028 left open (Source: Federal Register).
- Proclamation of 2 April 2026: duties on copper articles apply to full customs value from 6 April 2026, at 50%, 25% or 10% depending on the annex and on United States smelting (Source: The White House).
- Proclamation 11032 (1 June 2026): the threshold for goods made of United States metal falls from 95% to 85% (Source: Federal Register).
- EU Critical Raw Materials Act, Regulation (EU) 2024/1252: copper is listed as a strategic raw material (Source: European Commission Joint Research Centre).
- National Electrical Code (NFPA 70), Article 250, and IEC 60364-5-54 set grounding and bonding conductor sizes, which drive the 22.7% earthing share.
- IEC 60228 conductor classes and ASTM B187 for copper bus bar set the conductor grades used in cable and busway.
Market Segmentation: Which Segments Lead the Data Center Copper Electrical Materials Market?
Power Cable and Building Wire leads the Data Center Copper Electrical Materials Market with 30.0% of 2025 value, Wire Rod and Drawn Wire is the main product form at 62.0%, and DC Distribution grows fastest at 29.81% a year.
Data Center Copper Electrical Materials Market by Application
Power Cable and Building Wire is the largest application segment at USD 1.14 billion in 2025; Busway and Busbar Trunking grows fastest at 14.33% a year to USD 2.17 billion by 2035.
| Application | 2025 (USD million) | Share 2025 | 2035 (USD million) | CAGR 2025-2035 |
|---|---|---|---|---|
| Power Cable and Building Wire | 1,137.66 | 30.0% | 2,712.37 | 9.08% |
| Grounding and Bonding | 860.83 | 22.7% | 2,441.14 | 10.99% |
| Switchgear and Transformer Windings | 606.75 | 16.0% | 1,844.41 | 11.76% |
| Busway and Busbar Trunking | 568.83 | 15.0% | 2,169.90 | 14.33% |
| Generator UPS and Motor Windings | 341.30 | 9.0% | 867.96 | 9.78% |
| Rack Power Distribution | 276.83 | 7.3% | 813.71 | 11.38% |
Data Center Copper Electrical Materials Market by Product Form
Wire Rod and Drawn Wire is the largest product form segment at USD 2.35 billion in 2025; Stranded and Braided Conductors grows fastest at 13.91% a year to USD 976.45 million by 2035.
| Product Form | 2025 (USD million) | Share 2025 | 2035 (USD million) | CAGR 2025-2035 |
|---|---|---|---|---|
| Wire Rod and Drawn Wire | 2,351.17 | 62.0% | 5,967.22 | 9.76% |
| Busbar Profiles and Shapes | 720.52 | 19.0% | 2,603.88 | 13.71% |
| Strip and Sheet | 455.07 | 12.0% | 1,301.94 | 11.08% |
| Stranded and Braided Conductors | 265.45 | 7.0% | 976.45 | 13.91% |
Data Center Copper Electrical Materials Market by Data Center Type
Hyperscale Self-Build is the largest data center type segment at USD 1.67 billion in 2025 and also grows fastest at 12.29% a year to USD 5.32 billion by 2035.
| Data Center Type | 2025 (USD million) | Share 2025 | 2035 (USD million) | CAGR 2025-2035 |
|---|---|---|---|---|
| Hyperscale Self-Build | 1,668.57 | 44.0% | 5,316.25 | 12.29% |
| Colocation and Wholesale | 1,403.12 | 37.0% | 4,014.31 | 11.08% |
| Enterprise and Edge | 720.52 | 19.0% | 1,518.93 | 7.74% |
Data Center Copper Electrical Materials Market by Voltage Level
Low Voltage AC is the largest voltage level segment at USD 2.73 billion in 2025; DC Distribution grows fastest at 29.81% a year to USD 2.06 billion by 2035.
| Voltage Level | 2025 (USD million) | Share 2025 | 2035 (USD million) | CAGR 2025-2035 |
|---|---|---|---|---|
| Low Voltage AC | 2,730.39 | 72.0% | 5,967.22 | 8.13% |
| Medium Voltage | 910.13 | 24.0% | 2,820.87 | 11.98% |
| DC Distribution | 151.69 | 4.0% | 2,061.40 | 29.81% |
DC Exclusive: Copper per MW Teardown of a 100 MW AI Campus, 2,619 Tonnes and USD 38.76 million
This teardown is a DC Market Insights model built on 8 inputs: a 100 MW AI campus built in 2026 needs about 2,619 tonnes of electrical copper, worth USD 38.76 million at USD 14,800 per tonne, and an 800 VDC rack design would save about 236 tonnes or USD 3.49 million.
| System | Share of copper | Tonnes per 100 MW | Value at 2026 price (USD million) |
|---|---|---|---|
| Power Cable and Building Wire | 30.0% | 786 | 11.63 |
| Grounding and Bonding | 22.7% | 595 | 8.80 |
| Switchgear and Transformer Windings | 16.0% | 419 | 6.20 |
| Busway and Busbar Trunking | 15.0% | 393 | 5.81 |
| Generator UPS and Motor Windings | 9.0% | 236 | 3.49 |
| Rack Power Distribution | 7.3% | 191 | 2.83 |
| Total | 100.0% | 2,619 | 38.76 |
The inputs are BHP’s 27 tonnes per MW from Microsoft’s Chicago site, the Copper Development Association split of 75% power distribution, 22% grounding and interconnection and 3% plumbing, NVIDIA’s 200 kilograms of busbar per 1 MW rack at 54 volts and its 45% saving at 800 VDC, the 2026 World Bank price, the DC Market Insights fabrication premium of USD 1,200 per tonne, and the application shares above. The teardown shows that copper costs about USD 0.39 million per MW in 2026, and that the USD 3.49 million saved by 800 VDC equals a move of about USD 1,332 per tonne in the LME price.
Regional Insights: Which Region Uses the Most Copper in Data Centers?
North America leads the Data Center Copper Electrical Materials Market with USD 1.71 billion or 45.0% of 2025 value, and the Middle East and Africa grows fastest at 14.89% a year.
| Region | 2025 (USD million) | Share 2025 | 2035 (USD million) | CAGR 2025-2035 |
|---|---|---|---|---|
| North America | 1,706.50 | 45.0% | 4,339.80 | 9.78% |
| Asia Pacific | 1,175.59 | 31.0% | 3,688.83 | 12.11% |
| Europe | 568.83 | 15.0% | 1,518.93 | 10.32% |
| Latin America | 151.69 | 4.0% | 542.47 | 13.59% |
| Middle East and Africa | 189.61 | 5.0% | 759.46 | 14.89% |
North America Data Center Copper Electrical Materials Market
The North America Data Center Copper Electrical Materials Market grows from USD 1.71 billion in 2025 to USD 4.34 billion by 2035 at 9.78% a year. The United States takes USD 1.54 billion of the region, and its tariff regime favours domestic rod: Freeport-McMoRan supplies about 70% of refined copper produced in the country and sold 1.3 billion pounds from its United States mines in 2025.
Asia Pacific Data Center Copper Electrical Materials Market
The Asia Pacific Data Center Copper Electrical Materials Market grows from USD 1.18 billion in 2025 to USD 3.69 billion by 2035 at 12.11% a year. China (USD 529.01 million) and India (USD 117.56 million) lead the region; LS Cable and System’s units are expanding busduct and power-cable capacity for data centers in Vietnam and North Carolina.
Europe Data Center Copper Electrical Materials Market
The Europe Data Center Copper Electrical Materials Market grows from USD 568.83 million in 2025 to USD 1.52 billion by 2035 at 10.32% a year. Germany, the United Kingdom and France lead European demand; Aurubis, which kept wire rod output at 869,000 tonnes in fiscal 2024/25, expects tailwinds from data center expansion.
Latin America Data Center Copper Electrical Materials Market
The Latin America Data Center Copper Electrical Materials Market grows from USD 151.69 million in 2025 to USD 542.47 million by 2035 at 13.59% a year. Brazil holds USD 68.26 million of 2025 value, and the region sits next to Chile’s Codelco, which produced 1,334,445 tonnes of its own copper in 2025.
Middle East and Africa Data Center Copper Electrical Materials Market
The Middle East and Africa Data Center Copper Electrical Materials Market grows from USD 189.61 million in 2025 to USD 759.46 million by 2035 at 14.89% a year. Saudi Arabia grows 16.79% a year as Gulf campuses are built from bare land, so all copper is first-fit at 25.70 tonnes per MW by 2030 (DC Market Insights estimate).
Country Analysis: Which Countries Buy the Most Data Center Copper?
The United States is the largest country in the Data Center Copper Electrical Materials Market with USD 1.54 billion in 2025, and India is the fastest large country at 18.22% a year.
| Rank | Country | Region | 2025 (USD million) | 2035 (USD million) | CAGR 2025-2035 |
|---|---|---|---|---|---|
| 1 | United States | North America | 1,544.38 | 3,862.42 | 9.60% |
| 2 | China | Asia Pacific | 529.01 | 1,475.53 | 10.80% |
| 3 | Japan | Asia Pacific | 152.83 | 424.22 | 10.75% |
| 4 | Canada | North America | 145.05 | 433.98 | 11.58% |
| 5 | India | Asia Pacific | 117.56 | 627.10 | 18.22% |
| 6 | Germany | Europe | 113.77 | 288.60 | 9.76% |
| 7 | United Kingdom | Europe | 108.08 | 273.41 | 9.73% |
| 8 | Australia | Asia Pacific | 94.05 | 276.66 | 11.39% |
| 9 | Malaysia | Asia Pacific | 82.29 | 258.22 | 12.11% |
| 10 | France | Europe | 73.95 | 197.46 | 10.32% |
| 11 | Brazil | Latin America | 68.26 | 227.84 | 12.81% |
| 12 | Saudi Arabia | Middle East and Africa | 53.09 | 250.62 | 16.79% |
Forecast Scenarios: How Large Could the Data Center Copper Electrical Materials Market Be by 2035?
The Data Center Copper Electrical Materials Market ranges from USD 7.78 billion to USD 14.07 billion in 2035 across three DC Market Insights scenarios, with the base case at USD 10.85 billion.
| Scenario | 2035 (USD million) | CAGR 2025-2035 | Assumption |
|---|---|---|---|
| Low | 7,777.99 | 7.45% | Copper 18% below base from 2030, completions 15% lower, faster 800 VDC thrift |
| Base | 10,849.50 | 11.08% | LME USD 12,000 in 2030, 27 GW completions in 2035 |
| High | 14,074.48 | 14.01% | Copper 18% above base, completions 12% higher, slower 800 VDC uptake |
Competitive Insights: Who Supplies Copper to Data Centers?
The five largest suppliers, Southwire, Prysmian (with Encore Wire), Aurubis, Nexans and LS Cable and System, hold about 31% of the Data Center Copper Electrical Materials Market in 2025 (DC Market Insights estimate based on rod and cable capacity and disclosed data center exposure), with miners and refiners upstream and switchgear makers buying copper strip and busbar.
- Southwire
- Prysmian (Encore Wire)
- Aurubis
- Nexans
- LS Cable and System
- Freeport-McMoRan
- Codelco
- Mitsubishi Materials (Luvata)
- Wieland
- KME
- Furukawa Electric
- Mueller Industries
- Legrand (Starline)
- Schneider Electric
- Eaton
- ABB
- Siemens
Prysmian’s Industrial and Construction business grew 14.2% organically in the third quarter of 2026 on Encore Wire and data center demand, with North America up 23.7%, according to its third-quarter 2026 release. Nexans posted 2025 sales of EUR 6,098 million at standard metal prices, with fourth-quarter PWR-Connect growth of 10.9% helped by data center deliveries (Source: Nexans full-year 2025 results). Gaon Cable’s United States unit is investing USD 50 million to double data center power-cable capacity in Tarboro, North Carolina (Source: LS Cable and System, June 2026).
Recent Developments in the Data Center Copper Electrical Materials Market
Eight dated events between July 2024 and October 2026 changed copper supply and pricing in the Data Center Copper Electrical Materials Market.
- In July 2024, Prysmian completed its acquisition of Encore Wire at USD 290 per share (Source: Prysmian).
- In July 2025, Proclamation 10962 set a 50% tariff on semi-finished copper products from 1 August 2025 (Source: Federal Register).
- In December 2025, Aurubis reported wire rod output of 869,000 tonnes for fiscal 2024/25 (Source: Aurubis).
- In April 2026, the United States applied copper duties to full customs value from 6 April 2026 (Source: The White House).
- In June 2026, LS Cable and System said Gaon Cable’s US unit would invest USD 50 million to double data center cable capacity (Source: LS Cable and System).
- In August 2026, Southwire announced an investment of more than USD 256 million in Starkville, Mississippi, linked to data center growth (Source: Southwire).
- In October 2026, the World Bank’s Pink Sheet put the third-quarter copper average at USD 14,114 per tonne (Source: World Bank).
- In October 2026, Prysmian reported 23.7% organic growth in North American Industrial and Construction and a more than EUR 700 million McKinney programme (Source: Prysmian).
Research Methodology: How DC Market Insights Sized the Data Center Copper Electrical Materials Market
DC Market Insights sized the Data Center Copper Electrical Materials Market bottom-up at USD 3.79 billion for 2025 from tonnes per MW and the copper price, with three bound checks; the full approach is set out in our research methodology.
- Capacity: new IT capacity of 12.0 GW in 2025, 22 GW in 2030 and 27 GW in 2035; installed base 116 GW in 2025 and 311 GW in 2035.
- Intensity: 27 tonnes per MW (BHP) × 97% electrical share (Copper Development Association) = 26.19 tonnes; 800 VDC removes 45% of the rack and row layer (20% of copper) on 0% of AI capacity in 2026, 35% in 2030 and 70% in 2035; replacement 0.25 tonnes per installed MW-year.
- Price: World Bank LME averages 2020-2025, USD 13,600 for 2026, USD 12,000 for 2030 and +1.5% a year after; fabrication premium USD 1,100 per tonne in 2025, +2% a year from USD 1,200 in 2026.
- Bound check 1 (ceiling): 343.3 thousand tonnes in 2025 is about 69% of BHP’s estimate of about 0.5 million tonnes for all data center copper, which also counts IT equipment.
- Bound check 2 (ceiling): the same tonnage is 1.18% of the 29.0 million tonnes of world refined copper output in 2025 reported by the USGS, close to BHP’s 1% digital share of demand.
- Bound check 3 (floor): copper in power cable, USD 1.14 billion, is 65% of the USD 1.74 billion DC Market Insights Data Center Power Cable Market in 2025, consistent with copper’s share of low and medium voltage cable value at 2025 prices.
- Splits: every segment, region and country split sums to the total in every year from 2020 to 2035; CAGRs are recomputed from endpoint values.
Related DC Market Insights research includes the Data Center High-Voltage Direct Current (HVDC) Market, which tracks the 800 VDC shift that thins rack copper.
Table of contents
- 01Introduction
- 1.1Market Definition and Scope
- 1.2Research Methodology
- 02Executive Summary
- 2.1Market Snapshot, 2025, 2026 and 2035
- 2.2Key Market Statistics
- 2.3Key Takeaways
- 03Market Scope
- 3.1Included
- 3.2Excluded
- 3.3Why Estimates Differ
- 04Market Dynamics
- 4.1LME Copper Price in 2026
- 4.2Legrand, Eaton and Vertiv Data Center Orders
- 4.3Section 232 Copper Tariff
- 4.4NVIDIA 800 VDC Copper Saving
- 4.5LS Eco Energy Busduct Growth
- 4.6Metal Price Pass-Through
- 4.7US and World Price Gap
- 4.8Busbar Profiles and Shapes
- 4.9India and Saudi Arabia
- 05Pricing Analysis
- 5.1Copper Price and Cost per MW, 2020-2035
- 5.2Public Price Anchors
- 06Standards and Regulation
- 6.1Proclamation 10962
- 6.2April 2026 Full Customs Value Rule
- 6.3Proclamation 11032
- 6.4EU Critical Raw Materials Act
- 6.5NFPA 70 and IEC 60364-5-54
- 6.6IEC 60228 and ASTM B187
- 07Market Segmentation by Application
- 7.1Power Cable and Building Wire
- 7.2Grounding and Bonding
- 7.3Switchgear and Transformer Windings
- 7.4Busway and Busbar Trunking
- 7.5Generator UPS and Motor Windings
- 7.6Rack Power Distribution
- 08Market Segmentation by Product Form
- 8.1Wire Rod and Drawn Wire
- 8.2Busbar Profiles and Shapes
- 8.3Strip and Sheet
- 8.4Stranded and Braided Conductors
- 09Market Segmentation by Data Center Type
- 9.1Hyperscale Self-Build
- 9.2Colocation and Wholesale
- 9.3Enterprise and Edge
- 10Market Segmentation by Voltage Level
- 10.1Low Voltage AC
- 10.2Medium Voltage
- 10.3DC Distribution
- 11DC Exclusive
- 11.1Copper per MW Teardown of a 100 MW AI Campus
- 12Regional Insights
- 12.1North America
- 12.2Asia Pacific
- 12.3Europe
- 12.4Latin America
- 12.5Middle East and Africa
- 13Country Analysis
- 13.1United States
- 13.2China
- 13.3Japan
- 13.4Canada
- 13.5India
- 13.6Germany
- 13.7United Kingdom
- 13.8Australia
- 13.9Malaysia
- 13.10France
- 13.11Brazil
- 13.12Saudi Arabia
- 14Forecast Scenarios
- 14.1Low Scenario
- 14.2Base Scenario
- 14.3High Scenario
- 15Competitive Insights
- 15.1Market Concentration
- 15.2Southwire
- 15.3Prysmian (Encore Wire)
- 15.4Aurubis
- 15.5Nexans
- 15.6LS Cable and System
- 15.7Freeport-McMoRan
- 15.8Codelco
- 15.9Mitsubishi Materials (Luvata)
- 15.10Wieland
- 15.11KME
- 15.12Furukawa Electric
- 15.13Mueller Industries
- 15.14Legrand (Starline)
- 15.15Schneider Electric
- 15.16Eaton
- 15.17ABB
- 15.18Siemens
- 16Recent Developments
- 16.1July 2024 to October 2026
- 17Research Methodology
- 17.1Capacity and Intensity
- 17.2Price
- 17.3Bound Checks
- Fig. 1Data Center Copper Electrical Materials Market Size, 2020-2035
- Table 1Market Snapshot, 2025, 2026 and 2035
- Table 2Scope Comparison
- Table 3Copper Price and Cost per MW, 2020-2035
- Table 4Market by Application, 2025 and 2035
- Table 5Market by Product Form, 2025 and 2035
- Table 6Market by Data Center Type, 2025 and 2035
- Table 7Market by Voltage Level, 2025 and 2035
- Table 8Copper per MW Teardown of a 100 MW AI Campus
- Table 9Market by Region, 2025 and 2035
- Table 10Top 12 Countries, 2025 and 2035
- Table 11Forecast Scenarios, 2035
About this report
Written by Amit Jain and reviewed by Deepti Agrawal, Senior Editor, Research. Figures are built top-down and bottom-up and reconciled before publication, with 2025 as the base year.
Read our methodologyHow we built this
- Historical period2020-2024
- Base year2025
- Forecast period2026-2035
- Sizing approachTop-down + bottom-up
Need more than the report?
Advisory on this market
Due diligence, site selection and market entry work, by the analysts who wrote this report.
See consulting servicesFrequently asked questions
USD 6.09 billion in 2026, up 60.70% from USD 3.79 billion in 2025, according to DC Market Insights estimates. The market is projected to reach USD 10.85 billion by 2035, a CAGR of 11.08% from 2025.
11.08% a year from 2025 to 2035, after 31.19% a year from 2020 to 2025, as new IT capacity rose to 12.0 GW and copper climbed from USD 6,174 to USD 9,947 per tonne.
About 26.19 tonnes of electrical copper per MW of new IT capacity in 2025: 27 tonnes per MW measured at Microsoft’s Chicago site, less 3% for plumbing and cooling (DC Market Insights estimate).
343.3 thousand tonnes in 2025, rising to 411.8 thousand tonnes in 2026 and 755.5 thousand tonnes by 2035 (DC Market Insights estimate), within BHP’s estimate of about 0.5 million tonnes for all data center copper.
Power Cable and Building Wire, with USD 1.14 billion or 30.0% of 2025 value. Busway and Busbar Trunking grows fastest among applications at 14.33% a year.
NVIDIA says 800 VDC cuts rack copper by 45% against 54-volt busbars. DC Market Insights applies it to 70% of AI capacity by 2035, so copper per new MW falls from 26.19 to 25.10 tonnes.
North America, with USD 1.71 billion or 45.0% of 2025 value. The Middle East and Africa grows fastest at 14.89% a year, and India is the fastest large country at 18.22%.
A 50% Section 232 tariff on semi-finished copper and derivatives such as cables has applied since 1 August 2025, and on full customs value since 6 April 2026, so US buyers turn to domestic rod mills.
About 31% of 2025 value is held by Southwire, Prysmian with Encore Wire, Aurubis, Nexans and LS Cable and System together (DC Market Insights estimate). Freeport-McMoRan, Codelco, Mitsubishi Materials and Wieland supply metal upstream.
The DC Market Insights figure of USD 6.09 billion for 2026 counts only electrical copper inside the site at metal-plus-fabrication value. Estimates that add IT copper, plumbing or finished cable value are larger.
Get this report
How do I get the full report?
Request a quote; we reply by email within one business day.
How and when will I receive the report?
By email, within 24–48 business hours of payment.
How can I pay?
Once you accept the quote, we email you a secure payment link.
Can I see a sample first?
Yes. Request a free sample and we will email it to you.
Can the report be tailored to my needs?
Yes. We can add countries, segments or data cuts. Talk to an analyst about the scope you need.
Can I get an invoice or pay against a purchase order?
Write to sales@dcmarketinsights.com and our team will help.