
Data Center Dry Cooler Market Size, Share & Forecast to 2035
Market at a glance
The Data Center Dry Cooler market was worth USD 1,010.0 million in 2025 and is forecast to reach USD 4,750.0 million by 2035, growing at a 16.72% CAGR.
 By Amit Jain, Senior Consultant, ICT & Emerging Technologies
 Reviewed by Deepti Agrawal
Last updated 18 Oct 2026
Base year 2025 PDF + Excel
Reviewed by Deepti Agrawal
Last updated 18 Oct 2026
Base year 2025 PDF + Excel
Key findings
Hot Climates and Fan Power Keep Chillers in the Loop
What is inside the report
- 01Introduction
- 02Research Methodology
- 03Executive Summary
- 04What Is a Data Center Dry Cooler?
- 05Why Do Data Center Dry Cooler Market Estimates Differ?
- 06Market Drivers
- 07Market Trends
- 08Market Restraints
- 09Market Opportunities
- 10Pricing Analysis: Data Center Dry Cooler Cost per MW
- 21chapters
- 2020-2024Historical period
- 2026-2035Forecast period
- —Companies profiled
Segmentation
Recent developments
Kelvion won an order worth more than USD 800 million for over 1,000 Mega-Bay dry coolers with 5 GW of heat rejection, for delivery through 2027 (Source: Kelvion).
California's governor signed AB 2469 and AB 2619 on data center water use (Source: Office of the Governor of California).
the European Commission adopted a data centre rating scheme with PUE and WUE classes (Source: European Commission).
SLB agreed to acquire Kelvion for about USD 3.4 billion, with closing expected in the first half of 2027 (Source: SLB).
Alfa Laval launched FreeWaterLoop, an external cooling system for the data center facility loop (Source: Alfa Laval).
Güntner announced plans for its own production facility in the Middle East (Source: Güntner).
Full analysis
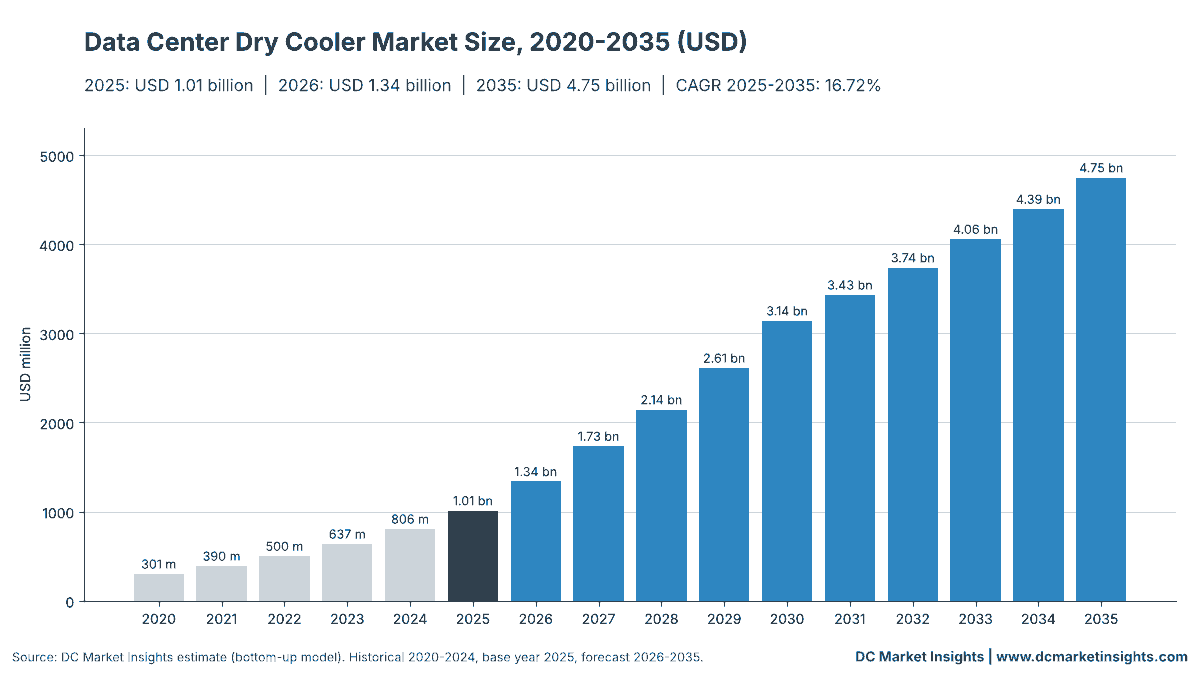
The Data Center Dry Cooler Market is valued at USD 1.34 billion in 2026 and is projected to reach USD 4.75 billion by 2035, up from USD 1.01 billion in 2025, a compound annual growth rate (CAGR) of 16.72% from 2025 to 2035 (DC Market Insights estimate). The money here moves with coolant temperature: once NVIDIA Corporation (NVIDIA) designed its liquid-cooled racks to accept 45 °C supply water, an artificial intelligence (AI) hall could reject all of its heat through fans and finned coils, with no chiller and no evaporated water. Kelvion showed the scale of that switch in October 2026 with an order worth more than USD 800 million for over 1,000 large-format dry coolers carrying 5 gigawatts (GW) of heat rejection, which works out at about USD 160 per kilowatt (kW). DC Market Insights therefore expects the dry-cooled share of new AI capacity to climb from 50% in 2025 to 70% in 2035, lifting dry-cooler-served new capacity from 4,752 megawatts (MW) to 16,146 MW a year. Large-format multi-MW dry coolers are the fastest-growing product at 24.52% a year, and Latin America is the fastest-growing region at 20.50% a year.
Key Market Statistics: How Big Is the Data Center Dry Cooler Market in 2026?
DC Market Insights values the Data Center Dry Cooler Market at USD 1.34 billion in 2026, 32.30% above 2025, as AI campuses ordered in 2025 receive their fan-coil heat rejection.
- Market size 2025: USD 1.01 billion
- Market size 2026: USD 1.34 billion
- Market size 2030: USD 3.14 billion
- Market size 2035: USD 4.75 billion
- CAGR 2025-2035: 16.72% in the base case, 14.47% in the low case and 18.14% in the high case
- Dry-cooler-served new IT capacity: 4,752 MW in 2025 (39.6% of new capacity) and 16,146 MW in 2035 (59.8%)
- Largest product type: V-type and A-frame dry coolers, 50.0% of 2025 value (USD 505.62 million)
- Fastest-growing product type: large-format multi-MW dry coolers, 24.52% a year
- Leading region: North America, 42.0% of 2025 value (USD 424.72 million)
- Fastest-growing region: Latin America, 20.50% a year
- Largest country: the United States, USD 384.27 million in 2025 (38.0% of global value)
- Market leader: Kelvion, about 41% of 2026 value (DC Market Insights assessment)
Executive Summary
The Global Data Center Dry Cooler Market size was valued at USD 300.71 million in 2020, reached USD 1.01 billion in 2025, and is anticipated to reach USD 4.75 billion by 2035, at a CAGR of 16.72% during the forecast period.
| Report attribute | Details |
|---|---|
| Historical Period | 2020-2024 |
| Base Year | 2025 |
| Forecast Period | 2026-2035 |
| Data Center Dry Cooler Market Size 2025 | USD 1.01 Billion |
| Data Center Dry Cooler Market Size 2026 | USD 1.34 Billion |
| Data Center Dry Cooler Market, CAGR | 16.72% |
| Data Center Dry Cooler Market Size 2035 | USD 4.75 Billion |
Data center dry cooler spending grew 27.45% a year from 2020 to 2025, because new data center IT capacity doubled to 12,000 MW a year and the dry-cooled share of AI halls rose from 30% to 50%. Growth of 16.72% a year to 2035 rests on three numbers in the model: the AI share of new capacity rises from 35% to 66%, the dry-cooled share of that AI capacity rises from 50% to 70%, and an AI hall needs USD 205,000 of dry cooler equipment per MW of IT load in 2025 against USD 95,000 for a conventional hall that uses dry coolers only as a free-cooling economiser. The installed base adds a second, slower stream: replacement, upgrades and service on 37,120 MW of dry-cooler-served capacity in 2025 and 143,060 MW in 2035 hold 22.4% of the market in 2025 and 21.5% in 2035.
Key Takeaways
- The market grows more than fourfold, to USD 4.75 billion by 2035, because warm-water liquid cooling turns the dry cooler from a free-cooling add-on into the only heat rejection device on many AI campuses.
- Chiller-less liquid cooling loops become the largest application at 52.0% of 2035 value, because 45 °C coolant removes the need for a compressor stage.
- Large-format multi-MW units rise from 22.0% to 42.0% of value, because hyperscale buyers now order heat rejection in 5 MW blocks rather than in 1 MW units.
- Kelvion holds about 41% of 2026 value, because its USD 800 million order for 2027 deliveries alone equals 46.1% of the 2027 market.
- Europe grows slowest at 13.68% a year, because cool climates already made dry free cooling standard there before AI demand arrived.
What Is a Data Center Dry Cooler, and What Does This Market Include?
A data center dry cooler rejects facility heat by blowing outdoor air across a finned coil that carries water or glycol, without evaporating any water, and DC Market Insights values these units with their installation, replacement and service at USD 1.01 billion in 2025.
Included. V-type and A-frame dry coolers, flatbed (horizontal) dry coolers and large-format multi-MW dry coolers sold to data centers; units serving chiller-less liquid cooling loops, free-cooling economisers on chilled-water plants, and condenser or trim loops of water-cooled chillers; electronically commutated fans, coils and controls supplied with the unit; installation and commissioning; replacement units, coil and fan upgrades; and service contracts on the dry-cooler-served installed base.
Excluded. Adiabatic and hybrid coolers that wet pads or spray water on hot days, and evaporative towers (both in the Data Center Cooling Tower Market); air-cooled chillers with built-in condensers (in the Data Center Chiller Market); direct-expansion condensers of computer room air conditioners; coolant distribution units, pumps and piping; glycol and water treatment; and dry coolers for offices or industrial plants.
How the segments fit together. Every dollar is classified once by product type (V-type and A-frame, flatbed horizontal, large-format multi-MW), once by application (free-cooling economisers, chiller-less liquid loops, chiller condenser and trim loops), once by data center type and once by offering (new-build equipment, installation and commissioning, replacement and upgrades, service). Each dimension sums to the total in every year from 2020 to 2035.
Why Do Data Center Dry Cooler Market Estimates Differ?
Published figures for dry coolers in data centers differ because many include adiabatic coolers or all heat exchangers; the DC Market Insights figure of USD 1.34 billion in 2026 counts only waterless fan-coil units and their services.
Broader definitions add three things. First, adiabatic and hybrid coolers, which look like dry coolers but spray water or wet pads above a set ambient temperature; DC Market Insights places them with evaporative heat rejection because they consume water, and they are valued in the cooling tower report. Second, the whole thermal portfolio of a supplier: SLB expects Kelvion’s 2026 data center revenue to reach USD 1.2 billion to 1.3 billion, but that figure also covers plate heat exchangers, adiabatic coolers and heat transfer equipment sold to chiller makers. Third, air-cooled condensers and the condenser coils inside air-cooled chillers, which some sources count as dry heat rejection; here they belong to chillers and precision air conditioning.
| Element | In DC Market Insights scope? | Why |
|---|---|---|
| Waterless dry coolers (V-type, flatbed, large-format) | Yes, USD 1.01 billion in 2025 | Core product: no evaporated water in any operating mode |
| Installation, replacement and service | Yes, USD 328.81 million in 2025 | Spend tied to the same units over their 20-year life |
| Adiabatic and hybrid coolers | No | Use water on hot days; valued with cooling towers |
| Air-cooled chillers and their condensers | No | Compressor-based; valued with chillers |
| Plate heat exchangers and coolant distribution units | No | Inside the building, not heat rejection to air |
Out-of-scope terms that some estimates fold in are adiabatic coolers, hybrid fluid coolers, air-cooled condensers, plate heat exchangers and industrial process coolers. The buyer groups inside the scope are hyperscale cloud and AI operators, colocation providers, and enterprises and small and medium-sized enterprises (SMEs) running their own server rooms and edge sites.
What Is Driving Demand for Data Center Dry Coolers?
Three forces lift dry-cooler-served new capacity from 4,752 MW in 2025 to 16,146 MW in 2035, and each one is specific to how AI halls reject heat.
NVIDIA’s 45 °C Coolant Lets AI Halls Drop the Chiller
NVIDIA wrote in June 2026 that 45 °C liquid cooling “can enable chiller-less operation with dry coolers”, and that a reference design of this kind uses no water, against about 2.6 million gallons per MW a year for an evaporative design (NVIDIA). When the coolant returns warmer than the outdoor air on almost every hour of the year, a fan and a coil do all the work. DC Market Insights models the dry-cooled share of new AI capacity at 50% in 2025, 60% in 2027 and 70% in 2035, which puts chiller-less liquid loops at USD 2.47 billion of 2035 value.
A USD 800 Million Order for 5 GW of Heat Rejection
Kelvion announced on 7 October 2026 an order worth more than USD 800 million for the “supply of 1,000+ Mega-Bay dry cooler units throughout 2027”, providing 5 GW of heat rejection for high-density AI computing (Kelvion). One hyperscale programme therefore buys about USD 0.80 million per unit and 5 MW per unit, and that single contract equals 46.1% of the USD 1.73 billion market DC Market Insights expects in 2027.
Water Reporting Rules Make Waterless Heat Rejection the Default Permit Choice
European Union (EU) Delegated Regulation 2024/1364 requires data centres with at least 500 kW of IT power demand to report total water input, and the European Commission’s rating scheme of September 2026 adds Water Usage Effectiveness (WUE) classes (EUR-Lex). California signed AB 2469 and AB 2619 on data center water use in September 2026, and Utah’s HB 76 makes sites withdrawing 75 acre-feet or more a year report that use. A dry cooler reports zero water, which DC Market Insights treats as one reason the dry share of conventional new capacity rises from 34% in 2025 to 40% in 2035.
How Are Data Center Dry Cooler Designs Changing?
Dry cooler units are getting larger and warmer-running: large-format multi-MW units rise from 22.0% of 2025 value to 42.0% of 2035 value in the DC Market Insights model.
Mega-Bay Units Move Heat Rejection to 5 MW Blocks
The Kelvion order averages 5 MW of heat rejection per unit, several times the rating of the V-type units that dominated colocation roofs before 2023. Fewer, larger units cut crane lifts, piping joints and controls points per MW, which is why DC Market Insights grows large-format units at 24.52% a year to USD 1.99 billion by 2035, while V-type and A-frame units grow 14.14% a year.
Heat Transfer Specialists Enter With Facility-Loop Systems
Alfa Laval launched FreeWaterLoop in March 2026 and called it “an external cooling system for the data center facility loop”, marking its entry into data center heat rejection with a system that uses natural water sources and returns water to its origin. LU-VE Group, an Italian coil and dry cooler maker, reported 2025 turnover of EUR 605.4 million and an order book of EUR 233.7 million, up 34.2%, and said growth would come mainly from power generation and data centres (LU-VE Group). New entrants push the conventional dry cooler price per MW of IT up only from USD 95,000 in 2025 to USD 108,000 in 2035 in the model.
Factories Follow Demand Into the Gulf
Güntner said in February 2026 that it is preparing “the upcoming construction of our own production facility” in the Middle East, after showing dry coolers and adiabatic systems for data centers in Dubai. DC Market Insights grows Middle East and Africa dry cooler spending at 19.82% a year to USD 308.45 million by 2035.
Market Restraints: What Holds Back Data Center Dry Cooler Spending?
Two restraints cap the dry share of new AI capacity at 70% by 2035 in the base case, leaving about USD 0.85 billion of 2035 demand in chiller condenser and trim loops.
Hot Climates and Fan Power Keep Chillers in the Loop
The International Energy Agency (IEA) notes that evaporative cooling towers are water intensive but much less energy intensive than the alternatives. On sites where the design dry-bulb temperature passes 40 °C, a dry cooler alone cannot hold 45 °C supply water, so operators add trim chillers or adiabatic stages. DC Market Insights keeps 30% of new AI capacity outside dry heat rejection in 2035 for this reason, and in the low case holds the dry AI share at 56%, which gives USD 3.91 billion in 2035 instead of USD 4.75 billion.
Roof Space and Noise Limits on Urban Campuses
A dry cooler needs more coil area and more fan airflow per MW than an evaporative tower, and at 1.35 MW of heat rejection per MW of IT load a 100 MW AI hall needs about 27 large-format units. Dense colocation sites in Frankfurt, Dublin or Tokyo often cannot place that many units within noise limits at the site boundary, which is one reason DC Market Insights grows colocation dry cooler spending at 15.06% a year, below the 18.87% of hyperscale and AI campuses.
Where Are the Openings for Data Center Dry Cooler Suppliers?
Two openings stand out: replacement and upgrades worth USD 618.02 million by 2035, and service contracts worth USD 400.57 million by 2035.
Coil and Fan Upgrades on 143,060 MW of Dry-Cooler-Served Capacity
Dry coolers installed in the 2015-2025 build-out reach mid-life in the 2030s, and many were sized for 18-24 °C chilled-water economisers rather than for warmer liquid loops. DC Market Insights values replacement and upgrades at 4% a year of the dry-cooler-served installed base at the conventional price, USD 141.06 million in 2025 rising at 15.92% a year.
Service Contracts Priced Per MW
Service on dry coolers is simpler than on evaporative towers, with no water treatment or Legionella programme, but fan motors, drives and coil cleaning still need contracts. At USD 2,300 per dry-cooler-served MW a year in 2025 and USD 2,800 in 2035, service reaches USD 400.57 million by 2035, a line that facility operators can bundle with the wider operations work described in the Data Center Cooling Market.
How Much Does a Data Center Dry Cooler Cost per MW?
A data center dry cooler cost about USD 205,000 per MW of IT load in an AI hall in 2025 and USD 95,000 in a conventional hall, before 15% for installation (DC Market Insights estimate).
| Price point (per MW of IT load) | 2020 | 2025 | 2030 | 2035 |
|---|---|---|---|---|
| Conventional hall, free-cooling economiser (USD) | 80,000 | 95,000 | 102,000 | 108,000 |
| AI hall, chiller-less liquid loop (USD) | 170,000 | 205,000 | 222,000 | 228,000 |
| Service per dry-cooler-served MW a year (USD) | 2,000 | 2,300 | 2,600 | 2,800 |
The public anchor is the Kelvion order: more than USD 800 million for 5 GW of heat rejection is about USD 160 per kW of rejected heat. AI halls are sized with roughly 1.35 MW of heat rejection per MW of IT load to cover peak ambient days and redundant units, which gives about USD 216,000 per MW of IT in 2027, close to the model’s USD 210,000 for that year. The conventional price is lower because an economiser dry cooler only needs to cover the cold hours, while the chiller handles the rest.
Which Rules and Standards Apply to Data Center Dry Coolers?
Four rule sets shape dry cooler choice, and all of them reward the zero-water figure that a dry cooler reports.
- EU Delegated Regulation 2024/1364 under the Energy Efficiency Directive (EED): data centres of 500 kW or more report water input, energy use and Power Usage Effectiveness (PUE).
- European Commission rating scheme C(2026) 3472, adopted in September 2026: PUE and WUE classes for EU data centres.
- California AB 2469 and AB 2619, signed in September 2026: data centers give local governments and water suppliers information about water use.
- Utah HB 76 (2026): annual water reporting for data centers withdrawing 75 acre-feet or more a year.
- EN 1048:2014, the European test standard for air-cooled liquid coolers: Eurovent Certification rates dry coolers at its SC15 condition under EN 1048:2014 (25 °C inlet air, water cooled from 40 °C to 35 °C), and buyers compare units on those ratings.
Which Dry Cooler Type and Application Lead Data Center Spending?
V-type and A-frame dry coolers lead the Data Center Dry Cooler Market with 50.0% of 2025 value, while chiller-less liquid loops become the leading application by 2035.
By Product Type: V-Type and A-Frame Dry Coolers Lead with 50.0%
| Product type | 2025 (USD million) | Share 2025 | 2035 (USD million) | CAGR 2025-2035 |
|---|---|---|---|---|
| V-Type and A-Frame Dry Coolers | 505.62 | 50.0% | 1,898.13 | 14.14% |
| Flatbed Horizontal Dry Coolers | 283.15 | 28.0% | 854.16 | 11.67% |
| Large-Format Multi-MW Dry Coolers | 222.47 | 22.0% | 1,993.04 | 24.52% |
| Total | 1,011.24 | 100.0% | 4,745.33 | 16.72% |
By Application: Free-Cooling Economisers Lead with 46.0%
| Application | 2025 (USD million) | Share 2025 | 2035 (USD million) | CAGR 2025-2035 |
|---|---|---|---|---|
| Free-Cooling Economisers with Chillers | 465.17 | 46.0% | 1,423.60 | 11.83% |
| Chiller-Less Liquid Cooling Loops | 303.37 | 30.0% | 2,467.57 | 23.32% |
| Chiller Condenser and Trim Loops | 242.70 | 24.0% | 854.16 | 13.41% |
| Total | 1,011.24 | 100.0% | 4,745.33 | 16.72% |
By Data Center Type: Hyperscale and AI Data Centers Lead with 55.0%
| Data center type | 2025 (USD million) | Share 2025 | 2035 (USD million) | CAGR 2025-2035 |
|---|---|---|---|---|
| Hyperscale and AI Data Centers | 556.18 | 55.0% | 3,131.91 | 18.87% |
| Colocation Data Centers | 303.37 | 30.0% | 1,233.79 | 15.06% |
| Enterprise and Edge Data Centers | 151.69 | 15.0% | 379.63 | 9.61% |
| Total | 1,011.24 | 100.0% | 4,745.33 | 16.72% |
By Offering: New-Build Equipment Leads with 67.5%
| Offering | 2025 (USD million) | Share 2025 | 2035 (USD million) | CAGR 2025-2035 |
|---|---|---|---|---|
| New-Build Equipment | 682.43 | 67.5% | 3,240.64 | 16.86% |
| Installation and Commissioning | 102.37 | 10.1% | 486.10 | 16.86% |
| Replacement and Upgrades | 141.06 | 13.9% | 618.02 | 15.92% |
| Service and Maintenance | 85.38 | 8.4% | 400.57 | 16.72% |
| Total | 1,011.24 | 100.0% | 4,745.33 | 16.72% |
DC Exclusive: Mega-Bay Order Teardown — What USD 800 Million of Dry Coolers Buys
This DC Market Insights teardown is modelled from 5 inputs and estimates that the Kelvion order prices AI-hall dry cooling at about USD 216,000 per MW of IT load, or 27 units per 100 MW.
| Teardown line | Value | Basis |
|---|---|---|
| Order value | USD 800 million or more | Kelvion, 7 October 2026 |
| Units | 1,000 or more | Kelvion, deliveries through 2027 |
| Heat rejection | 5 GW, about 5 MW per unit | Kelvion |
| Price per kW of heat rejection | About USD 160 | USD 800 million divided by 5,000,000 kW |
| Price per unit | About USD 0.80 million | USD 800 million divided by 1,000 units |
| Design margin | 1.35 MW of heat rejection per MW of IT | DC Market Insights estimate (peak ambient, N+1 units) |
| Price per MW of IT load | About USD 216,000 | USD 160 per kW × 1,350 kW |
| Units per 100 MW of IT | About 27 | 135 MW of heat rejection divided by 5 MW per unit |
| IT load served by the order | About 3.7 GW | 5 GW divided by 1.35 |
The teardown matters to buyers for two reasons. It confirms that the model’s AI-hall price of USD 205,000 per MW in 2025 and USD 222,000 in 2030 sits on a disclosed transaction rather than on list prices. And it shows how concentrated large-format supply is: about 3.7 GW of IT load from one contract compares with roughly 4.3 GW of dry-cooled AI capacity that DC Market Insights expects to be completed in 2027, so buyers planning 2028 sites need to book fabrication slots early.
Which Region Spends the Most on Data Center Dry Coolers?
North America leads the Data Center Dry Cooler Market with 42.0% of 2025 value, and Latin America is the fastest-growing region at 20.50% a year to 2035.
| Region | 2025 (USD million) | Share 2025 | 2035 (USD million) | CAGR 2025-2035 |
|---|---|---|---|---|
| North America | 424.72 | 42.0% | 1,898.13 | 16.15% |
| Europe | 283.15 | 28.0% | 1,020.25 | 13.68% |
| Asia Pacific | 212.36 | 21.0% | 1,257.51 | 19.47% |
| Middle East and Africa | 50.56 | 5.0% | 308.45 | 19.82% |
| Latin America | 40.45 | 4.0% | 260.99 | 20.50% |
| Total | 1,011.24 | 100.0% | 4,745.33 | 16.72% |
North America Leads with 42.0% Share
North American dry cooler spending reaches USD 1.90 billion by 2035, growing 16.15% a year, because the largest AI campuses are built there; the Kelvion order announced from Catoosa, Oklahoma, serves a United States programme, and a Virginia budget amendment of 2026 asks new data centers in the Eastern Virginia groundwater area to use air or closed-loop cooling.
Europe Holds 28.0% Share
European dry cooler spending reaches USD 1.02 billion by 2035, growing 13.68% a year, because cool climates already made dry free cooling standard and EU Delegated Regulation 2024/1364 makes every site of 500 kW or more report water; Italian and German makers such as LU-VE Group and Güntner supply much of this demand.
Asia Pacific Holds 21.0% Share
Asia Pacific dry cooler spending reaches USD 1.26 billion by 2035, growing 19.47% a year, led by China, Japan, India and Australia; humid tropical hubs such as Singapore still lean on evaporative or chiller-based plant, and Singapore’s Green Mark for Data Centres 2024 scores water use, which favours dry units where the climate allows.
Middle East and Africa Holds 5.0% Share
Middle East and Africa dry cooler spending reaches USD 308.45 million by 2035, growing 19.82% a year, because water scarcity rules out open towers on many Gulf sites; Güntner’s planned regional production facility shows suppliers moving closer to that demand.
Latin America Is the Fastest-Growing Region at 20.50%
Latin American dry cooler spending reaches USD 260.99 million by 2035, growing 20.50% a year, the fastest of any region, as AI campuses in Mexico, Brazil and Chile add capacity; Baltimore Aircoil Company opened its first Latin American plant near Monterrey, Mexico, in 2026, adding local heat rejection supply.
Which Countries Buy the Most Data Center Dry Coolers?
The United States buys the most data center dry coolers, USD 384.27 million in 2025 or 38.0% of global value, and India grows fastest among large countries at 23.79% a year.
| Rank | Country | Region | 2025 (USD million) | 2035 (USD million) | CAGR 2025-2035 |
|---|---|---|---|---|---|
| 1 | United States | North America | 384.27 | 1,684.59 | 15.93% |
| 2 | China | Asia Pacific | 101.12 | 545.71 | 18.36% |
| 3 | Germany | Europe | 55.62 | 213.54 | 14.40% |
| 4 | United Kingdom | Europe | 45.51 | 180.32 | 14.76% |
| 5 | Japan | Asia Pacific | 40.45 | 189.81 | 16.72% |
| 6 | Canada | North America | 40.45 | 213.54 | 18.10% |
| 7 | Ireland | Europe | 30.34 | 104.40 | 13.15% |
| 8 | Netherlands | Europe | 30.34 | 113.89 | 14.14% |
| 9 | India | Asia Pacific | 25.28 | 213.54 | 23.79% |
| 10 | Australia | Asia Pacific | 25.28 | 132.87 | 18.05% |
| 11 | Sweden | Europe | 25.28 | 113.89 | 16.24% |
| 12 | Saudi Arabia | Middle East and Africa | 15.17 | 123.38 | 23.32% |
India grows fastest among the twelve because its AI capacity starts from a small base and many new campuses sit in hot inland states where hybrid designs pair dry coolers with trim chillers. Canada and Sweden grow faster than their regions because cold air lets a dry cooler run without any compressor support for nearly the whole year. Ireland grows slowest, at 13.15% a year, because grid limits around Dublin slow new capacity.
How Could the 2035 Data Center Dry Cooler Forecast Change?
The 2035 Data Center Dry Cooler Market ranges from USD 3.91 billion to USD 5.36 billion across the DC Market Insights scenarios, around a base case of USD 4.75 billion.
| Scenario | Assumption | 2035 (USD million) | CAGR 2025-2035 |
|---|---|---|---|
| Low | Dry share of new AI capacity holds at 55-56% from 2027; prices 5% lower | 3,906.66 | 14.47% |
| Base | Dry share of new AI capacity 60% in 2027, 66% in 2030, 70% in 2035 | 4,745.33 | 16.72% |
| High | Dry share 64% in 2027, 72% in 2030, 78% in 2035; prices 5% higher | 5,355.05 | 18.14% |
The swing factor is chip-side coolant temperature. If accelerator makers raise allowed supply temperatures further, more hot-climate sites can drop trim chillers, pushing toward the high case; if future chips need colder water, chillers return to the loop and the low case applies.
Who Are the Leading Data Center Dry Cooler Companies?
Kelvion leads the Data Center Dry Cooler Market with about 41% of 2026 value, and the top five suppliers hold about 70%, a DC Market Insights estimate based on disclosed orders and revenue.
- Kelvion
- Güntner
- LU-VE Group
- Modine (Airedale)
- Alfa Laval
- Johnson Controls
- Vertiv
- Trane Technologies
- Carrier
- SPX Technologies
- Baltimore Aircoil Company
- EVAPCO
- Thermokey
- Stulz
- Mitsubishi Electric
The basis for the 41% estimate: SLB, which agreed on 31 August 2026 to buy Kelvion for about USD 3.4 billion in cash, says Kelvion’s data center revenue is expected to reach “between $1.2 billion and $1.3 billion in 2026” (SLB); DC Market Insights assumes about 45% of that is waterless dry coolers, or about USD 0.55 billion of a USD 1.34 billion market. Modine, owner of the Airedale brand, said in July 2025 that it has a path to approach USD 2 billion of data center revenue by fiscal 2028, across its full data center thermal range. LU-VE Group and Güntner are the main European coil specialists, and Alfa Laval entered in March 2026.
Recent Developments
Six dated events from February to October 2026 show supply consolidating around large-format units and new factories.
- In October 2026, Kelvion won an order worth more than USD 800 million for over 1,000 Mega-Bay dry coolers with 5 GW of heat rejection, for delivery through 2027 (Source: Kelvion).
- In September 2026, California’s governor signed AB 2469 and AB 2619 on data center water use (Source: Office of the Governor of California).
- In September 2026, the European Commission adopted a data centre rating scheme with PUE and WUE classes (Source: European Commission).
- In August 2026, SLB agreed to acquire Kelvion for about USD 3.4 billion, with closing expected in the first half of 2027 (Source: SLB).
- In March 2026, Alfa Laval launched FreeWaterLoop, an external cooling system for the data center facility loop (Source: Alfa Laval).
- In February 2026, Güntner announced plans for its own production facility in the Middle East (Source: Güntner).
Methodology: How DC Market Insights Sizes the Data Center Dry Cooler Market
DC Market Insights built the Data Center Dry Cooler Market bottom-up from dry-cooler-served MW, equipment per MW and installed-base rates, giving USD 1.01 billion in 2025 and USD 4.75 billion in 2035.
The model in numbers. New data center IT capacity of 6,000 MW in 2020, 12,000 MW in 2025, 22,000 MW in 2030 and 27,000 MW in 2035, with an AI share of 10%, 35%, 60% and 66%, is multiplied by a dry-cooler share (conventional 30%, 34%, 38%, 40%; AI 30%, 50%, 66%, 70%, with 60% in 2027) and by equipment per MW of IT (conventional USD 80,000 to 108,000; AI USD 170,000 to 228,000), linear between anchor years. Installation adds 15% of equipment value. Replacement and upgrades run at 4% a year of the dry-cooler-served installed base, which is 28%, 32%, 40% and 46% of an installed IT base of 80, 116, 196 and 311 GW, valued at the conventional price; service is USD 2,000 to 2,800 per dry-cooler-served MW a year. Product, application, data center type, regional and country splits are DC Market Insights allocations that sum to the total every year, on the capacity path shared by other DC Market Insights data center reports and the DC Market Insights research methodology.
Bound checks. (1) Ceiling: if all 12,000 MW of new 2025 capacity used dry coolers at the AI-hall price, new-build equipment would be USD 2.46 billion, against USD 682.43 million in the model. (2) Ceiling: the USD 1.01 billion dry cooler market equals 4.6% of the USD 21.86 billion data center cooling market that DC Market Insights values for 2025, below the shares of chillers (14.8%) and well inside the total. (3) Floor: the Kelvion order of more than USD 800 million for 2027 deliveries alone sets a minimum for 2027 spending; the model’s USD 1.73 billion for 2027 sits above it, and the implied Kelvion share of about 46% matches a supplier that SLB describes as having data centers as its largest end market.
The chillers that dry coolers often pair with are valued in the Data Center Precision Air Conditioning Market for the air side and the chiller report for the compressor side, so no dollar is counted twice.
Table of contents
- 01Introduction
- 1.1Market Definition
- 1.2Historical Period, Base Year and Forecast Period
- 1.3Report Attributes
- 02Research Methodology
- 2.1The Dry-Cooler-Served MW Model in Numbers
- 2.2Bound Checks: All-Dry Ceiling, Cooling Market Share and Kelvion Order Floor
- 03Executive Summary
- 3.1Market Snapshot, 2025, 2026 and 2035
- 3.2Key Market Statistics
- 3.3Key Takeaways
- 04What Is a Data Center Dry Cooler?
- 4.1Included: Waterless Dry Coolers, Installation, Replacement and Service
- 4.2Excluded: Adiabatic Coolers, Towers, Air-Cooled Chillers and Pumps
- 4.3How the Segments Fit Together
- 05Why Do Data Center Dry Cooler Market Estimates Differ?
- 5.1Adiabatic Coolers and Supplier Portfolios
- 5.2Scope Comparison: What Is In and Out
- 5.3Buyers Inside the Scope
- 06Market Drivers
- 6.1NVIDIA's 45 °C Coolant Lets AI Halls Drop the Chiller
- 6.2A USD 800 Million Order for 5 GW of Heat Rejection
- 6.3Water Reporting Rules Make Waterless Heat Rejection the Default Permit Choice
- 07Market Trends
- 7.1Mega-Bay Units Move Heat Rejection to 5 MW Blocks
- 7.2Heat Transfer Specialists Enter With Facility-Loop Systems
- 7.3Factories Follow Demand Into the Gulf
- 08Market Restraints
- 8.1Hot Climates and Fan Power Keep Chillers in the Loop
- 8.2Roof Space and Noise Limits on Urban Campuses
- 09Market Opportunities
- 9.1Coil and Fan Upgrades on 143,060 MW of Dry-Cooler-Served Capacity
- 9.2Service Contracts Priced Per MW
- 10Pricing Analysis: Data Center Dry Cooler Cost per MW
- 10.1Equipment per MW of IT, 2020-2035
- 10.2Public Anchor: USD 160 per kW of Heat Rejection
- 11Standards and Regulation
- 11.1Delegated Regulation (EU) 2024/1364
- 11.2EU Data Centre Rating Scheme C(2026) 3472
- 11.3California AB 2469 and AB 2619
- 11.4Utah HB 76
- 11.5EN 1048:2014 Dry Cooler Testing
- 12Data Center Dry Cooler Market, By Product Type
- 12.1V-Type and A-Frame Dry Coolers
- 12.2Flatbed Horizontal Dry Coolers
- 12.3Large-Format Multi-MW Dry Coolers
- 13Data Center Dry Cooler Market, By Application
- 13.1Free-Cooling Economisers with Chillers
- 13.2Chiller-Less Liquid Cooling Loops
- 13.3Chiller Condenser and Trim Loops
- 14Data Center Dry Cooler Market, By Data Center Type
- 14.1Hyperscale and AI Data Centers
- 14.2Colocation Data Centers
- 14.3Enterprise and Edge Data Centers
- 15Data Center Dry Cooler Market, By Offering
- 15.1New-Build Equipment
- 15.2Installation and Commissioning
- 15.3Replacement and Upgrades
- 15.4Service and Maintenance
- 16DC Exclusive: Mega-Bay Order Teardown
- 16.1Price per kW, per Unit and per MW of IT
- 16.2Units per 100 MW of IT Load
- 17Regional Insights
- 17.1North America
- 17.2Europe
- 17.3Asia Pacific
- 17.4Middle East and Africa
- 17.5Latin America
- 18Country Analysis
- 18.1United States
- 18.2China
- 18.3Germany
- 18.4United Kingdom
- 18.5Japan
- 18.6Canada
- 18.7Ireland
- 18.8Netherlands
- 18.9India
- 18.10Australia
- 18.11Sweden
- 18.12Saudi Arabia
- 19Forecast Scenarios, 2035
- 19.1Low Case
- 19.2Base Case
- 19.3High Case
- 20Competitive Insights
- 20.1Kelvion
- 20.2Güntner
- 20.3LU-VE Group
- 20.4Modine (Airedale)
- 20.5Alfa Laval
- 20.6Johnson Controls
- 20.7Vertiv
- 20.8Trane Technologies
- 20.9Carrier
- 20.10SPX Technologies
- 20.11Baltimore Aircoil Company
- 20.12EVAPCO
- 20.13Thermokey
- 20.14Stulz
- 20.15Mitsubishi Electric
- 21Recent Developments
- 21.1Dated Events, February to October 2026
- Fig. 1Data Center Dry Cooler Market Size, 2020-2035 (USD Million)
- Table 1Report Attributes
- Table 2Scope Comparison
- Table 3Dry Cooler Price per MW of IT, 2020-2035
- Table 4Market by Product Type, 2025 and 2035
- Table 5Market by Application, 2025 and 2035
- Table 6Market by Data Center Type, 2025 and 2035
- Table 7Market by Offering, 2025 and 2035
- Table 8Mega-Bay Order Teardown
- Table 9Market by Region, 2025 and 2035
- Table 10Top 12 Countries, 2025 and 2035
- Table 11Forecast Scenarios, 2035
About this report
Written by Amit Jain and reviewed by Deepti Agrawal, Senior Editor, Research. Figures are built top-down and bottom-up and reconciled before publication, with 2025 as the base year.
Read our methodologyHow we built this
- Historical period2020-2024
- Base year2025
- Forecast period2026-2035
- Sizing approachTop-down + bottom-up
Need more than the report?
Advisory on this market
Due diligence, site selection and market entry work, by the analysts who wrote this report.
See consulting servicesFrequently asked questions
USD 1.34 billion in 2026, up 32.30% from USD 1.01 billion in 2025, according to DC Market Insights estimates. The market is projected to reach USD 4.75 billion by 2035, a CAGR of 16.72% from 2025.
16.72% a year from 2025 to 2035, after 27.45% a year from 2020 to 2025, because the dry-cooled share of new AI capacity rises from 50% to 70% as 45 °C liquid cooling removes chillers from many AI halls.
USD 1.01 billion of 2025 spending covers waterless fan-coil units that reject data center heat to outdoor air: V-type, flatbed and large-format dry coolers, with installation, replacement and service. Adiabatic coolers, cooling towers and air-cooled chillers are excluded.
50.0% of 2025 value, or USD 505.62 million, goes to V-type and A-frame dry coolers. Large-format multi-MW dry coolers grow fastest at 24.52% a year because hyperscale AI campuses now buy heat rejection in 5 MW units.
Yes for 50% of new AI capacity in 2025 and 70% by 2035 in the DC Market Insights base case. NVIDIA says 45 °C liquid cooling can enable chiller-less operation with dry coolers and no water use.
About USD 205,000 per MW of IT load in an AI hall and USD 95,000 in a conventional hall in 2025, before 15% installation (DC Market Insights estimate). The Kelvion order implies about USD 160 per kW of heat rejection.
0 litres in normal operation: a dry cooler rejects heat through fans and finned coils only. That is why water reporting rules in the EU, California and Utah favour it over evaporative towers, which use about 2.6 million gallons per MW a year.
42.0% of 2025 value, or USD 424.72 million, is spent in North America. Latin America grows fastest at 20.50% a year, and India is the fastest-growing large country at 23.79% a year.
About 41% of 2026 value is held by Kelvion, which won a USD 800 million order for 1,000+ dry coolers in October 2026 (DC Market Insights estimate). Güntner, LU-VE Group, Modine (Airedale), Alfa Laval and Johnson Controls also compete.
USD 1.34 billion in 2026 is the DC Market Insights figure for waterless dry coolers at data centers only. Estimates that add adiabatic coolers, plate heat exchangers or a supplier’s full thermal portfolio are larger.
Licences, delivery and payment
Which licence should I choose?
Single User is a view-only PDF for one person. Multi User adds a printable PDF and the Excel data for unlimited users at one location. Enterprise covers your whole company and includes 100 free analyst hours.
How and when will I receive the report?
By email, within 24–48 business hours of payment, in the formats of your licence.
How can I pay?
Securely through PayPal: with a PayPal account, a debit or credit card, or PayPal Pay Later where available. Prices are in US dollars.
Can I see a sample first?
Yes. Request a free sample and we will email it to you.
Can the report be tailored to my needs?
Yes. We can add countries, segments or data cuts. Talk to an analyst about the scope you need.
Can I get an invoice or pay against a purchase order?
Write to sales@dcmarketinsights.com and our team will help.