
Data Center Chiller Market Size, Share & Forecast to 2035
Market at a glance
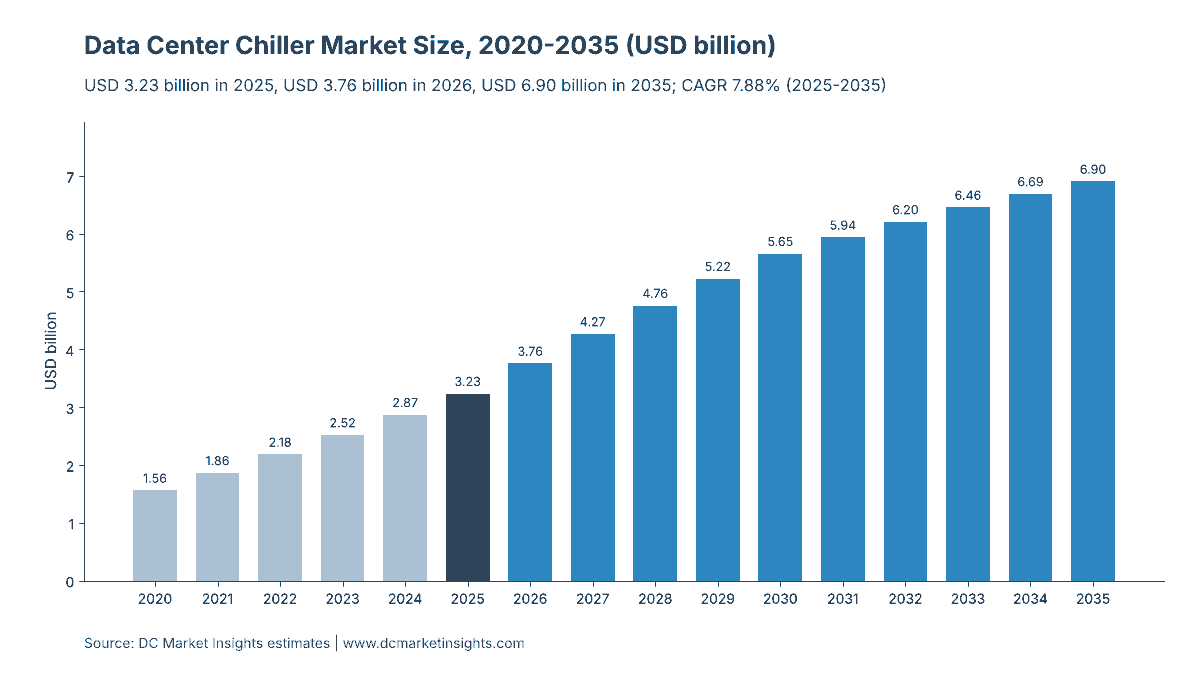
The Data Center Chiller market was worth USD 3,230.0 million in 2025 and is forecast to reach USD 6,900.0 million by 2035, growing at a 7.88% CAGR.
 By Amit Jain, Senior Consultant, ICT & Emerging Technologies
 Reviewed by Deepti Agrawal
Last updated 18 Oct 2026
Base year 2025 PDF + Excel
Reviewed by Deepti Agrawal
Last updated 18 Oct 2026
Base year 2025 PDF + Excel
Key findings
NVIDIA's 45 °C Design Allows Chiller-Free AI Halls
What is inside the report
- 01Introduction
- 02Research Methodology
- 03Executive Summary
- 04What Is a Data Center Chiller?
- 05Why Do Data Center Chiller Market Estimates Differ?
- 06Market Drivers
- 07Market Trends
- 08Market Restraints
- 09Market Opportunities
- 10Pricing Analysis: Data Center Chiller Cost per MW
- 21chapters
- 2020-2024Historical period
- 2026-2035Forecast period
- —Companies profiled
Segmentation
Recent developments
LG Electronics signed a multi-year agreement to supply air-cooled centrifugal chillers for North American data centers totalling more than 5 GW (Source: LG Electronics).
NVIDIA wrote that a 45 °C liquid inlet temperature enables chiller-free dry-cooler operation for Vera Rubin (Source: NVIDIA).
Carrier Global reported data center orders up more than 300% in the second quarter (Source: Carrier Global).
Trane Technologies reported applied equipment bookings up 130% in the second quarter (Source: Trane Technologies).
Trane Technologies completed its acquisition of the liquid cooling company LiquidStack (Source: Trane Technologies).
Johnson Controls launched the 3.5 MW YORK YDAM chiller for multistory data centers (Source: Johnson Controls).
Full analysis
The Data Center Chiller Market is valued at USD 3.76 billion in 2026 and is projected to reach USD 6.90 billion by 2035, up from USD 3.23 billion in 2025, a compound annual growth rate (CAGR) of 7.88% from 2025 to 2035 (DC Market Insights estimate). Chiller demand here is set by two forces pulling in opposite directions: artificial intelligence (AI) campuses are ordering chillers at record pace, with Carrier Global reporting that its data center revenue doubled to USD 1 billion in 2025, while NVIDIA’s Vera Rubin systems are designed for 45 °C liquid inlet water that lets operators run AI halls on dry coolers with no chiller at all. DC Market Insights models that tension through the attach rate: in 2025 about 8,196 megawatts (MW) of the 12,000 MW of new data center IT capacity, or 68.3%, was cooled by chillers, and the share falls to 51.7% of 27,000 MW by 2035 as warm-water designs spread. Each chiller-served MW carries about USD 210,000 of chiller equipment in a conventional hall and USD 260,000 in an AI hall. Air-cooled chillers are the fastest-growing chiller type at 9.21% a year because they need no cooling-tower water, and the Middle East and Africa is the fastest-growing region at 12.35% a year.
Key Market Statistics: How Big Is the Data Center Chiller Market in 2026?
DC Market Insights values the Data Center Chiller Market at USD 3.76 billion in 2026, 16.2% above the USD 3.23 billion of 2025, as AI campus orders booked in 2025 turn into deliveries.
- Market size 2025: USD 3.23 billion
- Market size 2026: USD 3.76 billion
- Market size 2030: USD 5.65 billion
- Market size 2035: USD 6.90 billion
- CAGR 2025-2035: 7.88% in the base case, 5.97% in the low case and 9.65% in the high case
- Chiller-served new IT capacity: 8,196 MW in 2025 (68.3% of new capacity) and 13,959 MW in 2035 (51.7%)
- Largest chiller type: air-cooled chillers, 54.0% of 2025 value (USD 1.75 billion)
- Largest compressor type: centrifugal chillers, 45.0% of 2025 value, growing 9.66% a year
- Fastest-growing offering: service and maintenance, 10.36% a year
- Leading region: North America, 42.0% of 2025 value (USD 1.36 billion)
- Fastest-growing region: Middle East and Africa, 12.35% a year
- Largest country: the United States, USD 1.20 billion in 2025 (37.0% of global value)
- Market leaders: Trane Technologies, Johnson Controls, Carrier Global, Daikin Industries and Vertiv, about 55% of 2025 value together (DC Market Insights assessment)
Executive Summary
The Global Data Center Chiller Market size was valued at USD 1.56 billion in 2020, reached USD 3.23 billion in 2025, and is anticipated to reach USD 6.90 billion by 2035, at a CAGR of 7.88% during the forecast period.
| Report attribute | Details |
|---|---|
| Historical Period | 2020-2024 |
| Base Year | 2025 |
| Forecast Period | 2026-2035 |
| Data Center Chiller Market Size 2025 | USD 3.23 Billion |
| Data Center Chiller Market Size 2026 | USD 3.76 Billion |
| Data Center Chiller Market, CAGR | 7.88% |
| Data Center Chiller Market Size 2035 | USD 6.90 Billion |
Spending grew 15.69% a year between 2020 and 2025, when new data center IT capacity doubled from 6,000 MW to 12,000 MW a year and AI halls, which still used chillers on 80% of their capacity, rose from 10% to 35% of new builds. Growth slows to 7.88% a year to 2035 for a specific reason: new IT capacity keeps rising to 27,000 MW a year, but the chiller attach rate in AI halls falls from 80% to 50% as 45 °C warm-water liquid cooling removes the compressor from part of the cooling plant. The installed base cushions that shift. Replacement chillers on an ageing, chiller-served fleet of 64,960 MW in 2025 and 149,280 MW in 2035, together with service contracts, rise from 31.0% of the market in 2025 to 37.5% in 2035.
Key Takeaways
- The market grows from USD 3.23 billion in 2025 to USD 6.90 billion in 2035 because new data center capacity rises 2.25 times, even though a smaller share of it uses chillers.
- AI halls already account for 46.2% of 2025 new-build chiller equipment, because liquid-cooled racks at 30 °C to 35 °C supply still need chilled water for the air side and for warm days.
- Warm-water cooling at 45 °C is the largest downside risk, because it cuts chiller content in an AI hall from about USD 260,000 to USD 95,000 per MW or to zero.
- Refrigerant rules in the United States and the European Union turn the installed base into a replacement market worth USD 1.55 billion in 2035, because older high-GWP units cannot be serviced indefinitely.
- Air-cooled chillers gain share, from 54.0% to 61.0%, because water-scarce sites and the multistory campuses of hyperscale operators avoid cooling towers.
What Is a Data Center Chiller, and What Does the Market Include?
A data center chiller is a vapour-compression machine that removes heat from the chilled-water loop serving a data hall, and DC Market Insights values the chillers, their installation and their service sold to data centers at USD 3.23 billion in 2025.
Included. Air-cooled and water-cooled chillers with centrifugal (including oil-free magnetic-bearing), screw and scroll compressors; free-cooling (economiser) and adiabatic-assisted chillers; trim chillers that support warm-water liquid cooling loops; installation and commissioning; replacement of chillers in operating data centers; and maintenance and repair contracts on the chiller-served installed base.
Excluded. Computer room air handlers (CRAH) and other air-side precision units (see the Data Center Precision Air Conditioning Market), coolant distribution units (CDU) for direct-to-chip loops (see the Data Center Coolant Distribution Units Market), refrigerant sold separately (see the Data Center Refrigerant Market), stand-alone cooling towers, dry coolers and pumps, chilled-water piping, building management software, comfort-cooling chillers in office buildings, and the electricity that chillers consume.
How the segments fit together. Every dollar is classified once by chiller type (air-cooled or water-cooled), once by compressor (centrifugal, screw or scroll), once by data center type and once by offering (new-build equipment, installation and commissioning, replacement chillers, service and maintenance). Each dimension sums to the market total in every year.
Why Do Data Center Chiller Market Estimates Differ?
Estimates differ because of scope: DC Market Insights counts USD 3.76 billion in 2026 for chillers, their installation and service at data centers only, while broader definitions fold in the whole chilled-water plant or every cooling product.
Broader estimates often add cooling towers, dry coolers, pumps and piping, which together can match the chiller itself in value on a water-cooled plant; they may also include air-side precision units, coolant distribution units, liquid cooling and comfort-cooling chillers sold to commercial buildings. The DC Market Insights Data Center Cooling Market report, which covers every cooling product, values that wider market at USD 21.86 billion in 2025, so chillers as defined here are about 14.8% of total data center cooling spend.
| Element | In DC Market Insights scope | Why |
|---|---|---|
| Chillers (air-cooled and water-cooled) | Yes, USD 1.89 billion new-build equipment in 2025 | The core product |
| Installation and commissioning | Yes, USD 340.05 million | Sold with the chiller in most data center contracts |
| Replacement chillers | Yes, USD 613.87 million | Driven by age and refrigerant rules |
| Service and maintenance | Yes, USD 389.76 million | Recurring revenue on the installed base |
| Cooling towers, dry coolers, pumps, piping | No | Separate heat-rejection and mechanical scope |
| CRAH units, fan walls, CDUs | No | Covered in sibling DC Market Insights reports |
| Comfort-cooling chillers in offices | No | Not data center demand |
Out of scope, in plain words: cooling towers, dry coolers, chilled-water pumps and piping, computer room air handlers, coolant distribution units, immersion and direct-to-chip liquid cooling hardware, refrigerant sold on its own, building automation software and comfort-cooling chillers. In scope are all data center buyers, from hyperscale and AI campus operators to colocation providers, enterprises, government agencies and small and medium-sized enterprises (SMEs) that run their own server rooms with packaged scroll chillers.
What Is Driving Data Center Chiller Demand?
Three market-specific forces lift data center chiller spending from USD 3.23 billion in 2025 to USD 6.90 billion in 2035: record AI campus orders at the large heating, ventilation and air-conditioning (HVAC) makers, larger air-cooled chillers for multistory halls, and refrigerant rules that force older units out.
Carrier’s Data Center Revenue Doubled to USD 1 Billion in 2025
Carrier Global said in its 2025 annual report that it doubled its global data center revenue to USD 1 billion in 2025 and set up the business for about 50% growth in 2026; in July 2026 it reported that data center orders were up more than 300% in the second quarter. Trane Technologies reported applied equipment bookings, the category that holds large chillers, up more than 120% in the fourth quarter of 2025 and up 130% in the second quarter of 2026, according to its earnings releases. Johnson Controls said in July 2026 that orders rose 27% organically and that its backlog reached USD 21.0 billion, with demand from data centers named as a driver. DC Market Insights reads these orders as the 2026 step-up in its model: new-build chiller equipment rises from USD 1.89 billion in 2025 to USD 2.21 billion in 2026.
Air-Cooled Units Grow from 1.75 MW to 3.5 MW for Multistory Halls
Chiller makers have enlarged air-cooled units because multistory AI campuses have little roof and yard area per MW. Johnson Controls launched the YORK YDAM in February 2026 with 3.5 MW of cooling and up to 20% more capacity density, shipping from late 2026; Vertiv extended its Liebert AFC free-cooling screw chillers to 2.2 MW per frame in October 2024; and Mitsubishi Electric sells 350-ton (1.2 MW) and 500-ton (1.75 MW) magnetic-bearing air-cooled models for United States data centers, according to the companies. LG Electronics said in October 2026 that it signed a multi-year agreement to supply air-cooled centrifugal chillers for North American data centers totalling more than 5 gigawatts (GW). Air-cooled chillers therefore grow 9.21% a year in the DC Market Insights model, against 6.12% for water-cooled units.
Refrigerant Limits of 700 and 750 GWP Retire Older Chillers
The United States Environmental Protection Agency (EPA) set a global warming potential (GWP) limit of 700 for new comfort-cooling chillers from 1 January 2025 under its Technology Transitions rule, and the European Union’s F-gas Regulation (EU) 2024/573, in force since 11 March 2024, bans new chillers above 12 kW that use refrigerants with a GWP of 750 or more from 1 January 2027, according to the European Commission. Older data center chillers charged with R-134a (GWP 1,430) or R-410A (GWP 2,088) remain legal to run but become costlier to service as hydrofluorocarbon (HFC) supply is phased down. DC Market Insights applies a 4.5% annual replacement rate to the chiller-served installed base, which lifts replacement chillers from USD 613.87 million in 2025 to USD 1.55 billion in 2035, a 9.67% CAGR.
How Is Data Center Chiller Technology Changing?
Three changes reshape the USD 3.76 billion market of 2026: oil-free magnetic-bearing compressors, chiller makers buying liquid cooling specialists, and Asian manufacturers entering North America.
Magnetic-Bearing Centrifugal Compressors Move Into Air-Cooled Chillers
Oil-free magnetic-bearing centrifugal compressors, once used mainly in water-cooled plants, now appear in air-cooled data center chillers: Johnson Controls launched the YORK YVAM air-cooled magnetic-bearing chiller for hyperscale and colocation facilities in March 2025, claiming about 40% lower annual power use, and Mitsubishi Electric’s MECH-iC range uses the same design. Centrifugal chillers hold 45.0% of 2025 value (USD 1.45 billion) and grow 9.66% a year, the fastest compressor type.
Chiller Makers Buy Liquid Cooling Companies
The largest chiller suppliers are hedging against chiller-less AI halls by buying liquid cooling businesses. Trane Technologies completed its acquisition of LiquidStack, a data center liquid cooling company, on 3 March 2026, and Daikin Applied bought the direct-to-chip specialist Chilldyne in November 2025 after acquiring DDC Solutions in August 2025, according to the companies. These deals let a supplier keep the cooling budget of an AI hall whether the hall uses a chiller or not, and they explain why DC Market Insights expects chiller prices per MW to keep rising only slowly, from USD 260,000 to USD 280,000 per AI MW between 2025 and 2035.
Daikin Plans JPY 300 Billion of Data Center Cooling Sales by 2030
Daikin Industries told investors in November 2025 that its North American data center cooling business grew from about JPY 23 billion in 2023 to about JPY 100 billion in 2025 and that it targets JPY 300 billion or more by 2030, with chillers and air handlers expected to make up 70% to 80% of those sales. LG Electronics reported first-half 2026 data center cooling orders above USD 428 million. Rising competition from Japanese and Korean makers is one reason DC Market Insights holds chiller equipment prices to a 0.9% annual increase after 2025.
Market Restraints: What Could Slow Data Center Chiller Spending?
Two restraints cut the 2035 market by up to USD 1.13 billion in the DC Market Insights low case: warm-water liquid cooling that removes chillers from AI halls, and efficiency caps that push operators toward free cooling.
NVIDIA’s 45 °C Design Allows Chiller-Free AI Halls
NVIDIA wrote in July 2026 that a 45-degree Celsius liquid cooling inlet temperature design enables chiller-free dry-cooler operation for its Vera Rubin systems, repeating a point its chief executive made at CES in January 2026; in June 2026 it described Rubin as its first generation with 100% liquid cooling. If every AI hall adopted that design, chiller content per AI MW would fall from about USD 260,000 to zero. DC Market Insights assumes a partial shift: the AI-hall attach rate falls from 80% in 2025 to 62% in 2030 and 50% in 2035. At 35% in 2035, the low case, the market reaches USD 5.77 billion instead of USD 6.90 billion.
Power Usage Effectiveness Caps of 1.25 Favour Free Cooling
China’s National Development and Reform Commission (NDRC) and Ministry of Industry and Information Technology (MIIT) required new and expanded large data centers to reach a power usage effectiveness (PUE) of 1.25 or lower by the end of 2025, and Singapore’s Economic Development Board (EDB) set a PUE of 1.25 at full IT load for capacity awarded under its second data centre call for application in December 2025, according to the two governments. Low PUE targets reward economiser hours and higher water temperatures, which shrink compressor run time and, in cool climates, chiller size. The International Energy Agency (IEA) puts cooling at about 7% of electricity use in efficient hyperscale data centers and over 30% in less efficient enterprise sites, so the gap between the two is what regulators are targeting. Enterprise and edge data centers grow only 1.72% a year in the model as their server rooms consolidate into colocation and cloud.
Where Are the Growth Opportunities in Data Center Chillers?
The two largest openings are replacement chillers, worth USD 1.55 billion in 2035, and chiller service contracts, worth USD 1.04 billion in 2035, both tied to an installed base that more than doubles.
Replacement Chillers: 22.4% of 2035 Value
Replacement chillers reach USD 1.55 billion in 2035, 22.4% of the market, up from 19.0% in 2025, because the chiller-served installed base grows from 64,960 MW to 149,280 MW and refrigerant rules shorten the economic life of high-GWP units. Suppliers with low-GWP drop-in designs, such as the R-1234ze units Vertiv offers, are best placed for this retrofit demand, which DC Market Insights models at 4.5% of the chiller-served base a year.
Chiller Service and Maintenance: 10.36% a Year
Service and maintenance is the fastest-growing offering at 10.36% a year, from USD 389.76 million in 2025, as the service rate per chiller-served MW rises from USD 6,000 to USD 7,000 a year and AI operators buy uptime-based contracts. Johnson Controls’ USD 21.0 billion backlog at July 2026 and Trane’s USD 7.8 billion enterprise backlog at the end of 2025, both partly service, show how much recurring work the large suppliers already hold.
How Much Does a Data Center Chiller Cost per MW?
DC Market Insights estimates chiller equipment at about USD 210,000 per MW of IT load in a conventional hall and USD 260,000 per MW in an AI hall in 2025, or about USD 616 and USD 703 per ton of cooling, before installation at 18% of equipment value.
| Year | Conventional hall (USD per MW of IT) | AI hall (USD per MW of IT) | Conventional (USD per ton of cooling) | Service (USD per chiller-served MW a year) |
|---|---|---|---|---|
| 2020 | 190,000 | 240,000 | 557 | 5,000 |
| 2025 | 210,000 | 260,000 | 616 | 6,000 |
| 2030 | 222,000 | 272,000 | 651 | 6,600 |
| 2035 | 230,000 | 280,000 | 674 | 7,000 |
The per-ton figures assume 1.2 MW of chiller capacity per MW of IT in a conventional hall (redundant N+1 units) and 284.3 tons of refrigeration per MW. Public anchors are scarce because chillers are sold in project bids. The United States Federal Energy Management Program (FEMP) sets minimum efficiencies for federal purchases of 0.501 kilowatts (kW) per ton at full load for water-cooled centrifugal chillers of 600 tons or more, and it calculates that an efficient 300-ton water-cooled centrifugal chiller still saves money if it costs up to USD 128,037 more than a less efficient model over its life. That premium, about USD 427 per ton, shows why data center buyers pay more for magnetic-bearing and free-cooling designs.
Which Rules and Standards Shape Data Center Chillers?
Seven rules and standards decide which chillers can be sold into a USD 3.76 billion market in 2026, from refrigerant bans to efficiency reporting.
- AHRI Standard 550/590 (2023): the Air-Conditioning, Heating, and Refrigeration Institute (AHRI) rating standard for water-chilling packages, used to certify full-load and integrated part-load efficiency.
- ANSI/ASHRAE Standard 90.4-2025: the Energy Standard for Data Centers of the American Society of Heating, Refrigerating and Air-Conditioning Engineers (ASHRAE), which sets mechanical load components that chiller plants must meet.
- US EPA Technology Transitions rule: GWP limit of 700 for new comfort-cooling chillers from 1 January 2025 and for process chillers from 1 January 2026.
- Regulation (EU) 2024/573 (F-gas): the fluorinated greenhouse gases regulation, in force 11 March 2024; bans new chillers above 12 kW using refrigerants with a GWP of 750 or more from 1 January 2027.
- Delegated Regulation (EU) 2024/1364: data centers with at least 500 kW of IT power report PUE, water use, refrigerant types and waste-heat data each year under the Energy Efficiency Directive (EED); the European Commission proposed a rating scheme in September 2026.
- China NDRC and MIIT action plan (July 2024): PUE of 1.25 or lower for new and expanded large data centers by the end of 2025.
- Singapore SS 697:2023 and DC-CFA2: the tropical data centre standard supports operation at 26 °C and above, with 2% to 5% cooling energy savings per 1 °C, according to the Infocomm Media Development Authority (IMDA), and new capacity must reach a PUE of 1.25.
Which Segment Leads the Data Center Chiller Market?
Air-cooled chillers lead with 54.0% of 2025 value, centrifugal compressors with 45.0%, hyperscale and AI data centers with 50.0% and new-build equipment with 58.4%, in a market worth USD 3.23 billion in 2025.
By Chiller Type: Air-Cooled Chillers Lead with 54.0%
Air-cooled chillers take USD 1.75 billion of 2025 value and grow 9.21% a year, because they need no cooling-tower make-up water; water-cooled chillers keep a place in the largest single-storey campuses and hot climates where their lower kW per ton matters most.
| Chiller Type | 2025 (USD million) | Share 2025 | 2035 (USD million) | CAGR 2025-2035 |
|---|---|---|---|---|
| Air-Cooled Chillers | 1,745.73 | 54.0% | 4,211.54 | 9.21% |
| Water-Cooled Chillers | 1,487.11 | 46.0% | 2,692.63 | 6.12% |
By Compressor: Centrifugal Chillers Lead with 45.0%
Centrifugal chillers, including oil-free magnetic-bearing units, are worth USD 1.45 billion in 2025 and rise to 53.0% of value by 2035 as unit sizes pass 1.5 MW; screw chillers stay strong in free-cooling designs, and scroll chillers serve small enterprise and edge rooms.
| Compressor | 2025 (USD million) | Share 2025 | 2035 (USD million) | CAGR 2025-2035 |
|---|---|---|---|---|
| Centrifugal Chillers | 1,454.78 | 45.0% | 3,659.21 | 9.66% |
| Screw Chillers | 1,390.12 | 43.0% | 2,623.58 | 6.56% |
| Scroll Chillers | 387.94 | 12.0% | 621.38 | 4.82% |
By Data Center Type: Hyperscale and AI Data Centers Lead with 50.0%
Hyperscale and AI campuses spend USD 1.62 billion on chillers in 2025 and grow 10.05% a year, the fastest data center type, even with lower attach rates, because they add most of the new capacity.
| Data Center Type | 2025 (USD million) | Share 2025 | 2035 (USD million) | CAGR 2025-2035 |
|---|---|---|---|---|
| Hyperscale and AI Data Centers | 1,616.42 | 50.0% | 4,211.54 | 10.05% |
| Colocation Data Centers | 1,034.51 | 32.0% | 2,002.21 | 6.83% |
| Enterprise and Edge Data Centers | 581.91 | 18.0% | 690.42 | 1.72% |
By Offering: New-Build Chiller Equipment Leads with 58.4%
New-build chiller equipment is worth USD 1.89 billion in 2025; service and maintenance grows fastest at 10.36% a year as the chiller-served fleet more than doubles.
| Offering | 2025 (USD million) | Share 2025 | 2035 (USD million) | CAGR 2025-2035 |
|---|---|---|---|---|
| New-Build Chiller Equipment | 1,889.16 | 58.4% | 3,656.07 | 6.83% |
| Installation and Commissioning | 340.05 | 10.5% | 658.09 | 6.83% |
| Replacement Chillers | 613.87 | 19.0% | 1,545.05 | 9.67% |
| Service and Maintenance | 389.76 | 12.1% | 1,044.96 | 10.36% |
DC Exclusive: AI Hall Chiller Content Teardown, USD 0 to USD 260,000 per MW by Cooling Design
This DC Market Insights teardown is modelled from 12 inputs and estimates how much chiller equipment, installation and service each MW of IT load carries under five cooling designs in 2025; it shows why the shift to warm-water liquid cooling, not the number of new data centers, is the swing factor in this market.
| Hall cooling design | Chiller capacity per MW of IT (MW) | Chiller equipment per MW of IT (USD) | Installation per MW of IT (USD) | Service per MW of IT a year (USD) |
|---|---|---|---|---|
| Air-cooled conventional hall, mechanical cooling all year | 1.20 | 210,000 | 37,800 | 4,500 |
| Conventional hall with economiser (free-cooling) chiller | 1.20 | 230,000 | 41,400 | 4,000 |
| AI hall, liquid cooling at 30-35 °C supply plus air-side chiller | 1.30 | 260,000 | 46,800 | 6,000 |
| AI hall, 45 °C warm-water liquid loop with trim chiller for the air side | 0.35 | 95,000 | 17,100 | 2,000 |
| AI hall, 45 °C warm-water with dry coolers only (chiller-less) | 0.00 | 0 | 0 | 0 |
Three points stand out. First, an AI hall with liquid cooling at 30 °C to 35 °C supply carries the most chiller content, about USD 260,000 per MW, because its chillers must cover peak days and the air-side load as well as the liquid loop. Second, moving the same hall to a 45 °C water loop with a small trim chiller cuts chiller equipment by about USD 165,000 per MW, or 63%. Third, a fully chiller-less hall removes the chiller budget altogether, which is why DC Market Insights keeps a 50% AI attach rate in 2035 rather than assuming chiller-free designs win everywhere: hot and humid sites such as Singapore, Riyadh and Mumbai, where 45 °C water is hard to reject with dry coolers on summer days, still need chillers.
Which Region Buys the Most Data Center Chillers?
North America leads with 42.0% of 2025 value (USD 1.36 billion), and the Middle East and Africa is the fastest-growing region at 12.35% a year.
| Region | 2025 (USD million) | Share 2025 | 2035 (USD million) | CAGR 2025-2035 |
|---|---|---|---|---|
| North America | 1,357.79 | 42.0% | 2,727.14 | 7.22% |
| Europe | 646.57 | 20.0% | 1,139.19 | 5.83% |
| Asia Pacific | 969.85 | 30.0% | 2,243.86 | 8.75% |
| Latin America | 96.99 | 3.0% | 276.17 | 11.03% |
| Middle East and Africa | 161.64 | 5.0% | 517.81 | 12.35% |
North America Leads with 42.0% Share
North America spends USD 1.36 billion on data center chillers in 2025 and USD 2.73 billion in 2035, growing 7.22% a year. The region holds the largest AI campus pipeline and the deepest supplier base: Carrier, Trane and Johnson Controls all reported data-center-led order growth in 2026, and LG Electronics’ more than 5 GW supply programme targets the United States and Canada.
Asia Pacific Holds 30.0% Share
Asia Pacific is worth USD 969.85 million in 2025, growing 8.75% a year to USD 2.24 billion. China’s 1.25 PUE cap for large new data centers favours free-cooling chillers, while India grows 13.54% a year, the fastest of the region’s large countries.
Europe Holds 20.0% Share
Europe spends USD 646.57 million in 2025 and grows 5.83% a year, the slowest region, because cool northern climates allow long economiser hours. The F-gas ban on new chillers with a GWP of 750 or more from January 2027 brings a replacement wave on existing sites.
Middle East and Africa Holds 5.0% Share
The Middle East and Africa is worth USD 161.64 million in 2025 and is the fastest-growing region at 12.35% a year, reaching USD 517.81 million in 2035. Gulf summer temperatures above 45 °C make chiller-free cooling impractical, so AI campuses in Saudi Arabia and the United Arab Emirates keep attach rates near conventional levels.
Latin America Holds 3.0% Share
Latin America spends USD 96.99 million in 2025 and grows 11.03% a year, led by Brazil and Mexico, where hyperscale campuses around São Paulo and Querétaro use air-cooled chillers to limit water use.
Which Countries Spend the Most on Data Center Chillers?
The United States leads with USD 1.20 billion in 2025, 37.0% of global value, and Saudi Arabia is the fastest-growing of the 12 largest countries at 14.83% a year.
| Rank | Country | Region | 2025 (USD million) | Share 2025 | 2035 (USD million) | CAGR 2025-2035 |
|---|---|---|---|---|---|---|
| 1 | United States | North America | 1,196.15 | 37.0% | 2,381.94 | 7.13% |
| 2 | China | Asia Pacific | 452.60 | 14.0% | 897.54 | 7.09% |
| 3 | Japan | Asia Pacific | 145.48 | 4.5% | 310.69 | 7.88% |
| 4 | Germany | Europe | 145.48 | 4.5% | 262.36 | 6.07% |
| 5 | United Kingdom | Europe | 129.31 | 4.0% | 227.84 | 5.83% |
| 6 | India | Asia Pacific | 96.99 | 3.0% | 345.21 | 13.54% |
| 7 | Australia | Asia Pacific | 80.82 | 2.5% | 186.41 | 8.72% |
| 8 | France | Europe | 74.36 | 2.3% | 138.08 | 6.39% |
| 9 | South Korea | Asia Pacific | 64.66 | 2.0% | 151.89 | 8.92% |
| 10 | Brazil | Latin America | 51.73 | 1.6% | 138.08 | 10.32% |
| 11 | Saudi Arabia | Middle East and Africa | 48.49 | 1.5% | 193.32 | 14.83% |
| 12 | Singapore | Asia Pacific | 45.26 | 1.4% | 69.04 | 4.31% |
India is the fastest-growing large market at 13.54% a year, rising from USD 96.99 million to USD 345.21 million, because its new capacity is concentrated in hot coastal hubs such as Mumbai and Chennai where chillers remain standard. Singapore grows slowest at 4.31% a year because its capacity release is capped and its tropical standard pushes operators toward warmer set points.
How Could the 2035 Data Center Chiller Forecast Change?
The 2035 value ranges from USD 5.77 billion to USD 8.12 billion around a base case of USD 6.90 billion, depending mainly on how many AI halls adopt chiller-free 45 °C cooling.
| Scenario | AI-hall chiller attach rate 2035 | Chiller price vs base | 2035 value (USD million) | CAGR 2025-2035 |
|---|---|---|---|---|
| Low | 35% | -5% | 5,772.21 | 5.97% |
| Base | 50% | 0% | 6,904.17 | 7.88% |
| High | 65% | +5% | 8,124.45 | 9.65% |
The low case assumes warm-water designs spread quickly beyond NVIDIA reference builds and price competition from Asian makers; the high case assumes hot-climate AI campuses and air-side loads keep two thirds of AI capacity on chillers.
Who Are the Leading Data Center Chiller Companies?
Trane Technologies, Johnson Controls, Carrier Global, Daikin Industries and Vertiv together hold about 55% of the USD 3.23 billion market in 2025, a DC Market Insights estimate based on disclosed data center revenue and order trends.
- Trane Technologies
- Johnson Controls (YORK)
- Carrier Global
- Daikin Industries (Daikin Applied)
- Vertiv
- Mitsubishi Electric (including the former Climaveneta and RC brands)
- LG Electronics
- Modine (including Airedale)
- STULZ
- Midea Group
- Gree Electric Appliances
- Schneider Electric
- Smardt Chiller Group
- Mitsubishi Heavy Industries
The basis for the 55% estimate: Carrier disclosed USD 1 billion of data center revenue in 2025 across all its data center products, Daikin disclosed about JPY 100 billion of North American data center cooling sales, and Modine said its data center sales rose 158% in the quarter to March 2026 and guided 60% to 80% growth for the year to March 2027. Trane and Johnson Controls do not break out data center revenue but reported the strongest applied-equipment order growth in the group. DC Market Insights assigns roughly half of each supplier’s data center revenue to chillers, with the rest in air handlers, CDUs and controls.
Recent Developments
- In October 2026, LG Electronics signed a multi-year agreement to supply air-cooled centrifugal chillers for North American data centers totalling more than 5 GW (Source: LG Electronics).
- In July 2026, NVIDIA wrote that a 45 °C liquid inlet temperature enables chiller-free dry-cooler operation for Vera Rubin (Source: NVIDIA).
- In July 2026, Carrier Global reported data center orders up more than 300% in the second quarter (Source: Carrier Global).
- In July 2026, Trane Technologies reported applied equipment bookings up 130% in the second quarter (Source: Trane Technologies).
- In March 2026, Trane Technologies completed its acquisition of the liquid cooling company LiquidStack (Source: Trane Technologies).
- In February 2026, Johnson Controls launched the 3.5 MW YORK YDAM chiller for multistory data centers (Source: Johnson Controls).
Methodology: How DC Market Insights Sizes the Data Center Chiller Market
DC Market Insights built the Data Center Chiller Market bottom-up from chiller-served MW, chiller content per MW and service per installed MW, giving USD 3.23 billion in 2025 and USD 6.90 billion in 2035.
The model in numbers. New data center IT capacity of 6,000 MW in 2020, 12,000 MW in 2025, 22,000 MW in 2030 and 27,000 MW in 2035, with an AI share of 10%, 35%, 60% and 66%, is multiplied by a chiller attach rate (conventional 65%, 62%, 58%, 55%; AI 85%, 80%, 62%, 50%) and by chiller equipment per MW of IT (conventional USD 190,000 to 230,000; AI USD 240,000 to 280,000), linear between anchor years. Installation adds 18% of equipment value. Replacement runs at 4.5% a year of the chiller-served installed base, which is 58%, 56%, 52% and 48% of an installed IT base of 80, 116, 196 and 311 GW, valued at the conventional price; service is USD 5,000 to 7,000 per chiller-served MW a year. Chiller type, compressor, data center type, regional and country splits are DC Market Insights allocations that sum to the total every year, using the capacity path shared by other DC Market Insights data center reports and following the DC Market Insights research methodology.
Bound checks. (1) Ceiling: Daikin sized all data center cooling at about JPY 1.1 trillion in 2025, about USD 7.3 billion at JPY 150 per US dollar; the chiller market of USD 3.23 billion is 44% of it, below the 70% to 80% share that Daikin expects chillers and air handlers together to hold in its own sales. (2) Ceiling: if every MW of new 2025 capacity used chillers at the AI-hall price, new-build equipment would be USD 3.12 billion, against USD 1.89 billion in the model. (3) Floor: Carrier’s USD 1 billion and Daikin’s roughly USD 0.67 billion of disclosed data center cooling revenue, with half assigned to chillers, give about USD 0.83 billion from two suppliers alone, well below the model total and consistent with a five-supplier share of about 55%.
Table of contents
- 01Introduction
- 1.1Market Definition
- 1.2Historical Period, Base Year and Forecast Period
- 1.3Report Attributes
- 02Research Methodology
- 2.1The Chiller-Served MW Model in Numbers
- 2.2Bound Checks: Daikin Market Ceiling, New-Capacity Ceiling and Disclosed-Revenue Floor
- 03Executive Summary
- 3.1Market Snapshot, 2025, 2026 and 2035
- 3.2Key Market Statistics
- 3.3Key Takeaways
- 04What Is a Data Center Chiller?
- 4.1Included: Chillers, Installation, Replacement and Service
- 4.2Excluded: Cooling Towers, CRAH Units, CDUs, Pumps and Refrigerant
- 4.3How the Segments Fit Together
- 05Why Do Data Center Chiller Market Estimates Differ?
- 5.1Chillers Versus the Whole Cooling Plant
- 5.2Scope Comparison: What Is In and Out
- 5.3Buyers Inside the Scope
- 06Market Drivers
- 6.1Carrier's Data Center Revenue Doubled to USD 1 Billion in 2025
- 6.2Air-Cooled Units Grow from 1.75 MW to 3.5 MW for Multistory Halls
- 6.3Refrigerant Limits of 700 and 750 GWP Retire Older Chillers
- 07Market Trends
- 7.1Magnetic-Bearing Centrifugal Compressors Move Into Air-Cooled Chillers
- 7.2Chiller Makers Buy Liquid Cooling Companies
- 7.3Daikin Plans JPY 300 Billion of Data Center Cooling Sales by 2030
- 08Market Restraints
- 8.1NVIDIA's 45 °C Design Allows Chiller-Free AI Halls
- 8.2Power Usage Effectiveness Caps of 1.25 Favour Free Cooling
- 09Market Opportunities
- 9.1Replacement Chillers: 22.4% of 2035 Value
- 9.2Chiller Service and Maintenance: 10.36% a Year
- 10Pricing Analysis: Data Center Chiller Cost per MW
- 10.1Chiller Equipment per MW of IT, 2020-2035
- 10.2Cost per Ton of Cooling
- 10.3Public Anchors: FEMP Efficiency Minimums and Cost Premium
- 11Standards and Regulation
- 11.1AHRI Standard 550/590
- 11.2ANSI/ASHRAE Standard 90.4-2025
- 11.3US EPA Technology Transitions Rule
- 11.4Regulation (EU) 2024/573 (F-gas)
- 11.5Delegated Regulation (EU) 2024/1364
- 11.6China NDRC and MIIT PUE Action Plan
- 11.7Singapore SS 697:2023 and DC-CFA2
- 12Data Center Chiller Market, By Chiller Type
- 12.1Air-Cooled Chillers
- 12.2Water-Cooled Chillers
- 13Data Center Chiller Market, By Compressor
- 13.1Centrifugal Chillers
- 13.2Screw Chillers
- 13.3Scroll Chillers
- 14Data Center Chiller Market, By Data Center Type
- 14.1Hyperscale and AI Data Centers
- 14.2Colocation Data Centers
- 14.3Enterprise and Edge Data Centers
- 15Data Center Chiller Market, By Offering
- 15.1New-Build Chiller Equipment
- 15.2Installation and Commissioning
- 15.3Replacement Chillers
- 15.4Service and Maintenance
- 16DC Exclusive: AI Hall Chiller Content Teardown
- 16.1Air-cooled conventional hall, mechanical cooling all year
- 16.2Conventional hall with economiser (free-cooling) chiller
- 16.3AI hall, liquid cooling at 30-35 °C supply plus air-side chiller
- 16.4AI hall, 45 °C warm-water liquid loop with trim chiller for the air side
- 16.5AI hall, 45 °C warm-water with dry coolers only (chiller-less)
- 17Regional Analysis
- 17.1North America
- 17.2Europe
- 17.3Asia Pacific
- 17.4Latin America
- 17.5Middle East and Africa
- 18Country Analysis
- 18.1United States
- 18.2China
- 18.3Japan
- 18.4Germany
- 18.5United Kingdom
- 18.6India
- 18.7Australia
- 18.8France
- 18.9South Korea
- 18.10Brazil
- 18.11Saudi Arabia
- 18.12Singapore
- 19Forecast Scenarios, 2035
- 19.1Low Case
- 19.2Base Case
- 19.3High Case
- 20Competitive Landscape
- 20.1Trane Technologies
- 20.2Johnson Controls (YORK)
- 20.3Carrier Global
- 20.4Daikin Industries (Daikin Applied)
- 20.5Vertiv
- 20.6Mitsubishi Electric
- 20.7LG Electronics
- 20.8Modine
- 20.9STULZ
- 20.10Midea Group
- 20.11Gree Electric Appliances
- 20.12Schneider Electric
- 20.13Smardt Chiller Group
- 20.14Mitsubishi Heavy Industries
- 20.15Market Concentration
- 21Recent Developments
- 21.1LG Electronics 5 GW Chiller Supply Agreement, October 2026
- 21.2NVIDIA Vera Rubin Chiller-Free Design, July 2026
- 21.3Carrier and Trane Second-Quarter 2026 Orders
- 21.4Trane Completes LiquidStack Acquisition, March 2026
- 21.5Johnson Controls YORK YDAM Launch, February 2026
- Fig. 1Data Center Chiller Market Size, 2020-2035 (USD Billion)
- Table 1Report Attributes
- Table 2Scope Comparison: What Is In and Out
- Table 3Chiller Equipment and Service Price per MW, 2020-2035
- Table 4Market by Chiller Type, 2025 and 2035
- Table 5Market by Compressor, 2025 and 2035
- Table 6Market by Data Center Type, 2025 and 2035
- Table 7Market by Offering, 2025 and 2035
- Table 8AI Hall Chiller Content Teardown by Cooling Design, 2025
- Table 9Market by Region, 2025 and 2035
- Table 10Top 12 Countries, 2025 and 2035
- Table 11Forecast Scenarios, 2035
About this report
Written by Amit Jain and reviewed by Deepti Agrawal, Senior Editor, Research. Figures are built top-down and bottom-up and reconciled before publication, with 2025 as the base year.
Read our methodologyHow we built this
- Historical period2020-2024
- Base year2025
- Forecast period2026-2035
- Sizing approachTop-down + bottom-up
Need more than the report?
Advisory on this market
Due diligence, site selection and market entry work, by the analysts who wrote this report.
See consulting servicesFrequently asked questions
USD 3.76 billion in 2026, up 16.2% from USD 3.23 billion in 2025, according to DC Market Insights estimates. The market is projected to reach USD 6.90 billion by 2035, a CAGR of 7.88% from 2025.
7.88% a year from 2025 to 2035, after 15.69% a year between 2020 and 2025, because new data center capacity keeps rising while warm-water AI cooling lowers the share of halls that need chillers.
USD 3.23 billion of 2025 spending covers the air-cooled and water-cooled chillers that remove heat from a data hall’s chilled-water loop, plus their installation, replacement and service. Cooling towers, CRAH units, CDUs and pumps are excluded.
54.0% of 2025 value, or USD 1.75 billion, goes to air-cooled chillers, which grow 9.21% a year because they need no cooling-tower water. Centrifugal compressors lead by compressor type with 45.0%.
About USD 210,000 of chiller equipment per MW of IT load in a conventional hall and USD 260,000 in an AI hall in 2025, according to DC Market Insights estimates, or about USD 616 to USD 703 per ton before 18% installation.
80% of new AI capacity used chillers in 2025, but DC Market Insights expects 50% by 2035 because NVIDIA’s 45 °C liquid inlet design allows chiller-free dry coolers. Hot sites such as Riyadh and Mumbai keep chillers.
42.0% of 2025 value, or USD 1.36 billion, is spent in North America. The Middle East and Africa grows fastest at 12.35% a year, and India is the fastest large country at 13.54%.
About 55% of 2025 value is held by Trane Technologies, Johnson Controls, Carrier Global, Daikin Industries and Vertiv together (DC Market Insights estimate). Mitsubishi Electric, LG Electronics, Modine, STULZ and Midea also compete.
Replacement chillers rise from USD 613.87 million in 2025 to USD 1.55 billion in 2035 as the US EPA 700 GWP limit (2025) and the EU F-gas ban on chillers with a GWP of 750 or more (2027) push older units out.
USD 3.76 billion in 2026 is the DC Market Insights figure for chillers and their installation and service at data centers only. Estimates that add cooling towers, pumps, air handlers, liquid cooling or comfort chillers come out several times larger.
Licences, delivery and payment
Which licence should I choose?
Single User is a view-only PDF for one person. Multi User adds a printable PDF and the Excel data for unlimited users at one location. Enterprise covers your whole company and includes 100 free analyst hours.
How and when will I receive the report?
By email, within 24–48 business hours of payment, in the formats of your licence.
How can I pay?
Securely through PayPal: with a PayPal account, a debit or credit card, or PayPal Pay Later where available. Prices are in US dollars.
Can I see a sample first?
Yes. Request a free sample and we will email it to you.
Can the report be tailored to my needs?
Yes. We can add countries, segments or data cuts. Talk to an analyst about the scope you need.
Can I get an invoice or pay against a purchase order?
Write to sales@dcmarketinsights.com and our team will help.