
Data Center Power Quality Market Size, Share & Forecast to 2035
Market at a glance
The Data Center Power Quality market was worth USD 993.0 million in 2025 and is forecast to reach USD 2,940.0 million by 2035, growing at a 19.27% CAGR.
 By Amit Jain, Senior Consultant, ICT & Emerging Technologies
 Reviewed by Deepti Agrawal
Last updated 21 Oct 2026
Base year 2025 PDF + Excel
What is inside the report
- 01Introduction
- 02Executive Summary
- 03Market Scope
- 04Why Market Estimates Differ
- 05Market Drivers
- 06Market Trends
- 07Market Challenges
- 08Market Opportunities
- 09Pricing Analysis
- 10Standards and Regulation
- 19chapters
- 2020-2024Historical period
- 2026-2035Forecast period
- —Companies profiled
Segmentation
Full analysis
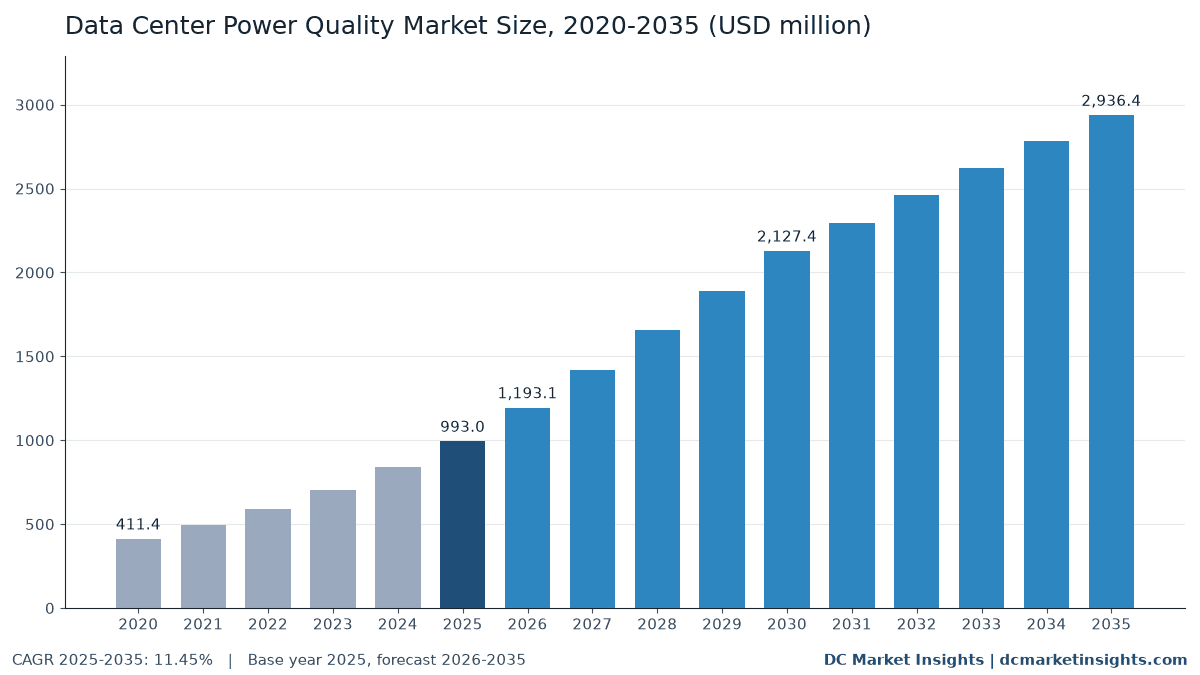
The Data Center Power Quality Market is valued at USD 1.19 billion in 2026 and is projected to reach USD 2.94 billion by 2035, up from USD 993.00 million in 2025, a CAGR of 11.45% from 2025 to 2035 (DC Market Insights estimate). The spending trigger is a grid event, not a catalogue: on 10 July 2024 a 230 kilovolt (kV) fault in Northern Virginia made about 1,500 megawatts (MW) of data center load switch itself to backup power at once, and the North American Electric Reliability Corporation (NERC) found that voltage then rose to 1.07 per unit until operators switched out capacitor banks. Grid operators now write ride-through and harmonic rules for large computing loads, and PJM Interconnection has proposed that sites of 50 MW or more ride through faults from January 2027 instead of dropping to their generators. That turns harmonic filters, surge protection, power quality meters and fast reactive-power compensation into a line item of every AI campus: DC Market Insights puts power quality content at about USD 45,000 per MW in an air-cooled hall and USD 70,000 per MW in an AI hall in 2025. Static synchronous compensators (STATCOM) and dynamic VAR compensation grow fastest, 19.16% a year, and Asia Pacific is the fastest region at 13.88% a year.
Key Market Statistics: How Big Is the Data Center Power Quality Market in 2026?
DC Market Insights values the Data Center Power Quality Market at USD 1.19 billion in 2026, 20.15% above the USD 993.00 million of 2025.
- Market size 2025: USD 993.00 million; 2026: USD 1.19 billion; 2030: USD 2.13 billion; 2035: USD 2.94 billion.
- CAGR 2025-2035: 11.45% in the base case; the 2035 range runs from USD 2.35 billion (low, 9.00%) to USD 3.52 billion (high, 13.50%).
- Power quality content per new MW of IT capacity: about USD 45,000 air-cooled and USD 70,000 for an AI hall in 2025 (DC Market Insights estimate).
- Largest product type: active harmonic filters, USD 320.58 million or 32.3% of 2025 spend.
- Fastest product type: STATCOM and dynamic VAR compensation, from USD 73.50 million in 2025 to USD 424.12 million in 2035, 19.16% a year.
- New build took USD 645.00 million (65.0%); retrofit, replacement and service USD 348.00 million.
- Leading region: North America, USD 407.13 million (41.0%) in 2025; fastest region: Asia Pacific, 13.88% a year.
- Largest country: United States, USD 374.56 million in 2025; fastest large country: India, 18.58% a year.
- Market leaders: Schneider Electric, Eaton, ABB, Siemens and Hitachi Energy hold about 52% of 2025 spend (DC Market Insights estimate).
How Much Has Data Center Power Quality Spending Grown Since 2020?
The Global Data Center Power Quality Market size was valued at USD 411.40 million in 2020, reached USD 993.00 million in 2025, and is anticipated to reach USD 2.94 billion by 2035, at a CAGR of 11.45% during the forecast period.
| Attribute | Details |
|---|---|
| Historical period | 2020-2024 |
| Base year | 2025 |
| Forecast period | 2026-2035 |
| Market size 2025 | USD 993.00 million |
| Market size 2026 | USD 1.19 billion |
| CAGR 2025-2035 | 11.45% |
| Market size 2035 | USD 2.94 billion |
| CAGR 2020-2025 | 19.27% |
Power quality spending rose 2.41 times between 2020 and 2025, 19.27% a year, because new data center IT capacity brought into service each year rose from about 5.0 gigawatts (GW) to 12.0 GW and the AI share of it from about 10% to 35%. Growth eases to 11.45% a year after 2025 as yearly additions flatten toward 27 GW, but two lines keep compounding: the AI premium per MW, which pays for fast reactive-power compensation, and the installed base of 116 GW rising to 311 GW, whose surge arresters, capacitors and filters wear out and are replaced. The 20.15% step in 2026 reflects 14 GW of new capacity, 40% of it AI halls, in the DC Market Insights capacity series.
What Counts as Data Center Power Quality Equipment?
This market counts USD 993.00 million of 2025 end-user spend on equipment and services that keep voltage, current waveform and reactive power inside limits at data center sites.
Included
- Active harmonic filters (AHF) and their replacement modules, mostly 60 amperes (A) to 300 A per unit at 400 volts (V) to 480 V.
- Passive harmonic filters, detuned capacitor banks and power factor correction (PFC) equipment.
- Surge protective devices (SPD) at service entrance, switchboards, panels and racks.
- Power quality meters and analyzers built to the International Electrotechnical Commission (IEC) 61000-4-30 measurement method.
- Voltage regulators, power conditioners and isolation transformers bought for power quality.
- STATCOM, static VAR compensators (SVC) and dynamic VAR systems at the campus grid connection, including units with supercapacitors for load smoothing.
- Power quality audits, harmonic studies, monitoring subscriptions and maintenance.
Excluded
- Uninterruptible power supplies (UPS) and their batteries, counted in the Data Center UPS Market.
- Battery energy storage systems used for load smoothing, grid substations and power transformers, counted in the Data Center Transformer Market and sister reports.
- Power distribution software and building management systems that only display meter data.
- Server power supplies, even though their power factor correction stage shapes the current drawn.
How Do the Power Quality Segments Add Up?
Each 2025 dollar sits once in every dimension: new build (USD 645.00 million) plus retrofit, replacement and service (USD 348.00 million) adds to USD 993.00 million, and so do the product type, voltage level and data center type splits.
Why Do Data Center Power Quality Market Estimates Differ?
DC Market Insights puts the 2026 market at USD 1.19 billion for power quality equipment and services bought for data centers only; broader definitions that add UPS, storage or utility-side equipment come out about twice as large.
The gap comes from what is counted as “power quality”. Some definitions include online double-conversion UPS units, because they condition power, and battery storage that flattens AI load swings; both are much larger markets than the filters and compensators themselves. Others add utility substation STATCOM paid for by the grid operator rather than the data center, generic electrical panels with built-in surge protection, and industrial power quality equipment sold through the same distributors. A narrower view counts only active harmonic filters and misses that surge protection and services take 30.9% of 2025 spend.
| Element | In this estimate | Why |
|---|---|---|
| Active and passive harmonic filters, power factor correction | Yes, USD 423.30 million (2025) | Bought to meet harmonic limits at the site connection |
| Surge protective devices | Yes, USD 168.00 million (2025) | Installed and replaced by the data center |
| STATCOM and dynamic VAR at the campus connection | Yes, USD 73.50 million (2025) | Paid by the data center developer |
| Power quality audits and monitoring | Yes, USD 139.20 million (2025) | Recurring operator spend |
| UPS and batteries | No | Counted in the UPS and battery reports |
| Battery energy storage for load smoothing | No | Counted in energy storage |
| Utility-owned substation compensation | No | Paid by the grid operator |
Online UPS conditioning, battery energy storage, utility-owned reactive compensation and industrial plant filters are therefore out of scope, even when the same supplier sells them to the same campus. In scope are all data center buyers: hyperscale and AI campuses, colocation providers, enterprises and small edge and telecom sites that buy little more than a set of surge protective devices and one meter.
Why Are Data Centers Buying More Power Quality Equipment?
Three forces lift spending from USD 993.00 million in 2025 to USD 2.13 billion in 2030: grid operators’ reaction to mass load-loss events, the harmonic and flicker signature of AI clusters, and campus sizes that now reach hundreds of megawatts at one connection.
The 1,500 MW Virginia Load Loss of July 2024 Made Ride-Through a Grid Rule
NERC’s incident review of January 2025 found that a 230 kV line fault on 10 July 2024 caused the simultaneous loss of about 1,500 MW of voltage-sensitive load, all of it data centers, after six faults within 82 seconds tripped their transfer schemes (NERC incident review). Voltage then rose to 1.07 per unit and operators had to switch out shunt capacitor banks. NERC followed with a Level 2 alert in September 2025 citing several events above 1,000 MW and a Level 3 essential-action alert in May 2026, and PJM Interconnection put forward voltage and frequency ride-through requirements for large computational loads in October 2026. Riding through a fault on the grid side, rather than dropping to diesel, needs voltage support and reactive compensation at the site: DC Market Insights puts the AI-hall premium at about USD 25,000 per MW in 2025, USD 105.00 million across new AI capacity.
AI Training Clusters Swing Hundreds of Megawatts in Seconds
NERC’s July 2025 white paper on emerging large loads states that AI training clusters show rapid power fluctuations during training and checkpoint saving, and that a data center load pulse can cause voltage distortion and flicker for neighbours (NERC Large Loads Task Force). The same paper notes oscillations on the Dominion Energy system from interaction between data center UPS input units. Hitachi Energy and Siemens Energy now sell STATCOM with supercapacitors to smooth such swings at the grid connection, which is why STATCOM and dynamic VAR compensation grow from USD 73.50 million to USD 424.12 million.
Chiller and Pump Drives Push Harmonics Past IEEE 519 Limits
The same NERC paper names data centers as a potential significant harmonic source unless filtering is designed in, and shows a site where voltage distortion fell sharply after mitigation was installed. Variable speed drives on chillers, pumps and fans, UPS rectifiers and server power supplies all draw distorted current, and utilities apply the Institute of Electrical and Electronics Engineers (IEEE) 519-2022 limits at the point of common coupling. Comsys documents a data center that installed 8 active harmonic filters in a first phase and 10 more in a second phase to stop chiller trips caused by resonance. Active harmonic filters took USD 320.58 million in 2025, the largest single line.
How Is Data Center Power Quality Technology Changing?
The clearest shift is from the switchroom to the grid connection: medium and high voltage equipment grows 15.31% a year, from USD 158.63 million in 2025 to USD 659.09 million in 2035, against 10.56% for low voltage.
STATCOM with Supercapacitors Moves from Utility Yards to Campus Substations
Hitachi Energy markets its SVC Light Enhanced, a STATCOM with supercapacitors, for AI data center power quality, and in April 2026 announced a USD 10 million power electronics centre in Cary, North Carolina, that supports STATCOM work for AI data centers (Hitachi Energy). Its distributed-power STATCOM comes in units of 3 megavolt-amperes reactive (MVAr) to 20 MVAr, the size range of a 100 MW to 300 MW campus. Siemens Energy described its E-STATCOM in May 2026 as a way to smooth AI load swings at the data center’s grid connection.
Power Quality Meters Become Grid Compliance Instruments
Meters built to IEC 61000-4-30 Class A, whose fourth edition was published in October 2025, record the waveform data that grid operators ask for after a disturbance. NERC’s Level 3 alert covers modelling, instrumentation and commissioning of computational loads, and its draft registration of a “Computational Load Entity” from 20 MW at 60 kV would make that data a compliance record. Meters and analyzers earned USD 108.00 million in 2025 and audits and monitoring services USD 139.20 million; services grow faster, 12.08% a year, because operators buy the analysis rather than the instrument.
Surge Protection Follows the IEC 61643-11:2025 Edition
IEC 61643-11 Edition 2.0, published in June 2025, is the current test standard for surge protective devices on low-voltage AC systems, and new data halls specify devices to it at every distribution level. Surge protective devices took USD 168.00 million in 2025, USD 87.00 million of it replacement of devices in the installed base, which is why the line grows with installed capacity as well as new build.
What Slows Data Center Power Quality Spending?
Two limits keep growth near 11.45% a year after 2025: cleaner power electronics inside servers and UPS, and rules that are still drafts.
Server Power Supplies Already Correct Their Own Power Factor
The ENERGY STAR Computer Servers Version 4.0 specification of the United States Environmental Protection Agency (EPA), effective January 2024, requires a power factor of at least 0.90 at 50% load for multi-output server power supplies. Modern UPS rectifiers draw near-sinusoidal current as well, so the IT load itself needs less filtering than a decade ago. DC Market Insights therefore holds air-hall content almost flat, USD 45,000 per MW in 2025 and USD 46,000 in 2035, and puts the growth in the AI premium and the installed base.
Ride-Through Rules Are Proposals, Not Yet Tariffs
PJM’s ride-through requirement is a proposal to its Planning Committee, Texas Senate Bill 6 of June 2025 sets a 75 MW large-load threshold without a ride-through or power quality clause, and Ireland’s Commission for Regulation of Utilities (CRU) decision of December 2025 asks new data centres for on-site dispatchable generation rather than compensation equipment. If rules slip, developers may defer STATCOM orders; the DC Market Insights low case of USD 2.35 billion in 2035 assumes the AI premium stays near USD 20,000 per MW.
Where Will New Power Quality Revenue Come From by 2035?
Two pools add the most: campus-level reactive compensation (USD 73.50 million to USD 424.12 million) and audits and monitoring (USD 139.20 million to USD 435.40 million).
Campus STATCOM for 50 MW-Plus Loads: USD 73.50 million to USD 424.12 million
PJM’s proposal applies to sites of 50 MW or more with at least 25 MW served through power electronic conversion, which describes nearly every AI campus under construction in the region. At about 30 MVAr of dynamic compensation per 100 MW of AI load, the AI share of new capacity rising from 35% to 66% lifts the line 19.16% a year. Eaton reported Electrical Americas net sales of USD 13.28 billion in 2025, up 16%, with the organic increase due to strength in data center end-markets, and a backlog up 31% (Eaton 2025 Form 10-K).
Harmonic Studies and Disturbance Monitoring: USD 139.20 million to USD 435.40 million
Every interconnection study and every grid disturbance now asks for waveform data and a harmonic study, and the installed base rises from 116 GW to 311 GW. Service providers that bundle meters, a monitoring subscription and an annual harmonic audit capture recurring revenue of about USD 1,200 per installed MW a year in 2025 (DC Market Insights estimate).
What Does Power Quality Equipment Cost per Megawatt?
Power quality content averaged about USD 45,000 per new MW of air-cooled IT capacity and USD 70,000 per MW in an AI hall in 2025 (DC Market Insights estimates).
| Cost line (DC Market Insights estimate) | 2020 | 2025 | 2030 | 2035 |
|---|---|---|---|---|
| Air-cooled hall content (USD per new MW) | 42,000 | 45,000 | 46,000 | 46,000 |
| AI hall content (USD per new MW) | 60,000 | 70,000 | 78,000 | 80,000 |
| Installed base replacement and service (USD per MW per year) | 2,600 | 3,000 | 3,300 | 3,500 |
Public price points are few, because suppliers quote per project. United States federal award records show a 480 V, 525 A harmonic filter bought by the Defense Logistics Agency for USD 438,956.72 in September 2025, a power quality meter for a Western Area Power Administration substation at USD 28,004.24 in July 2025, and a 7-mode 120/208 V surge protective device at USD 2,736.28 in May 2025; none of the records states the quantity, so no price per ampere is derived. Within the air-hall content, DC Market Insights allocates 40% to harmonic filters, 20% to meters, 15% each to surge protection and voltage regulation, and 10% to power factor correction.
Which Grid Rules and Standards Shape Data Center Power Quality?
Seven rules and standards decide most of the USD 993.00 million spent in 2025: three grid-operator actions and four equipment standards.
- IEEE 519-2022, Standard for Harmonic Control in Electric Power Systems: voltage and current distortion limits at the point of common coupling.
- IEC 61000-3-12: harmonic current limits for equipment above 16 A and up to 75 A per phase on public low-voltage networks.
- IEC 61000-4-30 Edition 4.0 (October 2025): Class A and Class S power quality measurement methods.
- IEC 61643-11 Edition 2.0 (June 2025): surge protective devices on low-voltage AC systems.
- NERC Level 2 alert (September 2025) and Level 3 essential-action alert (May 2026) on large-load interconnection, commissioning and operation.
- PJM proposal for large computational load ride-through (October 2026): sites of 50 MW or more, new projects from 16 January 2027 (PJM Planning Committee).
- Texas Senate Bill 6 (June 2025): large loads of 75 MW and above, curtailment in firm load shed and backup-generation disclosure.
The PJM draft also bars schemes that disconnect a site by transferring it to backup generation during a disturbance, so the ride-through burden moves onto site power conditioning.
Which Data Center Power Quality Segment Earns the Most?
Active harmonic filters earn the most, USD 320.58 million or 32.3% of 2025 spend, while STATCOM and dynamic VAR compensation grow fastest at 19.16% a year.
By Product Type
| Product Type | 2025 (USD million) | Share 2025 | 2035 (USD million) | CAGR 2025-2035 |
|---|---|---|---|---|
| Active Harmonic Filters | USD 320.58 million | 32.3% | USD 907.14 million | 10.96% |
| Passive Filters and Power Factor Correction | USD 102.72 million | 10.3% | USD 276.59 million | 10.41% |
| Surge Protective Devices | USD 168.00 million | 16.9% | USD 458.43 million | 10.56% |
| Power Quality Meters and Analyzers | USD 108.00 million | 10.9% | USD 248.40 million | 8.69% |
| Voltage Regulators and Power Conditioners | USD 81.00 million | 8.2% | USD 186.30 million | 8.69% |
| STATCOM and Dynamic VAR Compensation | USD 73.50 million | 7.4% | USD 424.12 million | 19.16% |
| Power Quality Audits and Monitoring Services | USD 139.20 million | 14.0% | USD 435.40 million | 12.08% |
STATCOM and dynamic VAR rise from 7.4% to 14.4% of spend as AI campuses connect at transmission voltage. Meters and voltage regulators grow only 8.69% a year, because their content per MW stays flat while the AI premium goes to compensation and filters.
By Voltage Level
| Voltage Level | 2025 (USD million) | Share 2025 | 2035 (USD million) | CAGR 2025-2035 |
|---|---|---|---|---|
| Low Voltage (below 1 kV) | USD 834.37 million | 84.0% | USD 2,277.29 million | 10.56% |
| Medium and High Voltage (1 kV and above) | USD 158.63 million | 16.0% | USD 659.09 million | 15.31% |
Low voltage equipment keeps 77.6% of 2035 spend because every panel and switchboard carries filters, surge protection and meters, but medium and high voltage grows 15.31% a year as compensation moves to the campus substation.
By Project Type
| Project Type | 2025 (USD million) | Share 2025 | 2035 (USD million) | CAGR 2025-2035 |
|---|---|---|---|---|
| New Build | USD 645.00 million | 65.0% | USD 1,847.88 million | 11.10% |
| Retrofit Replacement and Service | USD 348.00 million | 35.0% | USD 1,088.50 million | 12.08% |
Retrofit, replacement and service grows 12.08% a year, ahead of new build at 11.10%, because surge protective devices and capacitors in 116 GW of installed halls reach end of life while yearly new capacity grows more slowly after 2030.
By Data Center Type
| Data Center Type | 2025 (USD million) | Share 2025 | 2035 (USD million) | CAGR 2025-2035 |
|---|---|---|---|---|
| Hyperscale and AI Campuses | USD 397.20 million | 40.0% | USD 1,468.19 million | 13.97% |
| Colocation | USD 317.76 million | 32.0% | USD 910.28 million | 11.10% |
| Enterprise | USD 208.53 million | 21.0% | USD 411.09 million | 7.02% |
| Edge and Telecom | USD 69.51 million | 7.0% | USD 146.82 million | 7.76% |
Hyperscale and AI campuses grow 13.97% a year to half of 2035 spend; enterprise sites grow 7.02% a year as enterprise IT moves to colocation and cloud.
DC Exclusive: Grid Ride-Through Rule Tracker, 9 Milestones from Virginia 2024 to PJM 2027
Nine dated grid and standards milestones since 2022 explain why power quality content in an AI hall rose to about USD 70,000 per MW, according to this DC Market Insights tracker built from 9 public inputs.
| Date | Body | Milestone | Equipment it pulls in |
|---|---|---|---|
| August 2022 | IEEE | IEEE 519-2022 harmonic limits published | Active and passive harmonic filters |
| January 2024 | US EPA ENERGY STAR | Server power supply power factor of at least 0.90 at 50% load | Less filtering on IT load, more on mechanical drives |
| July 2024 | Grid event, Virginia | About 1,500 MW of data center load lost in one fault sequence | Ride-through studies, meters, capacitor control |
| January 2025 | NERC | Incident review of the July 2024 event | Disturbance recording at the site |
| June 2025 | IEC | IEC 61643-11 Edition 2.0 for surge protective devices | SPD replacement to the new edition |
| July 2025 | NERC | Large loads white paper: harmonics, flicker, oscillations | Harmonic studies and filters at design stage |
| September 2025 | NERC | Level 2 alert on large-load commissioning and operation | Commissioning tests and monitoring |
| May 2026 | NERC | Level 3 essential-action alert; draft Computational Load Entity from 20 MW | Class A meters and data retention |
| October 2026 | PJM | Ride-through proposal for 50 MW-plus loads, new projects from 16 January 2027 | STATCOM and dynamic VAR at the campus connection |
The tracker shows the cost shift: before 2024 the rules asked data centers mainly to keep harmonics in limits, which an air-cooled hall meets with about USD 45,000 per MW of filters, surge protection and meters. After the Virginia event the rules ask them to stay connected and steady through grid faults and their own load swings, which adds about USD 25,000 per MW of dynamic compensation in an AI hall in 2025 and USD 34,000 by 2035. A 300 MW AI campus that falls under the PJM proposal therefore carries about USD 21 million of power quality equipment, against USD 13.5 million for the same capacity built air-cooled before the rules.
Which Region Spends the Most on Data Center Power Quality?
North America spends the most, USD 407.13 million or 41.0% of 2025, while Asia Pacific grows fastest at 13.88% a year to USD 910.28 million in 2035.
| Region | 2025 (USD million) | Share 2025 | 2035 (USD million) | CAGR 2025-2035 |
|---|---|---|---|---|
| North America | USD 407.13 million | 41.0% | USD 1,115.83 million | 10.61% |
| Europe | USD 238.32 million | 24.0% | USD 631.32 million | 10.23% |
| Asia Pacific | USD 248.25 million | 25.0% | USD 910.28 million | 13.88% |
| Latin America | USD 39.72 million | 4.0% | USD 102.77 million | 9.97% |
| Middle East and Africa | USD 59.58 million | 6.0% | USD 176.18 million | 11.45% |
North America
North America took USD 407.13 million in 2025. The United States Department of Energy reports that data centers used about 4.4% of United States electricity in 2023, 176 terawatt-hours (TWh), and may use 6.7% to 12% by 2028, which is why NERC and PJM act first here.
Europe
Europe spent USD 238.32 million in 2025, led by Germany, the United Kingdom and Ireland. Hitachi Energy won an order in July 2026 for a dedicated 110 kV grid connection for a data center in Frankfurt, and Irish policy since December 2025 ties new connections to on-site dispatchable generation.
Asia Pacific
Asia Pacific grows from USD 248.25 million to USD 910.28 million, 13.88% a year, as India, Japan, Australia and Malaysia connect AI campuses to weaker grids; India alone grows 18.58% a year.
Latin America
Latin America spent USD 39.72 million in 2025, mostly in Brazil, Mexico and Chile, where campuses on long radial lines buy voltage regulation and surge protection first.
Middle East and Africa
The Middle East and Africa grows 11.45% a year to USD 176.18 million, led by Saudi Arabia at 13.96% a year as gigawatt-scale AI campuses connect at transmission voltage.
Which Countries Spend the Most on Data Center Power Quality?
The United States spends the most, USD 374.56 million in 2025, and India is the fastest large country at 18.58% a year.
| Rank | Country | Region | 2025 (USD million) | 2035 (USD million) | CAGR 2025-2035 |
|---|---|---|---|---|---|
| 1 | United States | North America | USD 374.56 million | USD 1,015.41 million | 10.49% |
| 2 | China | Asia Pacific | USD 89.37 million | USD 300.39 million | 12.89% |
| 3 | Germany | Europe | USD 47.66 million | USD 126.26 million | 10.23% |
| 4 | United Kingdom | Europe | USD 45.28 million | USD 113.64 million | 9.64% |
| 5 | Japan | Asia Pacific | USD 42.20 million | USD 127.44 million | 11.69% |
| 6 | Canada | North America | USD 32.57 million | USD 100.42 million | 11.92% |
| 7 | Australia | Asia Pacific | USD 27.31 million | USD 91.03 million | 12.79% |
| 8 | Ireland | Europe | USD 25.02 million | USD 59.98 million | 9.14% |
| 9 | India | Asia Pacific | USD 24.83 million | USD 136.54 million | 18.58% |
| 10 | France | Europe | USD 23.83 million | USD 63.13 million | 10.23% |
| 11 | Netherlands | Europe | USD 22.64 million | USD 53.66 million | 9.01% |
| 12 | Saudi Arabia | Middle East and Africa | USD 14.30 million | USD 52.85 million | 13.96% |
Virginia, Texas and Ohio account for most of the United States figure because they hold the largest AI campus pipelines and the PJM and ERCOT large-load rules. India’s USD 24.83 million grows to USD 136.54 million as Mumbai and Chennai campuses connect at 220 kV, and Ireland ranks eighth with USD 25.02 million on a grid where data centres take a large share of demand.
What Could the Data Center Power Quality Market Be Worth in 2035?
The 2035 value ranges from USD 2.35 billion to USD 3.52 billion, with a base case of USD 2.94 billion (DC Market Insights scenarios).
| Scenario | 2035 (USD million) | CAGR 2025-2035 | Assumption |
|---|---|---|---|
| Low | USD 2,350.79 million | 9.00% | Ride-through rules stay voluntary and AI premium stays near USD 20,000 per MW |
| Base | USD 2,936.38 million | 11.45% | 27 GW of new capacity in 2035, 66% AI, USD 80,000 per AI MW |
| High | USD 3,522.96 million | 13.50% | PJM-style rules adopted by most grid operators and STATCOM on every campus above 50 MW |
Who Are the Leading Data Center Power Quality Suppliers?
Schneider Electric, Eaton, ABB, Siemens and Hitachi Energy hold about 52% of 2025 spend, a DC Market Insights estimate based on product breadth, data center orders and stated segment growth.
- Schneider Electric
- Eaton
- ABB
- Siemens
- Hitachi Energy
- Siemens Energy
- nVent (ERICO)
- Legrand (including Avtron Power Solutions)
- Littelfuse
- Comsys
- Merus Power
- TDK
- DEHN
- Phoenix Contact
- Socomec
- Fluke
Schneider Electric reported 2025 revenue of EUR 40.15 billion, up 9% organic, with its Energy Management business, which holds its AccuSine filters and PowerLogic meters, up 10% organic and led by data centers in the fourth quarter, when pure data center demand grew at triple digits. nVent reported 2025 sales of USD 3.9 billion, with its Electrical Connections segment, home of the ERICO surge protection line, at USD 1.30 billion, and said 2026 growth would be led by data centers and power utilities. Legrand agreed in October 2025 to buy Avtron Power Solutions, which describes itself as a leader in load banks and power quality solutions for data centers and expected nearly USD 350 million of 2025 revenue.
What Has Changed in Data Center Power Quality Since 2025?
Six dated moves since June 2025 show suppliers shifting from switchroom filters to grid-connection compensation.
- In June 2025, Comsys published a data center case with 8 active harmonic filters in phase one and 10 more in phase two (Source: Comsys).
- In October 2025, Legrand agreed to buy Avtron Power Solutions, a load bank and power quality supplier to data centers (Source: Legrand).
- In December 2025, Littelfuse completed its acquisition of Basler Electric (Source: Littelfuse).
- In April 2026, Hitachi Energy announced a USD 10 million power electronics centre in North Carolina supporting STATCOM for AI data centers (Source: Hitachi Energy).
- In May 2026, Siemens Energy presented its E-STATCOM for smoothing AI load swings at the grid connection (Source: Siemens Energy).
- In July 2026, Hitachi Energy won an order for a dedicated 110 kV connection for a Frankfurt data center (Source: Hitachi Energy).
Analyst Takeaways: What Should AI Campus Developers Budget For?
Budget power quality at about USD 70,000 per MW for an AI hall, because grid rules now ask the campus to stay connected through faults.
- USD 25,000 per MW: the AI-hall premium over an air-cooled hall pays mainly for STATCOM and dynamic VAR at the grid connection.
- 50 MW: sites at or above the PJM threshold should plan ride-through from 16 January 2027, and should not rely on transfer to generators.
- USD 435.40 million by 2035: monitoring and harmonic audits become recurring spend as every disturbance needs waveform records.
- 35.0% of 2025 spend is retrofit and service: surge protective devices and capacitors in older halls need replacement on a 7- to 10-year cycle.
Methodology: How Did DC Market Insights Size the Data Center Power Quality Market?
DC Market Insights built the Data Center Power Quality Market bottom-up from new and installed data center capacity, giving USD 993.00 million for 2025 from 11 model inputs.
New-build spend equals new IT capacity (12.0 GW in 2025, 22.0 GW in 2030, 27.0 GW in 2035) times USD 45,000 per MW of air-hall content, plus the AI share (35%, 60%, 66%) times the AI premium of USD 25,000 per MW in 2025: USD 645.00 million. Installed-base spend equals installed IT capacity (116 GW in 2025, 311 GW in 2035) times USD 3,000 per MW a year for surge device and capacitor replacement, filter retrofits, audits and monitoring: USD 348.00 million. Segment, region and country shares are applied to the components and the total, and every split sums to it.
Three bound checks hold. Ceiling one: if every new MW in 2025 carried AI-hall content and the installed base were serviced at the 2035 rate of USD 3,500 per MW, spend would be about USD 1.25 billion, above the USD 993.00 million base. Ceiling two: the market equals 5.0% of the USD 19.78 billion that DC Market Insights puts on the data center power market in 2025 and 16.0% of the USD 6.22 billion Data Center Switchgear Market, a plausible share for equipment that protects the switchgear’s output. Floor: a minimum fit of USD 30,000 per new MW (surge protection, meters and basic filters) plus USD 1,500 per installed MW a year gives about USD 534 million, below the base. Server power supplies and their power factor stages stay in the Data Center Rack Power Distribution Unit Market and server reports, not here. The full method is described on the DC Market Insights research methodology page.
Table of contents
- 01Introduction
- 1.1Report Description
- 1.2Key Market Statistics, 2025, 2026, 2030 and 2035
- 02Executive Summary
- 2.1Market Snapshot, 2025, 2026 and 2035
- 2.2Market Size Chart, 2020-2035
- 03Market Scope
- 3.1Included
- 3.2Excluded
- 3.3How Do the Power Quality Segments Add Up?
- 04Why Market Estimates Differ
- 4.1Scope Table: In and Out of This Estimate
- 05Market Drivers
- 5.1The 1,500 MW Virginia Load Loss of July 2024 Made Ride-Through a Grid Rule
- 5.2AI Training Clusters Swing Hundreds of Megawatts in Seconds
- 5.3Chiller and Pump Drives Push Harmonics Past IEEE 519 Limits
- 06Market Trends
- 6.1STATCOM with Supercapacitors Moves from Utility Yards to Campus Substations
- 6.2Power Quality Meters Become Grid Compliance Instruments
- 6.3Surge Protection Follows the IEC 61643-11:2025 Edition
- 07Market Challenges
- 7.1Server Power Supplies Already Correct Their Own Power Factor
- 7.2Ride-Through Rules Are Proposals, Not Yet Tariffs
- 08Market Opportunities
- 8.1Campus STATCOM for 50 MW-Plus Loads: USD 73.50 million to USD 424.12 million
- 8.2Harmonic Studies and Disturbance Monitoring: USD 139.20 million to USD 435.40 million
- 09Pricing Analysis
- 9.1Power Quality Content per MW, 2020-2035
- 9.2Public Price Points
- 10Standards and Regulation
- 10.1IEEE 519-2022
- 10.2IEC 61000-3-12
- 10.3IEC 61000-4-30 Edition 4.0
- 10.4IEC 61643-11 Edition 2.0
- 10.5NERC Level 2 and Level 3 Alerts
- 10.6PJM Large Computational Load Ride-Through Proposal
- 10.7Texas Senate Bill 6
- 11Market Segmentation
- 11.1By Product Type
- 11.2Active Harmonic Filters
- 11.3Passive Filters and Power Factor Correction
- 11.4Surge Protective Devices
- 11.5Power Quality Meters and Analyzers
- 11.6Voltage Regulators and Power Conditioners
- 11.7STATCOM and Dynamic VAR Compensation
- 11.8Power Quality Audits and Monitoring Services
- 11.9By Voltage Level
- 11.10Low Voltage (below 1 kV)
- 11.11Medium and High Voltage (1 kV and above)
- 11.12By Project Type
- 11.13New Build
- 11.14Retrofit Replacement and Service
- 11.15By Data Center Type
- 11.16Hyperscale and AI Campuses
- 11.17Colocation
- 11.18Enterprise
- 11.19Edge and Telecom
- 12DC Exclusive: Grid Ride-Through Rule Tracker
- 12.1Nine Milestones, 2022-2027
- 12.2300 MW AI Campus: USD 21 Million versus USD 13.5 Million
- 13Regional Insights
- 13.1North America
- 13.2Europe
- 13.3Asia Pacific
- 13.4Latin America
- 13.5Middle East and Africa
- 14Country Analysis
- 14.1United States
- 14.2China
- 14.3Germany
- 14.4United Kingdom
- 14.5Japan
- 14.6Canada
- 14.7Australia
- 14.8Ireland
- 14.9India
- 14.10France
- 14.11Netherlands
- 14.12Saudi Arabia
- 15Forecast Scenarios, 2035
- 15.1Low Scenario
- 15.2Base Scenario
- 15.3High Scenario
- 16Competitive Insights
- 16.1Schneider Electric
- 16.2Eaton
- 16.3ABB
- 16.4Siemens
- 16.5Hitachi Energy
- 16.6Siemens Energy
- 16.7nVent (ERICO)
- 16.8Legrand (including Avtron Power Solutions)
- 16.9Littelfuse
- 16.10Comsys
- 16.11Merus Power
- 16.12TDK
- 16.13DEHN
- 16.14Phoenix Contact
- 16.15Socomec
- 16.16Fluke
- 17Recent Developments
- 17.1Comsys Data Center Filter Case, June 2025
- 17.2Legrand Agreement to Buy Avtron, October 2025
- 17.3Littelfuse Completes Basler Electric, December 2025
- 17.4Hitachi Energy Cary Power Electronics Centre, April 2026
- 17.5Siemens Energy E-STATCOM, May 2026
- 17.6Hitachi Energy Frankfurt 110 kV Connection, July 2026
- 18Analyst Takeaways
- 18.1AI-Hall Premium
- 18.2PJM 50 MW Threshold
- 18.3Monitoring and Audits to 2035
- 18.4Retrofit and Replacement Cycle
- 19Research Methodology
- 19.1Model Inputs
- 19.2Bound Checks
- Fig. 1Data Center Power Quality Market Size, 2020-2035 (USD million)
- Table 1Market Snapshot, 2025, 2026 and 2035
- Table 2Scope Table: In and Out of This Estimate
- Table 3Power Quality Content per MW, 2020-2035
- Table 4Market by Product Type, 2025 and 2035
- Table 5Market by Voltage Level, 2025 and 2035
- Table 6Market by Project Type, 2025 and 2035
- Table 7Market by Data Center Type, 2025 and 2035
- Table 8Grid Ride-Through Rule Tracker, 2022-2027
- Table 9Market by Region, 2025 and 2035
- Table 10Top 12 Countries, 2025 and 2035
- Table 112035 Forecast Scenarios
About this report
Written by Amit Jain and reviewed by Deepti Agrawal, Senior Editor, Research. Figures are built top-down and bottom-up and reconciled before publication, with 2025 as the base year.
Read our methodologyHow we built this
- Historical period2020-2024
- Base year2025
- Forecast period2026-2035
- Sizing approachTop-down + bottom-up
Need more than the report?
Advisory on this market
Due diligence, site selection and market entry work, by the analysts who wrote this report.
See consulting servicesFrequently asked questions
USD 1.19 billion in 2026, up 20.15% from USD 993.00 million in 2025, according to DC Market Insights estimates. The market is projected to reach USD 2.94 billion by 2035, a CAGR of 11.45% from 2025.
11.45% a year from 2025 to 2035, after 19.27% a year from 2020 to 2025, because new IT capacity rises from 12.0 GW to 27.0 GW a year and the AI share of it from 35% to 66%.
About USD 25,000 more per MW than an air-cooled hall in 2025, because AI training clusters swing power in seconds and grid operators now ask large loads to ride through faults instead of dropping to backup power.
About 1,500 MW of data center load switched to backup power after a 230 kV fault on 10 July 2024, NERC found. Voltage rose to 1.07 per unit until operators switched out capacitor banks.
Active harmonic filters, with USD 320.58 million or 32.3% of 2025 spend, because chiller, pump and fan drives and UPS rectifiers draw distorted current that IEEE 519-2022 limits at the grid connection.
About USD 45,000 per new MW in an air-cooled hall and USD 70,000 per MW in an AI hall in 2025 (DC Market Insights estimates), plus about USD 3,000 per installed MW a year for replacement and service.
50 MW is the threshold: PJM proposed in October 2026 that large computational loads of 50 MW or more ride through voltage and frequency disturbances, for new projects from 16 January 2027, without transferring to backup generation.
North America, with USD 407.13 million or 41.0% of 2025 spend. Asia Pacific grows fastest at 13.88% a year, and India is the fastest large country at 18.58% a year.
Schneider Electric, Eaton, ABB, Siemens and Hitachi Energy hold about 52% of 2025 spend (DC Market Insights estimate). Hitachi Energy and Siemens Energy now sell STATCOM with supercapacitors for AI data center load swings.
USD 1.19 billion in 2026 is the DC Market Insights figure for filters, surge protection, meters, compensation and services bought by data centers. Estimates that add UPS, battery storage or utility-owned compensation come out about twice as large.
Licences, delivery and payment
Which licence should I choose?
Single User is a view-only PDF for one person. Multi User adds a printable PDF and the Excel data for unlimited users at one location. Enterprise covers your whole company and includes 100 free analyst hours.
How and when will I receive the report?
By email, within 24–48 business hours of payment, in the formats of your licence.
How can I pay?
Securely through PayPal: with a PayPal account, a debit or credit card, or PayPal Pay Later where available. Prices are in US dollars.
Can I see a sample first?
Yes. Request a free sample and we will email it to you.
Can the report be tailored to my needs?
Yes. We can add countries, segments or data cuts. Talk to an analyst about the scope you need.
Can I get an invoice or pay against a purchase order?
Write to sales@dcmarketinsights.com and our team will help.