
Data Center Power Supply Unit Market Size, Share & Forecast to 2035
Market at a glance
The Data Center Power Supply Unit market was worth USD 6,070.0 million in 2025 and is forecast to reach USD 21.84 billion by 2035, growing at a 13.66% CAGR.
 By Amit Jain, Senior Consultant, ICT & Emerging Technologies
 Reviewed by Deepti Agrawal
Last updated 19 Oct 2026
Base year 2025 PDF + Excel
Key findings
Titanium Efficiency Is Already the Legal Floor for Servers
What is inside the report
- 01Introduction
- 02Research Methodology
- 03Executive Summary
- 04What Counts as a Data Center Power Supply Unit?
- 05Why Do Data Center Power Supply Unit Market Estimates Differ?
- 06Market Drivers
- 07Market Trends
- 08Market Restraints
- 09Market Opportunities
- 10Pricing Analysis: Data Center PSU Cost per kW
- 20chapters
- 2020-2024Historical period
- 2026-2035Forecast period
- —Companies profiled
Segmentation
Recent developments
Infineon Technologies said it expects around EUR 2.5 billion of AI data center power revenue in fiscal 2027 (Source: Infineon).
Advanced Energy reported 2025 Data Center Computing revenue of USD 587.3 million, up 107% (Source: Advanced Energy).
Flex announced its intention to spin off its Cloud and Power Infrastructure segment (Source: Flex).
Delta showed its 800 VDC in-row power rack with the NVIDIA MGX architecture (Source: Delta Electronics).
the OCP published revision 1.0.0 of the Open Rack V3 HPR V2 72 kW power shelf specification (Source: Open Compute Project).
Delta reported record quarterly revenue of NT$183.2 billion and set mass production of 800 V products for the third quarter (Source: Delta Electronics).
Advanced Energy reported Data Center Computing revenue of USD 192 million for the second quarter, up 35% (Source: Advanced Energy).
Full analysis
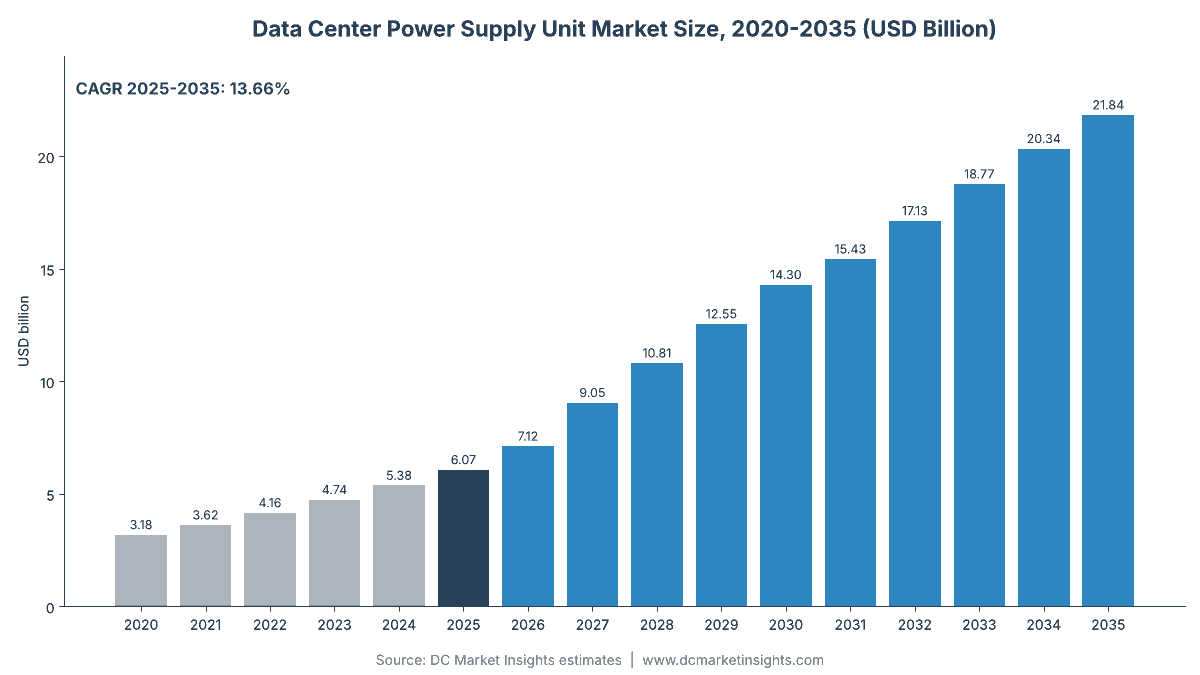
The Data Center Power Supply Unit Market is valued at USD 7.12 billion in 2026 and is projected to reach USD 21.84 billion by 2035, up from USD 6.07 billion in 2025, a compound annual growth rate (CAGR) of 13.66% from 2025 to 2035 (DC Market Insights estimate). The value in a power supply unit (PSU) is moving from the pair of small supplies inside each general-purpose server to the shelves that feed a whole artificial intelligence (AI) rack: an NVIDIA GB200 NVL72 rack draws about 120 kilowatts (kW) through 48 PSUs of 5.5 kW in eight power shelves, according to the NVIDIA DGX user guide. That is why DC Market Insights puts AI rack power at USD 375 per kW of IT load in 2025, against USD 150 per kW for conventional servers, and why AI rack power rises from 40.2% of spending in 2025 to 77.6% in 2035. The next step, 800-volt direct current (800 VDC) power racks, makes 800 VDC Power Racks and Converters the fastest-growing product line, and Middle East and Africa the fastest-growing region at 20.91% a year.
Key Market Statistics: How Big Is the Data Center Power Supply Unit Market in 2026?
DC Market Insights values the Data Center Power Supply Unit Market at USD 7.12 billion in 2026, 17.2% above 2025, as AI rack shipments rise from 6.51 gigawatts (GW) to 8.32 GW of IT load.
- Market size 2025: USD 6.07 billion
- Market size 2026: USD 7.12 billion
- Market size 2030: USD 14.30 billion
- Market size 2035: USD 21.84 billion
- CAGR 2025-2035: 13.66% in the base case, 11.18% in the low case and 15.48% in the high case
- Largest product type: conventional server PSUs, 46.6% of 2025 value (USD 2.83 billion)
- Fastest-growing product type: 800 VDC power racks and converters, from USD 13.53 million in 2025 to USD 14.55 billion in 2035
- Largest power rating: PSUs below 2 kW, 52.0% of 2025 value; units above 5.5 kW grow 27.58% a year
- Leading region: North America, 46.0% of 2025 value (USD 2.79 billion)
- Fastest-growing region: Middle East and Africa, 20.91% a year
- Largest country: the United States, USD 2.52 billion in 2025 (41.5% of global value)
- Market leader: Delta Electronics, about 33% of 2025 value (DC Market Insights assessment)
Executive Summary
The Global Data Center Power Supply Unit Market size was valued at USD 3.18 billion in 2020, reached USD 6.07 billion in 2025, and is anticipated to reach USD 21.84 billion by 2035, at a CAGR of 13.66% during the forecast period.
| Report attribute | Details |
|---|---|
| Historical Period | 2020-2024 |
| Base Year | 2025 |
| Forecast Period | 2026-2035 |
| Data Center Power Supply Unit Market Size 2025 | USD 6.07 Billion |
| Data Center Power Supply Unit Market Size 2026 | USD 7.12 Billion |
| Data Center Power Supply Unit Market, CAGR | 13.66% |
| Data Center Power Supply Unit Market Size 2035 | USD 21.84 Billion |
Data center PSU spending grew 13.79% a year from 2020 to 2025, but the two halves of the market moved very differently. Conventional server, storage and networking PSUs grew from USD 2.87 billion to USD 3.63 billion, while AI rack power shelves went from USD 312.00 million to USD 2.43 billion as accelerator racks moved from 1.04 GW to 6.51 GW of IT load shipped a year. Growth of 13.66% a year to 2035 rests on the AI side: conventional PSUs grow only 3.01% a year because unit prices fall as volumes rise, while AI rack power grows 21.38% a year to USD 16.96 billion. The switch from 54-volt shelves to 800 VDC power racks after 2027 adds content per kW, so the 800 VDC line overtakes the 54-volt shelf line in 2030.
Key Takeaways
Five figures explain where data center PSU spending goes between 2025 and 2035, with the reason behind each.
- The market reaches USD 21.84 billion by 2035, because each kW of AI rack load carries 2.5 times the PSU value of a kW of conventional servers.
- AI rack power rises from 40.2% to 77.6% of spending, because accelerator racks grow from 6.51 GW to 44.47 GW of IT load shipped a year.
- 800 VDC power racks and converters reach USD 14.55 billion in 2035, because NVIDIA ties full-scale 800 VDC production to its Kyber racks in 2027.
- PSUs above 5.5 kW grow 27.58% a year, because 12 kW supplies and 72 kW shelves replace 3 kW server supplies in AI halls.
- Conventional server PSUs grow only 3.01% a year, because European and US efficiency rules already require Titanium-level units and prices keep falling.
What Counts as a Data Center Power Supply Unit?
A data center power supply unit converts facility power into the direct current that servers, storage and network equipment use, and DC Market Insights values these units at USD 6.07 billion in 2025.
Included. Alternating current to direct current (AC-DC) PSUs inside general-purpose servers, mostly in the Common Redundant Power Supply (CRPS) form factor; PSUs in storage arrays and network switches; rack-level power shelves and their hot-swap PSUs for Open Compute Project (OCP) Open Rack V3 (ORv3) and NVIDIA MGX racks at 48 to 54 volts; and 800 VDC or plus/minus 400 VDC power racks (sidecars) with the rack-level DC-DC converters that step 800 volts down for the compute trays. Values are factory prices of the PSU hardware sold to server makers, original design manufacturers (ODMs) and data center operators.
Excluded. Uninterruptible power supply (UPS) systems, covered in the Data Center UPS Market; battery backup units (BBUs) inside power shelves, covered in the Data Center Battery Market; power distribution units (PDUs), busway and switchgear; voltage regulator modules and other board-level converters on the motherboard; power semiconductors sold on their own; and PSUs for personal computers, industrial or telecom equipment outside data centers.
How the segments fit together. Every segment table splits the same USD 6.07 billion of 2025 value. The product-type split is computed directly in the model from conventional and AI shipments; the power-rating and end-user splits divide the same total, and each split sums to the total in every year from 2020 to 2035.
Why Do Data Center Power Supply Unit Market Estimates Differ?
Public estimates for data center power supplies differ because some add UPS systems, PDUs and power semiconductors, while DC Market Insights counts USD 7.12 billion of 2026 spending on PSU hardware only.
Broader definitions add four things. First, facility power equipment such as UPS systems, PDUs and busway, which sit upstream of the PSU and are sized in their own reports. Second, battery backup units, which share the power shelf with the PSUs in many AI racks but store energy instead of converting it. Third, board-level voltage regulators and the gallium nitride (GaN) and silicon carbide (SiC) chips inside PSUs, which would count the same value twice if added to finished PSUs. Fourth, all switched-mode power supplies sold for computing, including desktop and industrial units. Each is a real market, but adding them would blur what a server maker or data center operator pays for the box that turns AC or 800 VDC into the voltage a server uses.
| Element | In this market? | Why |
|---|---|---|
| Server, storage and network PSUs | Yes (USD 3.63 billion in 2025) | Convert power inside IT equipment |
| AI rack power shelves (48-54 V) | Yes (USD 2.43 billion in 2025) | Convert power for a whole rack |
| 800 VDC power racks and converters | Yes (USD 13.53 million in 2025) | Convert power for a row of racks |
| UPS systems and PDUs | No | Facility power equipment |
| Battery backup units | No | Store energy |
| Power semiconductors and board-level regulators | No | Components or downstream converters |
Buyers inside the scope include hyperscale cloud providers, AI and graphics processing unit (GPU) cloud providers, enterprises and colocation tenants, and telecom and edge operators; servers in small and medium enterprise (SME) server rooms count under enterprise and colocation tenants. UPS systems, PDUs, BBUs, power semiconductors sold on their own and non-data-center PSUs stay outside the scope in every table.
Why Is Data Center PSU Spending Rising So Fast?
Data center PSU spending rises because AI racks carry far more power hardware per kW than general servers, and DC Market Insights expects AI rack power to grow from USD 2.44 billion in 2025 to USD 16.96 billion in 2035.
Rack-Scale NVIDIA Systems Put 48 PSUs in Every Rack
An NVIDIA GB200 NVL72 rack uses six air-cooled 5.5 kW PSUs in each of eight power shelves and consumes about 120 kW, according to the NVIDIA DGX GB200 user guide (revision of September 2026). That is 264 kW of PSU capacity for 120 kW of load, a ratio of 2.2, because each shelf runs with spare supplies. DC Market Insights therefore uses USD 375 of PSU content per kW of AI rack load in 2025, about USD 45,000 per 120 kW rack, against USD 150 per kW for conventional servers. AI racks shipped rise from 6.51 GW of IT load in 2025 to 8.32 GW in 2026.
The NVIDIA 800 VDC Architecture Creates a New Product Line
NVIDIA said in May 2025 that full-scale production of 800 VDC data centers will coincide with its Kyber rack-scale systems in 2027, and that the design improves end-to-end efficiency by up to 5% and cuts maintenance costs by up to 70%, according to its technical blog of 20 May 2025. NVIDIA named Delta, Flex, LITEON and Megmeet among its power component partners in October 2025. DC Market Insights models 800 VDC power racks and converters at USD 78.18 million in 2026, USD 822.41 million in 2027 and USD 6.17 billion in 2030, as their share of AI rack shipments rises from 2% to 60%.
Delta, Lite-On and Advanced Energy Report AI Power Growth
Delta Electronics reported record second-quarter 2026 revenue of NT$183.2 billion, up 48%, with Power Electronics revenue up 50%, and said that data center-related business made up more than half of its first-half revenue, according to its July 2026 results call. Advanced Energy reported Data Center Computing revenue of USD 587.3 million for 2025, up 107%, according to its results filed with the Securities and Exchange Commission (SEC) on 10 February 2026. Lite-On Technology said its Cloud and AIoT business grew more than 30% in 2025 and expects AI-related revenue to exceed 30% of the total in 2026. These results support the 17.2% rise DC Market Insights models from 2025 to 2026.
How Are Data Center PSU Designs Changing?
PSU ratings are rising from 3 kW to 5.5 kW and 12 kW per unit, and units above 5.5 kW grow from 17.0% of 2025 value to 54.0% in 2035 in the DC Market Insights model.
From 33 kW to 72 kW Power Shelves in the OCP Open Rack
A standard ORv3 power shelf holds six 5.5 kW PSUs for a maximum of 33 kW at above 97.5% efficiency, according to the Delta product listing on the OCP marketplace. The OCP Open Rack V3 High Power Rack (HPR) V2 specification, revision 1.0.0 of June 2026, doubles the PSU to 12 kW and the shelf to 72 kW, or 60 kW with one spare supply and dual cords. Shelves at this rating serve 100 kW to 200 kW racks without moving to 800 VDC, which keeps the 54-volt shelf line at USD 4.26 billion in 2027 before it gives way to 800 VDC racks.
Gallium Nitride and Silicon Carbide Raise Power Density
Navitas Semiconductor showed a 12 kW PSU for AI data centers and said in May 2025 that NVIDIA had selected it for the 800 VDC architecture. Infineon Technologies expects revenue from AI data center power of around EUR 2.5 billion in fiscal year 2027, up from around EUR 1.5 billion in fiscal 2026, according to its February 2026 release. Wide-bandgap chips let a 12 kW supply fit in the slot of a 5.5 kW unit, which is why DC Market Insights expects PSU prices per watt to fall from USD 0.13 in 2025 to USD 0.10 in 2035 while value per rack rises.
Power Makers Separate Their Data Center Businesses
Flex announced on 5 May 2026 that it intends to spin off its Cloud and Power Infrastructure segment and targets about 65% to 75% revenue growth for that business in fiscal 2027. Vertiv scheduled its 800 VDC power portfolio for the second half of 2026. Specialised data center power businesses can price and invest for AI racks rather than for broad industrial demand; the AI and GPU cloud provider segment grows fastest among buyers at 20.20% a year.
Market Restraints: What Limits Data Center PSU Growth?
Falling prices for conventional PSUs and uncertain 800 VDC timing restrain the market, and the DC Market Insights low case of USD 17.52 billion in 2035 shows the effect of a slower AI rack ramp.
Titanium Efficiency Is Already the Legal Floor for Servers
The European Union (EU) ecodesign rule for servers, Regulation (EU) 2019/424, has required single-output server PSUs to reach 90%, 94%, 96% and 91% efficiency at 10%, 20%, 50% and 100% load since 1 January 2023. The US ENERGY STAR Computer Servers Version 4.0 sets the same levels for supplies of 750 watts or more from 12 January 2024. With Titanium-level units already standard, buyers no longer pay a premium to upgrade efficiency, which holds conventional server PSUs to 3.01% a year, from USD 2.83 billion in 2025 to USD 3.81 billion in 2035.
800 VDC Volume Depends on Rack Launch Dates
Delta said in July 2026 that it would begin mass production of plus/minus 400 V and 800 V products in the third quarter of 2026, with meaningful volume next year, while Advanced Energy expects initial 800 V production revenue in late 2027 and a larger ramp in 2028, according to its August 2026 results call. A delay of one rack generation would cut 2028 spending sharply, since DC Market Insights puts 800 VDC at USD 2.48 billion that year. The low case assumes AI rack shipments 20% lower and prices 5% lower from 2027.
Where Are the Openings for Data Center PSU Suppliers?
The largest openings are 800 VDC power racks and AI campuses in the Gulf and India, worth USD 14.55 billion and USD 1.26 billion of 2035 value in the DC Market Insights model.
Sidecar Power Racks for 800 VDC Rows
Delta has shown a 1.1 megawatt (MW)-class in-row power rack that converts 400 to 480 volts AC into 800 VDC, and Lite-On said its 800 VDC power rack is in testing. At DC Market Insights content of USD 470 per kW in 2026, one 1.1 MW power rack with its downstream converters carries about USD 0.52 million of PSU hardware. The line grows from USD 13.53 million in 2025 to USD 14.55 billion in 2035, 66.6% of the market.
Gulf and Indian AI Campuses
Saudi Arabia grows from USD 60.71 million in 2025 to USD 502.27 million in 2035, 23.53% a year, and India from USD 121.43 million to USD 753.41 million, 20.02% a year. Both countries add AI capacity with rack-scale systems from the first hall and have a small installed base of older servers, which lifts growth above the 13.66% global rate.
How Much Does a Data Center Power Supply Cost per kW?
Data center PSU hardware costs about USD 150 per kW of IT load for conventional servers and USD 375 per kW for AI rack power shelves in 2025, according to DC Market Insights unit values.
| Year | Conventional servers (USD per kW of IT load) | AI rack power shelves (USD per kW) | 800 VDC racks and converters (USD per kW) | Typical PSU price (USD per watt of rating) |
|---|---|---|---|---|
| 2020 | 165 | 300 | Not shipped | 0.15 |
| 2025 | 150 | 375 | 520 (pilot units) | 0.13 |
| 2030 | 140 | 400 | 430 | 0.11 |
| 2035 | 132 | 360 | 385 | 0.10 |
No PSU maker publishes a price list, so these are DC Market Insights estimates built from rack designs. A GB200 NVL72 rack carries 264 kW of PSU rating for 120 kW of load, and a conventional server carries two redundant supplies rated at two to three times its draw. Advanced Energy said in August 2026 that 800 V racks are an opportunity to increase its content per rack, and Navitas puts power semiconductor content at about USD 55 per kW of GPU power in 2026, roughly one-seventh of the AI shelf price per kW.
Which Standards and Rules Apply to Data Center PSUs?
Six rules and specifications shape USD 6.07 billion of 2025 PSU spending, from EU efficiency law to OCP rack designs.
- Regulation (EU) 2019/424: ecodesign rule for servers and data storage; PSU efficiency of 90/94/96/91% at 10/20/50/100% load and power factor 0.95 at 50% load since 1 January 2023.
- ENERGY STAR Computer Servers Version 4.0: effective 12 January 2024; the same efficiency levels for single-output PSUs of 750 watts or more.
- 80 PLUS Titanium: the certification run by CLEAResult; 90/94/96/91% for 230-volt and 277-volt redundant data center PSUs.
- OCP Open Rack V3 power shelf specifications: 33 kW shelves with six 5.5 kW PSUs and the HPR V2 72 kW shelf with six 12 kW PSUs (revision 1.0.0, June 2026).
- NVIDIA 800 VDC architecture: published May 2025 and extended at the OCP Global Summit in October 2025; full-scale production with Kyber racks in 2027.
- IEC 62368-1: the International Electrotechnical Commission safety standard for information and communication technology equipment, which every data center PSU must pass.
Which Product Types Lead Data Center PSU Spending?
Conventional server PSUs lead with 46.6% of 2025 value, and 800 VDC power racks and converters become the largest product type by 2035 with 66.6%, according to DC Market Insights.
By Product Type: Conventional Server PSUs Lead with 46.6%
| Product type | 2025 (USD million) | Share 2025 | 2035 (USD million) | CAGR 2025-2035 |
|---|---|---|---|---|
| Conventional Server PSUs | 2,829.84 | 46.6% | 3,808.25 | 3.01% |
| Storage and Networking PSUs | 798.16 | 13.1% | 1,074.12 | 3.01% |
| AI Rack Power Shelves at 48-54 V | 2,429.84 | 40.0% | 2,401.59 | -0.12% |
| 800 VDC Power Racks and Converters | 13.53 | 0.2% | 14,554.08 | 100.98% |
| Total | 6,071.37 | 100.0% | 21,838.04 | 13.66% |
By Power Rating: PSUs Below 2 kW Lead with 52.0%
| PSU power rating | 2025 (USD million) | Share 2025 | 2035 (USD million) | CAGR 2025-2035 |
|---|---|---|---|---|
| Below 2 kW | 3,157.11 | 52.0% | 4,804.37 | 4.29% |
| 2 kW to 5.5 kW | 1,882.12 | 31.0% | 5,241.13 | 10.78% |
| Above 5.5 kW | 1,032.13 | 17.0% | 11,792.54 | 27.58% |
| Total | 6,071.37 | 100.0% | 21,838.04 | 13.66% |
By End User: Hyperscale Cloud Providers Lead with 48.0%
| End user | 2025 (USD million) | Share 2025 | 2035 (USD million) | CAGR 2025-2035 |
|---|---|---|---|---|
| Hyperscale Cloud Providers | 2,914.26 | 48.0% | 11,574.16 | 14.79% |
| AI and GPU Cloud Providers | 728.56 | 12.0% | 4,585.99 | 20.20% |
| Enterprise and Colocation Tenants | 1,821.41 | 30.0% | 4,149.23 | 8.58% |
| Telecom and Edge Operators | 607.14 | 10.0% | 1,528.66 | 9.67% |
| Total | 6,071.37 | 100.0% | 21,838.04 | 13.66% |
DC Exclusive: AI Rack Power Content Teardown — From USD 150 to USD 470 of PSU Hardware per kW
DC Market Insights built this teardown from 9 inputs taken from NVIDIA and OCP documents, supplier statements and its own unit values; it is a modelled estimate of the PSU hardware each rack design carries per kW of IT load.
| Rack design | PSU configuration | PSU rating per kW of load | PSU content, 2025 or first year | Source of configuration |
|---|---|---|---|---|
| Conventional server rack | Two redundant 1.6 kW CRPS units per server | 2.0 to 3.0 | USD 150 per kW | DC Market Insights unit value |
| ORv3 rack, 33 kW shelf | Six 5.5 kW PSUs, 27.5 kW with one spare | 1.2 per shelf | USD 300 to 350 per kW | OCP marketplace listing |
| GB200 NVL72 rack, about 120 kW | Eight shelves of six 5.5 kW PSUs (264 kW) | 2.2 | USD 375 per kW, about USD 45,000 per rack | NVIDIA DGX user guide |
| HPR V2 rack, 72 kW shelf | Six 12 kW PSUs, 60 kW with one spare and dual cords | 1.2 per shelf | USD 400 per kW (2030) | OCP HPR V2 specification |
| 800 VDC row with in-row power rack | 1.1 MW-class AC to 800 VDC rack plus DC-DC converters | About 1.2 | USD 470 per kW (2026) | Delta product release; DC Market Insights |
The teardown shows why PSU spending grows faster than server shipments. A kW of AI load carries 2.5 times the PSU value of a kW of general servers because of redundancy across shelves and the higher price of 5.5 kW and 12 kW units. The 800 VDC row adds another step, about USD 470 per kW in 2026, because conversion moves into a dedicated rack and a second converter stage in each compute tray. As volumes grow, the price per kW falls to USD 385 by 2035, but it stays above the 54-volt shelf.
Which Region Spends the Most on Data Center PSUs?
North America leads with 46.0% of 2025 value, or USD 2.79 billion, and Middle East and Africa is the fastest-growing region at 20.91% a year. Regions are counted where the equipment is installed, not where the PSU is made.
North America Leads with 46.0% Share
North American PSU spending rises from USD 2.79 billion in 2025 to USD 10.15 billion in 2035, a CAGR of 13.78%. The region installs the largest number of NVIDIA rack-scale systems, and its hyperscale and AI cloud campuses are expected to run the first 800 VDC rows from 2027.
Asia Pacific Holds 32.0% Share
Asia Pacific grows from USD 1.94 billion to USD 6.88 billion, 13.48% a year. China accounts for USD 789.28 million in 2025, mostly from domestic server makers and suppliers such as Great Wall Power and Huawei Digital Power, while Taiwan hosts the factories of Delta, Lite-On, Chicony Power and AcBel Polytech that ship to the rest of the world.
Europe Holds 14.5% Share
Europe grows from USD 880.35 million to USD 2.40 billion, 10.56% a year, the slowest of the five regions. Germany, the United Kingdom and France have large conventional server bases already at Titanium efficiency under Regulation (EU) 2019/424, so fewer new AI racks per installed kW hold back growth.
Middle East and Africa Is the Fastest-Growing Region at 20.91%
Middle East and Africa grows from USD 212.50 million to USD 1.42 billion as Saudi Arabia and the United Arab Emirates (UAE) build AI campuses with rack-scale systems from the first hall.
Latin America Holds 4.0% Share
Latin America grows from USD 242.85 million to USD 982.71 million, 15.00% a year, led by Brazil and Mexico, where cloud regions and colocation halls add AI racks.
Which Countries Spend the Most on Data Center PSUs?
The United States spends USD 2.52 billion on data center PSUs in 2025, 41.5% of the global total, and Saudi Arabia is the fastest-growing country in the top 12 at 23.53% a year.
| Rank | Country | 2025 (USD million) | 2035 (USD million) | CAGR 2025-2035 | Region |
|---|---|---|---|---|---|
| 1 | United States | 2,519.62 | 9,171.98 | 13.79% | North America |
| 2 | China | 789.28 | 2,511.37 | 12.27% | Asia Pacific |
| 3 | Japan | 218.57 | 742.49 | 13.01% | Asia Pacific |
| 4 | Germany | 200.36 | 524.11 | 10.09% | Europe |
| 5 | United Kingdom | 194.28 | 545.95 | 10.88% | Europe |
| 6 | Canada | 157.86 | 611.47 | 14.50% | North America |
| 7 | India | 121.43 | 753.41 | 20.02% | Asia Pacific |
| 8 | Australia | 121.43 | 436.76 | 13.66% | Asia Pacific |
| 9 | South Korea | 115.36 | 447.68 | 14.52% | Asia Pacific |
| 10 | France | 109.28 | 283.89 | 10.02% | Europe |
| 11 | Brazil | 97.14 | 414.92 | 15.63% | Latin America |
| 12 | Saudi Arabia | 60.71 | 502.27 | 23.53% | Middle East and Africa |
The United States stays the largest buyer through 2035, with its share rising slightly to 42.0% as AI racks concentrate there. India, at 20.02% a year, is the fastest-growing large country after Saudi Arabia, because new Indian AI capacity starts with high-rating shelves (DC Market Insights allocation).
How Could the 2035 Data Center PSU Forecast Change?
The 2035 market ranges from USD 17.52 billion to USD 25.60 billion around the USD 21.84 billion base case, depending on AI rack shipments and PSU prices from 2027.
| Scenario | 2035 (USD million) | CAGR 2025-2035 | Assumption |
|---|---|---|---|
| Low | 17,524.56 | 11.18% | AI rack shipments 20% lower and PSU prices 5% lower from 2027 |
| Base | 21,838.04 | 13.66% | Model as described |
| High | 25,600.46 | 15.48% | AI rack shipments 15% higher and PSU prices 5% higher from 2027 |
The low case follows a later 800 VDC ramp, in line with the late-2027 start Advanced Energy describes; the high case follows faster adoption of 12 kW supplies and 800 VDC rows, in line with the third-quarter 2026 production start Delta describes.
Who Are the Leading Data Center Power Supply Companies?
Delta Electronics leads with about 33% of 2025 value, and the top five suppliers hold about 74% (DC Market Insights assessment based on supplier results and named rack designs).
- Delta Electronics
- Lite-On Technology
- Advanced Energy Industries (Artesyn)
- Chicony Power Technology
- AcBel Polytech
- FSP Group
- Great Wall Power Supply Technology
- Huawei Digital Power
- Murata Manufacturing
- Flex
- Vertiv
- Megmeet Electrical
- Bel Fuse (Bel Power Solutions)
- Eaton
- Navitas Semiconductor (component partner)
The concentration estimate of about 74% combines Delta Electronics (about 33%), Lite-On Technology (about 20%), Advanced Energy (about 10%), Chicony Power (about 6%) and AcBel Polytech (about 5%). Delta reported 2025 revenue of NT$554.9 billion, up 32%, according to its annual report statement. Lite-On reported 2025 revenue of NT$166.1 billion, up 21%. Advanced Energy’s Data Center Computing revenue of USD 587.3 million in 2025 equals 9.7% of the DC Market Insights market, and the company expects at least 50% growth in 2026. Murata lists a 33 kW ORv3 power shelf on the OCP marketplace.
Recent Developments
Seven dated events from 2026 show supplier growth, new specifications and the move to 800 VDC.
- In February 2026, Infineon Technologies said it expects around EUR 2.5 billion of AI data center power revenue in fiscal 2027 (Source: Infineon).
- In February 2026, Advanced Energy reported 2025 Data Center Computing revenue of USD 587.3 million, up 107% (Source: Advanced Energy).
- In May 2026, Flex announced its intention to spin off its Cloud and Power Infrastructure segment (Source: Flex).
- In May 2026, Delta showed its 800 VDC in-row power rack with the NVIDIA MGX architecture (Source: Delta Electronics).
- In June 2026, the OCP published revision 1.0.0 of the Open Rack V3 HPR V2 72 kW power shelf specification (Source: Open Compute Project).
- In July 2026, Delta reported record quarterly revenue of NT$183.2 billion and set mass production of 800 V products for the third quarter (Source: Delta Electronics).
- In August 2026, Advanced Energy reported Data Center Computing revenue of USD 192 million for the second quarter, up 35% (Source: Advanced Energy).
Methodology: How DC Market Insights Sizes the Data Center Power Supply Unit Market
DC Market Insights sizes the market as IT load shipped each year multiplied by PSU content per kW, which gives USD 6.07 billion in 2025 and USD 21.84 billion in 2035.
The model in numbers: new data center IT capacity of 12.0 GW in 2025, 22 GW in 2030 and 27 GW in 2035, with an AI share of 35%, 60% and 66%; conventional IT load shipped equals new conventional capacity plus one-sixth of the installed conventional base for server refresh (24.19 GW in 2025, 36.99 GW in 2035); AI load shipped equals new AI capacity plus 22% of the installed AI base (6.51 GW in 2025, 44.47 GW in 2035). Content per kW is USD 150 for conventional equipment in 2025 (22% of it storage and networking), USD 375 for 54-volt AI shelves and USD 470 for 800 VDC racks in 2026, with the 800 VDC share of AI shipments rising from 0.4% in 2025 to 60% in 2030 and 85% in 2035. The same capacity and refresh logic is used in the Server Chassis Market, and the power path upstream of the PSU is sized in the Data Center Busway Market.
Three bound checks test the result. Ceiling one: USD 6.07 billion is 1.1% of the USD 570.04 billion DC Market Insights estimate of total 2025 data center infrastructure spend, in line with a component that is a small part of each server. Ceiling two: at power semiconductor content of 15% to 25% of the PSU price, the USD 3.32 billion of 2026 AI rack power implies USD 0.5 billion to USD 0.8 billion of chips, below the around EUR 1.5 billion Infineon alone expects from AI data center power in fiscal 2026. Floor: Advanced Energy’s Data Center Computing revenue of USD 587.3 million covers 9.7% of the 2025 market from the third-largest supplier. The full approach is described on the DC Market Insights research methodology page.
Table of contents
- 01Introduction
- 1.1Market Definition
- 1.2Historical Period, Base Year and Forecast Period
- 1.3Report Attributes
- 02Research Methodology
- 2.1The Shipment and Content-per-kW Model in Numbers
- 2.2Bound Checks: Total Infrastructure Spend Ceiling, Infineon Chip Ceiling and Advanced Energy Floor
- 03Executive Summary
- 3.1Market Snapshot, 2025, 2026 and 2035
- 3.2Key Market Statistics
- 3.3Key Takeaways
- 04What Counts as a Data Center Power Supply Unit?
- 4.1Included: Server, Storage and Network PSUs, AI Rack Power Shelves and 800 VDC Power Racks
- 4.2Excluded: UPS, Battery Backup Units, PDUs, Board-Level Regulators and Power Semiconductors
- 4.3How the Segments Fit Together
- 05Why Do Data Center Power Supply Unit Market Estimates Differ?
- 5.1UPS, Batteries, Chips and Non-Data-Center Supplies in Broader Definitions
- 5.2Scope Comparison: What Is In and Out
- 5.3Buyers Inside the Scope
- 06Market Drivers
- 6.1Rack-Scale NVIDIA Systems Put 48 PSUs in Every Rack
- 6.2The NVIDIA 800 VDC Architecture Creates a New Product Line
- 6.3Delta, Lite-On and Advanced Energy Report AI Power Growth
- 07Market Trends
- 7.1From 33 kW to 72 kW Power Shelves in the OCP Open Rack
- 7.2Gallium Nitride and Silicon Carbide Raise Power Density
- 7.3Power Makers Separate Their Data Center Businesses
- 08Market Restraints
- 8.1Titanium Efficiency Is Already the Legal Floor for Servers
- 8.2800 VDC Volume Depends on Rack Launch Dates
- 09Market Opportunities
- 9.1Sidecar Power Racks for 800 VDC Rows
- 9.2Gulf and Indian AI Campuses
- 10Pricing Analysis: Data Center PSU Cost per kW
- 10.1PSU Content per kW of IT Load, 2020-2035
- 10.2Price per Watt and Power Semiconductor Content
- 11Standards and Regulation
- 11.1Regulation (EU) 2019/424
- 11.2ENERGY STAR Computer Servers Version 4.0
- 11.380 PLUS Titanium
- 11.4OCP Open Rack V3 Power Shelf Specifications
- 11.5NVIDIA 800 VDC Architecture
- 11.6IEC 62368-1
- 12Data Center Power Supply Unit Market, By Product Type
- 12.1Conventional Server PSUs
- 12.2Storage and Networking PSUs
- 12.3AI Rack Power Shelves at 48-54 V
- 12.4800 VDC Power Racks and Converters
- 13Data Center Power Supply Unit Market, By Power Rating
- 13.1Below 2 kW
- 13.22 kW to 5.5 kW
- 13.3Above 5.5 kW
- 14Data Center Power Supply Unit Market, By End User
- 14.1Hyperscale Cloud Providers
- 14.2AI and GPU Cloud Providers
- 14.3Enterprise and Colocation Tenants
- 14.4Telecom and Edge Operators
- 15DC Exclusive: AI Rack Power Content Teardown
- 15.1Five Rack Designs from USD 150 to USD 470 per kW
- 15.2Why PSU Spending Grows Faster than Server Shipments
- 16Regional Insights
- 16.1North America
- 16.2Asia Pacific
- 16.3Europe
- 16.4Middle East and Africa
- 16.5Latin America
- 17Country Analysis
- 17.1United States
- 17.2China
- 17.3Japan
- 17.4Germany
- 17.5United Kingdom
- 17.6Canada
- 17.7India
- 17.8Australia
- 17.9South Korea
- 17.10France
- 17.11Brazil
- 17.12Saudi Arabia
- 18Forecast Scenarios, 2035
- 18.1Low Case
- 18.2Base Case
- 18.3High Case
- 19Competitive Insights
- 19.1Delta Electronics
- 19.2Lite-On Technology
- 19.3Advanced Energy Industries (Artesyn)
- 19.4Chicony Power Technology
- 19.5AcBel Polytech
- 19.6FSP Group
- 19.7Great Wall Power Supply Technology
- 19.8Huawei Digital Power
- 19.9Murata Manufacturing
- 19.10Flex
- 19.11Vertiv
- 19.12Megmeet Electrical
- 19.13Bel Fuse (Bel Power Solutions)
- 19.14Eaton
- 19.15Navitas Semiconductor (component partner)
- 20Recent Developments
- 20.1Dated Events, February to August 2026
- Fig. 1Data Center Power Supply Unit Market Size, 2020-2035 (USD Million)
- Table 1Report Attributes
- Table 2Scope Comparison
- Table 3PSU Content per kW and Price per Watt, 2020-2035
- Table 4Market by Product Type, 2025 and 2035
- Table 5Market by Power Rating, 2025 and 2035
- Table 6Market by End User, 2025 and 2035
- Table 7AI Rack Power Content Teardown
- Table 8Top 12 Countries, 2025 and 2035
- Table 9Forecast Scenarios, 2035
About this report
Written by Amit Jain and reviewed by Deepti Agrawal, Senior Editor, Research. Figures are built top-down and bottom-up and reconciled before publication, with 2025 as the base year.
Read our methodologyHow we built this
- Historical period2020-2024
- Base year2025
- Forecast period2026-2035
- Sizing approachTop-down + bottom-up
Need more than the report?
Advisory on this market
Due diligence, site selection and market entry work, by the analysts who wrote this report.
See consulting servicesFrequently asked questions
USD 7.12 billion in 2026, up 17.2% from USD 6.07 billion in 2025, according to DC Market Insights estimates. The market is projected to reach USD 21.84 billion by 2035, a CAGR of 13.66% from 2025.
13.66% a year from 2025 to 2035, after 13.79% a year from 2020 to 2025, because AI racks carry 2.5 times the PSU value per kW of conventional servers and their shipments grow almost sevenfold.
USD 6.07 billion of 2025 spending went to units that convert facility power into the direct current servers, storage and switches use. AI racks group them in power shelves; 800 VDC designs move conversion into separate power racks.
46.6% of 2025 value, or USD 2.83 billion, goes to conventional server PSUs. 800 VDC power racks and converters grow fastest and reach USD 14.55 billion, 66.6% of the market, by 2035 (DC Market Insights estimate).
About USD 150 per kW of IT load for conventional servers and USD 375 per kW for AI rack power shelves in 2025, and USD 470 per kW for 800 VDC racks in 2026 (DC Market Insights unit values).
48 PSUs of 5.5 kW in eight power shelves feed an NVIDIA GB200 NVL72 rack that draws about 120 kW, according to NVIDIA. That is 264 kW of PSU rating, about USD 45,000 of hardware per rack (DC Market Insights).
USD 14.55 billion of 2035 PSU spending goes to 800 VDC power racks and converters in the DC Market Insights model. NVIDIA plans full-scale 800 VDC production with Kyber racks in 2027, citing up to 5% better efficiency.
46.0% of 2025 value, or USD 2.79 billion, is spent in North America. Middle East and Africa grows fastest at 20.91% a year, and Saudi Arabia is the fastest-growing country in the top 12 at 23.53%.
About 33% of 2025 value is held by Delta Electronics (DC Market Insights assessment). Lite-On Technology, Advanced Energy, Chicony Power and AcBel Polytech follow; the top five hold about 74%.
USD 7.12 billion in 2026 is the DC Market Insights figure for PSU hardware only. Estimates that add UPS systems, PDUs, battery backup units, power semiconductors or non-data-center power supplies are larger.
Licences, delivery and payment
Which licence should I choose?
Single User is a view-only PDF for one person. Multi User adds a printable PDF and the Excel data for unlimited users at one location. Enterprise covers your whole company and includes 100 free analyst hours.
How and when will I receive the report?
By email, within 24–48 business hours of payment, in the formats of your licence.
How can I pay?
Securely through PayPal: with a PayPal account, a debit or credit card, or PayPal Pay Later where available. Prices are in US dollars.
Can I see a sample first?
Yes. Request a free sample and we will email it to you.
Can the report be tailored to my needs?
Yes. We can add countries, segments or data cuts. Talk to an analyst about the scope you need.
Can I get an invoice or pay against a purchase order?
Write to sales@dcmarketinsights.com and our team will help.