
Data Center Rear Door Heat Exchanger Market Size, Share & Forecast to 2035
Market at a glance
The Data Center Rear Door Heat Exchanger market was worth USD 395.3 million in 2025 and is forecast to reach USD 1,020.0 million by 2035, growing at a 25.29% CAGR.
 By Amit Jain, Senior Consultant, ICT & Emerging Technologies
 Reviewed by Deepti Agrawal
Last updated 20 Oct 2026
Base year 2025 PDF + Excel
What is inside the report
- 01Introduction
- 02Executive Summary
- 03Market Scope
- 04Market Drivers
- 05Market Trends
- 06Market Challenges
- 07Market Opportunities
- 08Pricing
- 09Standards and Regulation
- 10Market Segmentation
- 18chapters
- 2020-2024Historical period
- 2026-2035Forecast period
- —Companies profiled
Segmentation
Full analysis
The Data Center Rear Door Heat Exchanger Market is valued at USD 495.48 million in 2026 and is projected to reach USD 1.02 billion by 2035, up from USD 395.34 million in 2025, a CAGR of 9.96% from 2025 to 2035 (DC Market Insights estimate). The money follows one mismatch: colocation halls built for room air are now asked to host tenant racks of 40 to 75 kW, and a coil that bolts onto the back of the rack and takes chilled water is the only fix that needs no change to the servers or the room; Schneider Electric’s Motivair ChilledDoor, part of the liquid cooling portfolio it launched in September 2025, is rated for racks up to 75 kW. Fan energy is the second lever: according to the American Society of Heating, Refrigerating and Air-Conditioning Engineers (ASHRAE) Technical Committee 9.9, server fans draw 10% to 20% of rack power, at least 5 kW in a 50 kW rack, and an Open Compute Project (OCP) door design cut fan power by 55%. In 2025 buyers took about 774 MW of door cooling capacity at USD 480 per kW: USD 168.48 million for new air-cooled halls, USD 80.64 million for the air-side heat of liquid-cooled artificial intelligence (AI) racks, USD 122.50 million for retrofits and USD 23.72 million for controls and service. Doors for racks above 60 kW grow fastest at 17.52% a year, and the Middle East and Africa is the fastest region at 13.51% a year as Saudi Arabia and the United Arab Emirates fill new AI halls.
Key Market Statistics: How Big Is the Data Center Rear Door Heat Exchanger Market in 2026?
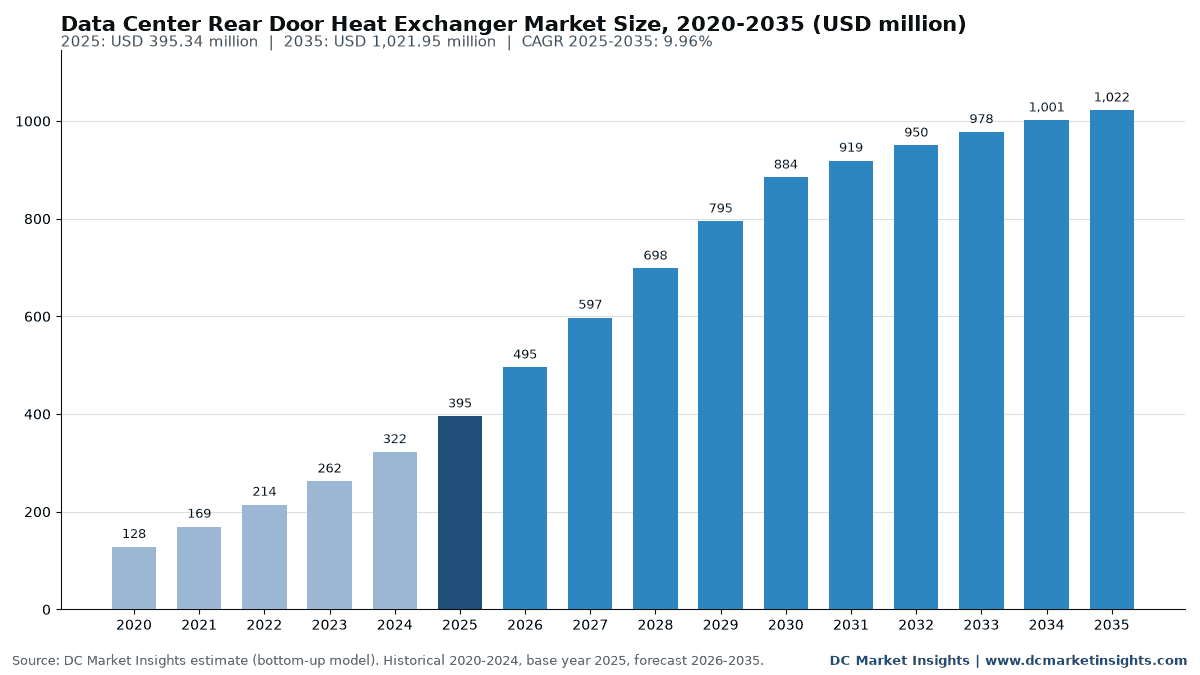
DC Market Insights values the Data Center Rear Door Heat Exchanger Market at USD 495.48 million in 2026, 25.33% above the USD 395.34 million of 2025.
- Market size 2025: USD 395.34 million; 2026: USD 495.48 million; 2030: USD 884.50 million; 2035: USD 1.02 billion.
- CAGR 2025-2035: 9.96% in the base case; the 2035 range runs from USD 814.81 million (low, 7.50%) to USD 1.25 billion (high, 12.20%).
- Door cooling capacity sold: about 774 MW in 2025, rising to about 2,334 MW in 2035, at an average installed price of USD 480 per kW in 2025.
- Largest product type: active (fan-assisted) rear door heat exchangers, USD 260.92 million or 66.0% of 2025.
- Fastest capacity band: doors for racks above 60 kW, 17.52% a year to USD 357.68 million in 2035.
- Retrofit of existing halls: USD 122.50 million in 2025 (31.0%), growing 11.15% a year.
- Leading region: North America, USD 158.14 million (40.0%) in 2025; fastest region: Middle East and Africa, 13.51% a year.
- Largest country: United States, USD 144.30 million in 2025; fastest large country: India, 15.73% a year.
- Five suppliers (Vertiv, Schneider Electric through Motivair, nVent, Legrand through USystems and Stulz) hold about 55% of 2025 spend, a DC Market Insights estimate.
How Fast Has Rear Door Heat Exchanger Spending Grown Since 2020?
The Global Data Center Rear Door Heat Exchanger Market size was valued at USD 128.05 million in 2020, reached USD 395.34 million in 2025, and is anticipated to reach USD 1.02 billion by 2035, at a CAGR of 9.96% during the forecast period.
| Attribute | Details |
|---|---|
| Historical period | 2020-2024 |
| Base year | 2025 |
| Forecast period | 2026-2035 |
| Market size 2025 | USD 395.34 million |
| Market size 2026 | USD 495.48 million |
| CAGR 2025-2035 | 9.96% |
| Market size 2035 | USD 1.02 billion |
| CAGR 2020-2025 | 25.29% |
Spending tripled between 2020 and 2025, a 25.29% yearly rate, because rack densities in colocation halls moved past the 20 kW that room air handles comfortably, and AI clusters added doors to catch the heat that cold plates leave in the air. Growth slows to 9.96% a year after 2025 because direct-to-chip liquid cooling takes a larger share of each AI rack, so the door handles a smaller residual load: 25% of rack heat in 2025, 17% in 2035. Door prices also fall from USD 480 to USD 405 per kW as volumes rise. Even so, door capacity sold triples from 774 MW to 2,334 MW a year.
What Counts as a Data Center Rear Door Heat Exchanger?
This market counts USD 395.34 million of 2025 spend on water- or refrigerant-cooled coils mounted in the rear door of a data center rack, with their fans, valves, sensors, controls, installation and service.
Included
- Active rear door heat exchangers with their own fans (typically 30 to 90 kW per rack).
- Passive rear door heat exchangers that use the server fans (typically up to 30 kW per rack).
- Refrigerant-based rear door coolers and pumped-refrigerant door units.
- Door controls, flow valves, leak and temperature sensors sold with the door, plus installation, commissioning and service contracts.
- Doors sold for new air-cooled halls, for liquid-cooled AI racks (capturing the residual air-side heat) and as retrofits on existing racks.
Excluded
- Coolant distribution units (CDUs) and their pumps, which DC Market Insights covers in its own CDU pumps report.
- Chillers, dry coolers and cooling towers that reject the heat outside the building.
- Perimeter computer room air handlers (CRAH), in-row coolers and fan walls.
- Cold plates, manifolds and immersion tanks for direct liquid cooling.
- Racks and cabinets themselves, and facility water piping beyond the door connection.
How Do the Rear Door Segments Fit Together?
Each door is counted once, in four views that each add up to USD 395.34 million: by product type (active, passive, refrigerant), by cooling capacity per rack (up to 30 kW, 31 to 60 kW, above 60 kW), by deployment (new air-cooled halls, AI and liquid-cooled halls, retrofit, controls and service) and by data center type (colocation, hyperscale and AI cloud, enterprise, HPC and research).
Why Do Rear Door Heat Exchanger Market Estimates Differ?
Estimates differ because they draw the boundary in different places: DC Market Insights counts USD 495.48 million in 2026 for rear doors and their controls and service only.
Broader definitions add the coolant distribution units that feed the doors, the facility chilled-water plant, or the whole “liquid cooling” category including cold plates and immersion tanks, and some add rear doors sold to telecom shelters and industrial enclosures. Each of those additions can double or triple the figure. Small and mid-sized enterprises and research centres are in scope here when they buy doors for their own server rooms.
| Element | Counted here | Why |
|---|---|---|
| Active and passive rear doors | Yes, USD 371.62 million in 2025 | The core product |
| Refrigerant rear door coolers | Yes, USD 23.72 million | Same rack-level job with a different medium |
| Controls, monitoring and service | Yes, inside the two rows above (USD 23.72 million) | Sold with the door |
| Coolant distribution units | No | Covered in a separate DC Market Insights report |
| Cold plates and immersion tanks | No | Different cooling method |
| Chillers and dry coolers | No | Facility heat rejection, not rack cooling |
So coolant distribution units, cold plates, immersion cooling, chillers and telecom enclosure coolers sit outside this market, even though they often appear in the same purchase order as the doors.
Why Are Data Centers Buying More Rear Door Heat Exchangers?
Three forces lifted rear door spending from USD 128.05 million in 2020 to USD 395.34 million in 2025: denser tenant racks in air-cooled halls, the air-side heat left by liquid-cooled AI racks, and fan energy that operators now have to report.
Colocation Tenants Bring 40 to 75 kW Racks into Air-Cooled Halls
Door ratings have moved up with tenant racks. Schneider Electric’s Motivair ChilledDoor cools racks up to 75 kW (Schneider Electric, September 2025); Legrand’s USystems ColdLogik CL20 is rated 93 kW at 14 °C inlet water, and its CL23 HPC rear door cooler 204 kW (Legrand). Schneider Electric paid USD 850 million in cash for an initial 75% of Motivair and completed the deal on 28 February 2025, with the remaining 25% due in 2028 (Schneider Electric). DC Market Insights counts USD 150.23 million of 2025 door spend in colocation, 38.0% of the market.
Liquid-Cooled AI Racks Still Leave Heat in the Air
Cold plates take most, but not all, of the heat of an AI rack. NVIDIA’s DGX GB200 user guide puts rack power at about 120 kW and states that only the compute trays are liquid cooled, while networking, storage and power supplies stay air cooled (NVIDIA, September 2026). DC Market Insights puts that air-side share at 25% of AI rack heat in 2025, falling to 17% in 2035, and doors on these racks add USD 80.64 million in 2025, rising to USD 220.84 million in 2035 at 10.60% a year. Vertiv’s MegaMod HDX modular liquid cooling system, launched in January 2026 for 50 kW to more than 100 kW per rack, lists its CoolLoop RDHx rear door heat exchanger among the rack products it pairs with (Vertiv, January 2026).
Server Fans Use 10% to 20% of Rack Power
ASHRAE Technical Committee 9.9 states that server fans take 10% to 20% of server power, at least 5 kW in a 50 kW rack (ASHRAE). An OCP white paper written by Meta, Rittal, nVent and Boyd found that a door heat exchanger matched to the Open Rack version 3 (ORv3) frame can cut fan power by 55%, and that a 30 kW rack can be cooled with 30 °C supply water (OCP, 2023). That matters more since the European Union (EU) made data centres above 500 kW report their energy and cooling data under Delegated Regulation (EU) 2024/1364 of 14 March 2024 (European Commission).
How Is Rear Door Cooling Technology Changing?
Doors are moving to warmer water, wider OCP adoption and factory-built liquid cooling modules, and each shift raises the average door rating above the 31 to 60 kW band that held 44.0% of 2025 spend.
Warmer Facility Water Cuts Door Capacity by a Third
nVent rates its RDHX Pro door at 68 kW with 14 °C water but 44 kW with 24 °C water, 35% less (nVent). ASHRAE renamed its facility water classes W17, W27, W32, W40, W45 and W+ (ASHRAE), and operators that move to W32 or W40 water to run chillers less need more door area per kW, which keeps the price per kW from falling faster than 1.7% a year.
OCP Door Heat Exchanger Requirements for Open Rack
The OCP “ACS Door Heat Exchanger Requirements for Open Rack” Revision 1.0 of 15 June 2021, written by Facebook and nVent, covers passive and active doors, sets a preferred maximum depth of 305 mm and requires N+1 fan redundancy on active doors (Open Compute Project). Hyperscale and AI cloud buyers that build on Open Rack drive the fastest data center type in this market, at 12.65% a year.
Factory-Built Liquid Cooling Modules Bundle the Door
Suppliers now ship doors inside prefabricated cooling modules: Vertiv’s MegaMod HDX pairs coolant distribution units, piping and rear doors for 50 kW to more than 100 kW racks (Vertiv, January 2026). Bundling moves part of door spend into module contracts, which DC Market Insights still counts here when the door is priced in the order.
What Holds Back Rear Door Heat Exchanger Demand?
Two limits cap the market at about USD 1.02 billion in 2035: water in the white space, and direct-to-chip cooling that takes a larger share of each AI rack.
Water at the Rack Raises Leak and Derating Risk
A rear door puts a water coil on every rack, so operators add leak sensors, drip trays and isolation valves; controls, monitoring and service already reach USD 23.72 million or 6.0% of 2025 spend. Capacity also drops when water is warmer, by 35% on nVent’s RDHX Pro between 14 °C and 24 °C water (nVent), so a door sized for a cold-water chiller plant may fall short after an efficiency upgrade.
Fully Liquid-Cooled AI Racks Shrink the Air-Side Load
NVIDIA states that its Rubin generation of AI infrastructure is the first to reach 100% liquid cooling (NVIDIA, June 2026). Where racks reach that point, a door is no longer needed for the rack itself, which is why DC Market Insights lowers the air-side share of AI rack heat from 25% to 17% by 2035 and the low scenario gives only USD 814.81 million in 2035.
Where Will New Rear Door Revenue Come From by 2035?
The two largest openings are retrofits of existing halls, worth USD 352.67 million a year by 2035, and Asia Pacific, which adds about USD 197.54 million of yearly spend.
Retrofit of Existing Halls: USD 122.50 million to USD 352.67 million
About 0.22% of installed IT capacity received doors in 2025, about 255 MW of the 116 GW base, and DC Market Insights expects 0.28% of a 311 GW base by 2035. A door needs only a water connection at the rack, so an operator can host 40 kW racks in a hall built for room air without replacing the computer room air handlers counted in the Data Center Precision Air Conditioning Market.
Asia Pacific Factories and Halls: USD 98.83 million to USD 296.37 million
Vertiv opened a manufacturing plant in Johor, Malaysia in July 2026 for cooling systems including direct-to-chip and rear door heat exchangers, with full operation planned for 2027 (Vertiv). Local supply cuts lead times for Asia Pacific, which grows 11.61% a year, faster than North America’s 9.11%.
How Much Does a Rear Door Heat Exchanger Cost per kW?
DC Market Insights puts the average installed price of a data center rear door heat exchanger at USD 480 per kW of cooling capacity in 2025, down from USD 540 in 2020; at the USD 520 per kW of an active door, a 40 kW door costs about USD 20,800 installed.
| Item | 2020 | 2025 | 2030 | 2035 |
|---|---|---|---|---|
| Average installed price, USD per kW | 540 | 480 | 435 | 405 |
| Door capacity sold, MW | 225 | 774 | 1,891 | 2,334 |
| Market size | USD 128.05 million | USD 395.34 million | USD 884.50 million | USD 1.02 billion |
| Controls, monitoring and service share | 5.0% | 6.0% | 7.0% | 7.5% |
The oldest public anchor is a United States Department of Energy (DOE) Federal Energy Management Program (FEMP) demonstration at Lawrence Berkeley National Laboratory (LBNL), where each passive door for a 10 to 11 kW rack cost USD 6,000 plus installation, about USD 545 to USD 600 per kW, and six doors removed about 48% of server waste heat (DOE FEMP). Passive doors, which rely on the server fans and have no fans of their own, cost about USD 380 per kW and top out near 30 kW per rack; active doors with electronically commutated fans cost about USD 520 per kW and reach 60 to 90 kW per rack. Prices fall about 1.7% a year to 2035 because coil and fan assemblies move to higher volume lines, while the share of controls, monitoring and service rises from 6.0% to 7.5% as operators connect doors to building management systems.
Which Standards Apply to Data Center Rear Door Heat Exchangers?
Seven rules shape door design and buying in 2026, from ASHRAE water classes to the EU data centre rating scheme for sites above 500 kW.
- ASHRAE Technical Committee 9.9 liquid cooling guidance: facility water classes W17, W27, W32, W40, W45 and W+, all with a 2 °C lower limit (ASHRAE).
- ANSI/ASHRAE Standard 90.4-2025, Energy Standard for Data Centers, which sets the mechanical load limits that doors help meet (ASHRAE).
- OCP ACS Door Heat Exchanger Requirements for Open Rack, Revision 1.0 (June 2021): passive and active doors, 305 mm preferred depth, N+1 fans on active doors (Open Compute Project).
- IEC 62610-4, the International Electrotechnical Commission (IEC) standard whose test conditions the OCP requirement names for rated door capacity.
- Directive (EU) 2023/1791 on energy efficiency and Delegated Regulation (EU) 2024/1364, which require data centres of 500 kW or more to report energy and cooling indicators (European Commission).
- The European Commission proposal of 21 September 2026 for a common data centre rating scheme for sites above 500 kW that also covers waste heat reuse (European Commission).
- Singapore’s SS 697 tropical data centre standard, which states 2% to 5% cooling energy savings for every 1 °C rise in operating temperature (Infocomm Media Development Authority, IMDA).
Which Rear Door Heat Exchanger Segment Earns the Most?
Active rear door heat exchangers earn the most, USD 260.92 million or 66.0% of 2025 spend, and their share rises to 72% by 2035 as racks pass 40 kW.
By Product Type
| Product Type | 2025 (USD million) | Share 2025 | 2035 (USD million) | CAGR 2025-2035 |
|---|---|---|---|---|
| Active Rear Door Heat Exchangers | USD 260.92 million | 66.0% | USD 735.80 million | 10.92% |
| Passive Rear Door Heat Exchangers | USD 110.70 million | 28.0% | USD 224.83 million | 7.34% |
| Rear Door Chiller and Refrigerant Doors | USD 23.72 million | 6.0% | USD 61.32 million | 9.96% |
Passive doors grow only 7.34% a year because their 30 kW ceiling sits below most new AI and high-density colocation racks. Refrigerant-based rear door coolers stay near 6% of spend, used where operators will not bring water to the white space.
By Cooling Capacity per Rack
| Cooling Capacity per Rack | 2025 (USD million) | Share 2025 | 2035 (USD million) | CAGR 2025-2035 |
|---|---|---|---|---|
| Up to 30 kW | USD 150.23 million | 38.0% | USD 204.39 million | 3.13% |
| 31 to 60 kW | USD 173.95 million | 44.0% | USD 459.88 million | 10.21% |
| Above 60 kW | USD 71.16 million | 18.0% | USD 357.68 million | 17.52% |
Doors for racks above 60 kW grow 17.52% a year, from 18.0% to 35% of spend, while doors up to 30 kW grow only 3.13% a year.
By Deployment
| Deployment | 2025 (USD million) | Share 2025 | 2035 (USD million) | CAGR 2025-2035 |
|---|---|---|---|---|
| New-Build Air-Cooled Halls | USD 168.48 million | 42.6% | USD 371.79 million | 8.24% |
| AI and Liquid-Cooled Halls (Residual Heat) | USD 80.64 million | 20.4% | USD 220.84 million | 10.60% |
| Retrofit of Existing Halls | USD 122.50 million | 31.0% | USD 352.67 million | 11.15% |
| Controls Monitoring and Service | USD 23.72 million | 6.0% | USD 76.65 million | 12.44% |
Retrofit of existing halls is the fastest equipment line at 11.15% a year: a door bolts onto an existing rack and needs only a water loop, so operators can host 40 kW racks in a hall built for room air without rebuilding the room air system.
By Data Center Type
| Data Center Type | 2025 (USD million) | Share 2025 | 2035 (USD million) | CAGR 2025-2035 |
|---|---|---|---|---|
| Colocation | USD 150.23 million | 38.0% | USD 419.00 million | 10.80% |
| Hyperscale and AI Cloud | USD 86.97 million | 22.0% | USD 286.15 million | 12.65% |
| Enterprise | USD 94.88 million | 24.0% | USD 173.73 million | 6.24% |
| HPC and Research | USD 63.26 million | 16.0% | USD 143.07 million | 8.50% |
Colocation is the largest buyer at USD 150.23 million because providers must take tenants’ high-density racks into halls designed for air; hyperscale and AI cloud grows fastest at 12.65% a year as doors capture the air-side heat of liquid-cooled racks.
DC Exclusive: Rack Density Break-Even Ladder, Where a USD 480-per-kW Door Wins and Where Direct-to-Chip Takes Over
This DC Market Insights model, built from 9 inputs (door price per kW by type, door capacity limits, the air-side heat share of liquid-cooled AI racks and rack power steps), shows that the rear door is the cheapest way to cool racks from 25 to about 80 kW, and becomes a residual-heat device above that.
| Rack density | Cooling choice | Door needed | Door cost, installed (2025) | Cost per kW of door | Buyer note |
|---|---|---|---|---|---|
| 15 kW | Room air (CRAH) or passive door | Passive, 15 kW | USD 5,700 | USD 380 | Door optional; room air still works |
| 25 kW | Passive door | Passive, 25 kW | USD 9,500 | USD 380 | Door removes hot spots without new fans |
| 40 kW | Active door | Active, 40 kW | USD 20,800 | USD 520 | Room air alone would need hot-aisle containment and more CRAH |
| 60 kW | Active door | Active, 60 kW | USD 31,200 | USD 520 | Upper range for most doors on the market |
| 80 kW | High-capacity active door or direct-to-chip | Active, 80 kW | USD 41,600 | USD 520 | Break-even with direct-to-chip plus a small door |
| 132 kW (AI rack) | Direct-to-chip plus door for residual heat | Active, 26 kW (20% of rack heat) | USD 13,520 | USD 102 per kW of rack load | Door handles only the air-side remainder |
The ladder explains the segment shifts shown above. Below 25 kW, a passive door at USD 380 per kW competes with room air that the hall already has, which is why doors up to 30 kW grow only 3.13% a year. Between 40 and 80 kW, an active door at USD 520 per kW is the only rack-level option that needs no change to the servers, which is why the 31 to 60 kW band holds 44.0% of 2025 spend. At AI rack power, cold plates take about 80% of the heat and the door shrinks to about 26 kW, so the spend per kW of rack load falls to about USD 102, but the number of AI racks grows fast enough to lift the AI and liquid-cooled hall segment by 10.60% a year.
Which Region Spends the Most on Rear Door Heat Exchangers?
North America spends the most, USD 158.14 million or 40.0% of 2025, and the Middle East and Africa grows fastest at 13.51% a year.
| Region | 2025 (USD million) | Share 2025 | 2035 (USD million) | CAGR 2025-2035 |
|---|---|---|---|---|
| North America | USD 158.14 million | 40.0% | USD 378.12 million | 9.11% |
| Europe | USD 106.74 million | 27.0% | USD 255.49 million | 9.12% |
| Asia Pacific | USD 98.83 million | 25.0% | USD 296.37 million | 11.61% |
| Latin America | USD 15.81 million | 4.0% | USD 35.77 million | 8.51% |
| Middle East and Africa | USD 15.82 million | 4.0% | USD 56.20 million | 13.51% |
North America
North America grows from USD 158.14 million to USD 378.12 million at 9.11% a year. Vertiv is investing about USD 50 million to expand its Ironton, Ohio plant for liquid cooling and chilled water systems, operational in the second quarter of 2027 (Vertiv, March 2026), and the United States alone buys USD 144.30 million of doors in 2025.
Europe
Europe grows from USD 106.74 million to USD 255.49 million at 9.12% a year. Reporting under Delegated Regulation (EU) 2024/1364 for sites of 500 kW or more, and the September 2026 rating scheme proposal, push operators to cut fan and chiller energy; Germany’s Energy Efficiency Act (Energieeffizienzgesetz, EnEfG) section 11 requires new data centres opening from 1 July 2026 to reach a PUE of 1.2 or less and to reuse at least 10% of their energy (EnEfG), which favours doors that run on warm water; Germany is the largest European buyer at USD 23.72 million.
Asia Pacific
Asia Pacific grows from USD 98.83 million to USD 296.37 million at 11.61% a year. China’s National Development and Reform Commission (NDRC) set a power usage effectiveness (PUE) target of 1.25 or lower for new large data centers by the end of 2025 (NDRC, July 2024), and India, at 15.73% a year, is the fastest large country in this market.
Latin America
Latin America grows from USD 15.81 million to USD 35.77 million at 8.51% a year, the slowest region, because most halls in Brazil, Mexico and Chile still run 10 to 20 kW racks on room air and buy doors only for single high-density rows.
Middle East and Africa
The Middle East and Africa grows from USD 15.82 million to USD 56.20 million at 13.51% a year, the fastest region, with Saudi Arabia rising from USD 4.74 million to USD 22.48 million as AI campuses open with chilled-water plant that doors can use from day one.
Which Countries Buy the Most Rear Door Heat Exchangers?
The United States buys the most, USD 144.30 million or 36.5% of global 2025 spend, and India is the fastest large country at 15.73% a year.
| Rank | Country | Region | 2025 (USD million) | 2035 (USD million) | CAGR 2025-2035 |
|---|---|---|---|---|---|
| 1 | United States | North America | USD 144.30 million | USD 337.24 million | 8.86% |
| 2 | China | Asia Pacific | USD 34.39 million | USD 91.98 million | 10.34% |
| 3 | Germany | Europe | USD 23.72 million | USD 56.21 million | 9.01% |
| 4 | United Kingdom | Europe | USD 19.77 million | USD 45.99 million | 8.81% |
| 5 | Japan | Asia Pacific | USD 17.79 million | USD 45.99 million | 9.96% |
| 6 | France | Europe | USD 13.84 million | USD 32.70 million | 8.98% |
| 7 | India | Asia Pacific | USD 11.86 million | USD 51.10 million | 15.73% |
| 8 | Netherlands | Europe | USD 11.46 million | USD 25.55 million | 8.35% |
| 9 | Canada | North America | USD 9.88 million | USD 28.61 million | 11.22% |
| 10 | Australia | Asia Pacific | USD 9.49 million | USD 25.55 million | 10.41% |
| 11 | Singapore | Asia Pacific | USD 7.91 million | USD 20.44 million | 9.96% |
| 12 | Saudi Arabia | Middle East and Africa | USD 4.74 million | USD 22.48 million | 16.84% |
India grows from USD 11.86 million to USD 51.10 million because its new colocation halls take AI racks before liquid-cooling plant is in place, and doors are the quickest fix. Saudi Arabia grows 16.84% a year from a small base of USD 4.74 million.
What Could the Rear Door Heat Exchanger Market Be Worth in 2035?
DC Market Insights puts the 2035 range at USD 814.81 million to USD 1.25 billion, with a base case of USD 1.02 billion.
| Scenario | 2035 size | CAGR 2025-2035 | What drives it |
|---|---|---|---|
| Low | USD 814.81 million | 7.50% | Direct-to-chip cooling reaches 90% of AI rack heat by 2030, so doors on AI racks shrink; retrofit share stays at 0.22% of installed MW a year |
| Base | USD 1.02 billion | 9.96% | Air-side residual falls from 25% to 17% of AI rack heat; door coverage of new air-cooled MW rises from 4.5% to 10% |
| High | USD 1.25 billion | 12.20% | Colocation providers standardise doors for 40-80 kW tenant racks; retrofit share rises to 0.40% of installed MW a year |
Who Are the Leading Rear Door Heat Exchanger Suppliers?
Five suppliers hold about 55% of 2025 spend, a DC Market Insights estimate based on rated door ranges, regional reach and announced orders: Vertiv about 15%, Schneider Electric through Motivair about 13%, nVent about 10%, Legrand through USystems about 9% and Stulz about 8%.
- Vertiv (CoolLoop RDHx)
- Schneider Electric (Motivair ChilledDoor)
- nVent (RDHX Pro)
- Legrand (USystems ColdLogik)
- Stulz (CyberRack Active Rear Door)
- Rittal
- Airedale by Modine
- Boyd
- CoolIT Systems
- Nortek Data Center Cooling
- Delta Electronics
- Eaton
- Daikin Applied
- Trane Technologies
Rated capacity separates the leaders: Legrand’s ColdLogik CL20 is rated 93 kW at 14 °C and was verified at 106 kW on site (Legrand); Schneider Electric’s ChilledDoor 75 kW (Schneider Electric); nVent’s RDHX Pro 68 kW (nVent); and Stulz’s CyberRack Active Rear Door 49 kW in a 274 mm depth (Stulz). Vertiv completed its approximately USD 1.0 billion purchase of PurgeRite, a liquid cooling flushing and purging services firm, in December 2025 (Vertiv), and guides 2026 net sales of USD 14.0 billion across all its products. Modine’s Airedale signed a capacity agreement worth more than USD 4 billion of data center cooling products for 2027 to 2029, with USD 165 million paid upfront (Modine, May 2026).
What Has Changed in Rear Door Cooling Since 2025?
Six dated moves since February 2025 show suppliers adding rear door capacity and buyers facing new EU rules.
- In February 2025, Schneider Electric completed its purchase of an initial 75% of Motivair for USD 850 million (Source: Schneider Electric).
- In September 2025, Schneider Electric launched its liquid cooling portfolio with Motivair, including a rear door heat exchanger for racks up to 75 kW (Source: Schneider Electric).
- In December 2025, Vertiv completed the approximately USD 1.0 billion acquisition of PurgeRite (Source: Vertiv).
- In January 2026, Vertiv introduced the MegaMod HDX modular liquid cooling system for 50 kW to more than 100 kW racks (Source: Vertiv).
- In July 2026, Vertiv opened a manufacturing plant in Johor, Malaysia for cooling systems including rear door heat exchangers (Source: Vertiv).
- In September 2026, the European Commission proposed a common rating scheme for data centres above 500 kW, covering waste heat reuse (Source: European Commission).
Analyst Takeaways: What Should Rear Door Buyers Plan For?
Four numbers matter most for rear door buyers planning 2026 to 2035 budgets, starting with USD 480 per kW of door capacity.
- USD 480 per kW installed in 2025, falling to USD 405 by 2035, because coil and fan volumes rise; a 40 kW active door costs about USD 20,800 at USD 520 per kW.
- 35% less door capacity at 24 °C water than at 14 °C on nVent’s RDHX Pro, because warmer water narrows the coil temperature gap; size doors for the water you will run in 2030.
- USD 352.67 million of yearly retrofit spend by 2035, because doors let air-cooled halls take 40 kW racks without a rebuild.
- 17.52% a year growth in doors above 60 kW, because tenant AI racks pass the 30 kW ceiling of passive doors.
Methodology: How Did DC Market Insights Size the Rear Door Heat Exchanger Market?
DC Market Insights built the Data Center Rear Door Heat Exchanger Market bottom-up from door cooling capacity and price per kW, giving USD 395.34 million for 2025 from 10 model inputs.
Door capacity equals new air-cooled IT capacity times door coverage (4.5% in 2025, 10% in 2035), plus new AI capacity times door coverage (16%, 18%) times the air-side heat share (25%, 17%), plus installed IT capacity times the yearly retrofit share (0.22%, 0.28%). New IT capacity is 12.0 GW in 2025, 22.0 GW in 2030 and 27.0 GW in 2035, with an AI share of 35%, 60% and 66%; installed capacity is 116 GW in 2025 and 311 GW in 2035. In 2025 that gives about 774 MW of doors at USD 480 per kW, USD 371.62 million of equipment, plus controls, monitoring and service at 6.0% of the total, for USD 395.34 million. Segment, region and country shares are applied to this total, and every split sums to it.
Three bound checks hold. Ceiling one: the market is 1.1% of the USD 34.56 billion that DC Market Insights puts on the Data Center Thermal Management Market in 2025, and below a tenth of its USD 4.16 billion liquid cooling line. Ceiling two: the 2026 figure of USD 495.48 million is 3.5% of the USD 14.0 billion 2026 net sales guidance of Vertiv alone, one of five leading suppliers. Floor: 2% door coverage of new air-cooled capacity, 10% coverage of AI capacity at a 20% air-side share and a 0.10% retrofit share, all at USD 380 per kW, already give USD 135.28 million. Doors are counted apart from the coolant distribution units in the Data Center Cooling CDU Pumps Market and the tanks in the Data Center Immersion Cooling Market. The full method is described on the DC Market Insights research methodology page.
Table of contents
- 01Introduction
- 1.1Report Description
- 1.2Key Market Statistics, 2025, 2026, 2030 and 2035
- 02Executive Summary
- 2.1Market Snapshot, 2025, 2026 and 2035
- 2.2Market Size Chart, 2020-2035
- 03Market Scope
- 3.1Included Products
- 3.2Excluded Products
- 3.3How the Rear Door Segments Fit Together
- 3.4Why Market Estimates Differ
- 04Market Drivers
- 4.1Colocation Tenants Bring 40 to 75 kW Racks into Air-Cooled Halls
- 4.2Liquid-Cooled AI Racks Still Leave Heat in the Air
- 4.3Server Fans Use 10% to 20% of Rack Power
- 05Market Trends
- 5.1Warmer Facility Water Cuts Door Capacity
- 5.2OCP Door Heat Exchanger Requirements for Open Rack
- 5.3Factory-Built Liquid Cooling Modules
- 06Market Challenges
- 6.1Water at the Rack: Leak and Derating Risk
- 6.2Fully Liquid-Cooled AI Racks
- 07Market Opportunities
- 7.1Retrofit of Existing Halls
- 7.2Asia Pacific Factories and Halls
- 08Pricing
- 8.1Price per kW and Door Capacity, 2020, 2025, 2030 and 2035
- 8.2DOE FEMP Rear Door Price Anchor
- 8.3Active versus Passive Door Prices
- 09Standards and Regulation
- 9.1ASHRAE TC 9.9 Facility Water Classes
- 9.2ANSI/ASHRAE Standard 90.4-2025
- 9.3OCP ACS Door Heat Exchanger Requirements Rev 1.0
- 9.4IEC 62610-4
- 9.5Directive (EU) 2023/1791 and Delegated Regulation (EU) 2024/1364
- 9.6EU Data Centre Rating Scheme Proposal, September 2026
- 9.7Singapore SS 697
- 10Market Segmentation
- 10.1By Product Type: Active Rear Door Heat Exchangers
- 10.2By Product Type: Passive Rear Door Heat Exchangers
- 10.3By Product Type: Rear Door Chiller and Refrigerant Doors
- 10.4By Cooling Capacity per Rack: Up to 30 kW
- 10.5By Cooling Capacity per Rack: 31 to 60 kW
- 10.6By Cooling Capacity per Rack: Above 60 kW
- 10.7By Deployment: New-Build Air-Cooled Halls
- 10.8By Deployment: AI and Liquid-Cooled Halls
- 10.9By Deployment: Retrofit of Existing Halls
- 10.10By Deployment: Controls Monitoring and Service
- 10.11By Data Center Type: Colocation
- 10.12By Data Center Type: Hyperscale and AI Cloud
- 10.13By Data Center Type: Enterprise
- 10.14By Data Center Type: HPC and Research
- 11DC Exclusive
- 11.1Rack Density Break-Even Ladder, 15 kW to 132 kW
- 12Regional Insights
- 12.1North America
- 12.2Europe
- 12.3Asia Pacific
- 12.4Latin America
- 12.5Middle East and Africa
- 13Country Analysis
- 13.1United States
- 13.2China
- 13.3Germany
- 13.4United Kingdom
- 13.5Japan
- 13.6France
- 13.7India
- 13.8Netherlands
- 13.9Canada
- 13.10Australia
- 13.11Singapore
- 13.12Saudi Arabia
- 14Forecast Scenarios
- 14.1Low Scenario
- 14.2Base Scenario
- 14.3High Scenario
- 15Competitive Insights
- 15.1Vertiv
- 15.2Schneider Electric (Motivair)
- 15.3nVent
- 15.4Legrand (USystems)
- 15.5Stulz
- 15.6Rittal
- 15.7Airedale by Modine
- 15.8Boyd
- 15.9CoolIT Systems
- 15.10Nortek Data Center Cooling
- 15.11Delta Electronics
- 15.12Eaton
- 15.13Daikin Applied
- 15.14Trane Technologies
- 16Recent Developments
- 16.1February 2025 to September 2026
- 17Analyst Takeaways
- 17.1Four Numbers for Rear Door Buyers
- 18Methodology
- 18.1Model Inputs
- 18.2Bound Checks
- Fig. 1Data Center Rear Door Heat Exchanger Market Size, 2020-2035 (USD million)
- Table 1Market Snapshot, 2025, 2026 and 2035
- Table 2Scope Comparison: What Is Counted
- Table 3Price per kW and Door Capacity, 2020-2035
- Table 4Market by Product Type, 2025 and 2035
- Table 5Market by Cooling Capacity per Rack, 2025 and 2035
- Table 6Market by Deployment, 2025 and 2035
- Table 7Market by Data Center Type, 2025 and 2035
- Table 8Rack Density Break-Even Ladder
- Table 9Market by Region, 2025 and 2035
- Table 10Top 12 Countries, 2025 and 2035
- Table 11Forecast Scenarios, 2035
About this report
Written by Amit Jain and reviewed by Deepti Agrawal, Senior Editor, Research. Figures are built top-down and bottom-up and reconciled before publication, with 2025 as the base year.
Read our methodologyHow we built this
- Historical period2020-2024
- Base year2025
- Forecast period2026-2035
- Sizing approachTop-down + bottom-up
Need more than the report?
Advisory on this market
Due diligence, site selection and market entry work, by the analysts who wrote this report.
See consulting servicesFrequently asked questions
USD 495.48 million in 2026, up 25.33% from USD 395.34 million in 2025, according to DC Market Insights estimates. The market is projected to reach USD 1.02 billion by 2035, a CAGR of 9.96% from 2025.
9.96% a year from 2025 to 2035, after 25.29% a year from 2020 to 2025, because door capacity sold rises from about 774 MW to 2,334 MW a year while the price falls from USD 480 to USD 405 per kW.
A water- or refrigerant-cooled coil in the rear door of a rack that removes server heat before it enters the room. Buyers spent USD 395.34 million on doors, controls and service in 2025; coolant distribution units and chillers are excluded.
About USD 480 per kW of capacity installed in 2025 (DC Market Insights estimate): about USD 380 per kW for passive doors and USD 520 per kW for active doors, so a 40 kW active door costs about USD 20,800.
Active doors, with their own fans, took 66.0% of 2025 spend and reach 60 to 90 kW per rack; passive doors use the server fans, top out near 30 kW and grow only 7.34% a year to 2035.
Up to 75 kW for Schneider Electric’s Motivair ChilledDoor, 93 kW for Legrand’s ColdLogik CL20 at 14 °C water and 68 kW for nVent’s RDHX Pro at 14 °C, which falls to 44 kW at 24 °C water.
Often yes: USD 80.64 million of 2025 door spend went to liquid-cooled AI racks, because in NVIDIA’s 120 kW GB200 racks networking, storage and power supplies stay air cooled. DC Market Insights puts that air-side share at 25%, falling to 17% by 2035.
North America, with USD 158.14 million or 40.0% of 2025 spend. The Middle East and Africa grows fastest at 13.51% a year, and India is the fastest large country at 15.73% a year.
Vertiv, Schneider Electric (Motivair), nVent, Legrand (USystems) and Stulz hold about 55% of 2025 spend (DC Market Insights estimate). Schneider Electric paid USD 850 million for an initial 75% of Motivair in February 2025.
USD 495.48 million in 2026 is the DC Market Insights figure for rear doors, their controls and service only. Estimates that add coolant distribution units, chilled-water plant or all liquid cooling come out two to three times larger.
Licences, delivery and payment
Which licence should I choose?
Single User is a view-only PDF for one person. Multi User adds a printable PDF and the Excel data for unlimited users at one location. Enterprise covers your whole company and includes 100 free analyst hours.
How and when will I receive the report?
By email, within 24–48 business hours of payment, in the formats of your licence.
How can I pay?
Securely through PayPal: with a PayPal account, a debit or credit card, or PayPal Pay Later where available. Prices are in US dollars.
Can I see a sample first?
Yes. Request a free sample and we will email it to you.
Can the report be tailored to my needs?
Yes. We can add countries, segments or data cuts. Talk to an analyst about the scope you need.
Can I get an invoice or pay against a purchase order?
Write to sales@dcmarketinsights.com and our team will help.