
Data Center Transformer Market Size, Share & Forecast to 2035
Market at a glance
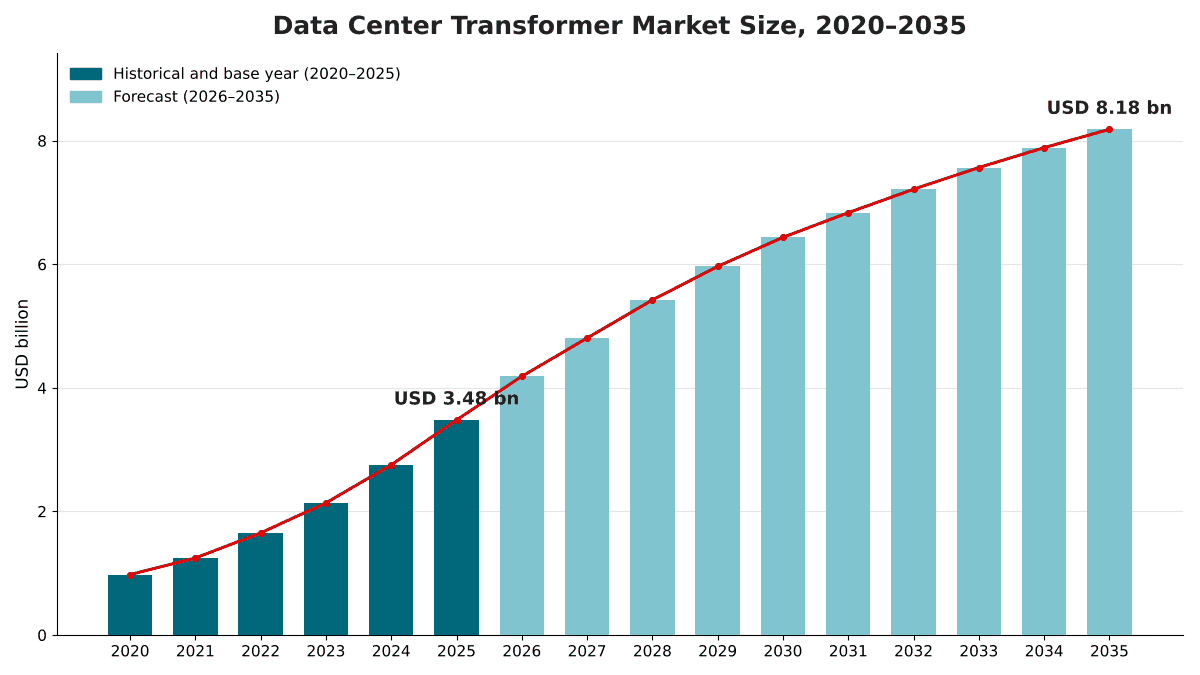
The Data Center Transformer market was worth USD 3,480.0 million in 2025 and is forecast to reach USD 8,180.0 million by 2035, growing at a 8.93% CAGR. North America accounts for 46.8% of the market.
 By Satyabrat Rajawat, Senior Research Analyst, Strategic Advisory
 Reviewed by Deepti Agrawal
Last updated 10 Oct 2026
Base year 2025 PDF + Excel
Reviewed by Deepti Agrawal
Last updated 10 Oct 2026
Base year 2025 PDF + Excel
Source: DC Market Insights analysis
Key findings
More Than 23 GW Under Construction Carries About USD 5.69 Billion of Transformers
800 VDC Power Opens the Door to Solid-State Transformers
Transformer Lead Times Reached 120 Weeks
AI and GPU Cloud Campuses Grow to USD 2.21 Billion by 2035
What is inside the report
- 01Introduction
- 02Research Methodology
- 03Executive Summary
- 04Market Dynamics
- 05Pricing and Cost Analysis
- 06Standards and Regulation
- 07Supply Chain and Value Chain Analysis
- 08Global Data Center Transformer Market Size and Forecast
- 09Market by Type
- 10Market by Technology
- 20chapters
- 2020-2024Historical period
- 2026-2035Forecast period
- 13Companies profiled
Regional insights
- North America46.8%
- Asia Pacific26.1%
- Europe17.4%
- Latin America4.7%
- Middle East and Africa5%
Segmentation
Companies profiled
- Hitachi Energy
- Siemens Energy
- GE Vernova (Prolec GE)
- Schneider Electric
- Eaton
- Hammond Power Solutions
- HD Hyundai Electric
- Hyosung Heavy Industries
- LS Electric
- Mitsubishi Electric
- Toshiba Energy Systems & Solutions
- WEG
- DG Matrix
Recent developments
Eaton announced a USD 340 million investment to convert a facility in Jonesville, South Carolina, into a three-phase transformer plant, with production expected to begin in 2027 (Source: Eaton press release).
Eaton completed the acquisition of Resilient Power Systems, a developer of solid-state transformer-based technology with application potential for data centers (Source: Eaton press release).
Hitachi Energy announced a USD 457 million investment in South Boston, Virginia, that will make the site the largest manufacturing site for large power transformers in the United States (Source: Virginia Governor's Office news release).
GE Vernova completed its USD 5.275 billion acquisition of the remaining 50% stake in Prolec GE (Source: GE Vernova press release).
HD Hyundai Electric signed a framework agreement worth up to KRW 1.12 trillion with a global big tech company for distribution and high-voltage equipment for North American data centers through 2028 (Source: The Korea Times news report).
Hyosung Heavy Industries signed KRW 386.5 billion of 765 kV and 345 kV transformer contracts with two US big tech companies for new AI data centers (Source: Asia Economy news report).
Full analysis
The Data Center Transformer Market covers the transformers bought to power data centers: large power transformers in campus and delivery substations, medium-voltage distribution transformers that step grid power down to building voltage, low-voltage dry-type transformers inside power distribution units and plant rooms, and the first solid-state transformers built for direct current power systems. DC Market Insights values the global Data Center Transformer Market at USD 3.48 billion in 2025 and forecasts USD 8.18 billion by 2035, a CAGR of 8.93%. The 2025 value is built from the capacity itself: about 13.4 GW of IT capacity energized or prepared for energization (45% of 2025 completions of 12.0 GW plus 55% of 2026 completions of 14.5 GW, because transformers are delivered ahead of the IT load) at about USD 0.25 million of new-build transformer spend per MW of IT load gives USD 3.29 billion, and replacement and upgrade work on an installed base of about 104 GW adds USD 187.88 million. Solid-state transformers are the fastest-growing segment at 42.44% a year because DC Market Insights expects 800-volt direct current (VDC) power systems for AI racks to use power electronics in place of conventional transformers, and the Middle East and Africa is the fastest-growing region at 12.65% a year in the DC Market Insights model as the region adds campus-scale capacity from a small installed base.
Executive Summary
The Global Data Center Transformer Market size was valued at USD 0.98 billion in 2020, reached USD 3.48 billion in 2025, and is anticipated to reach USD 8.18 billion by 2035, at a CAGR of 8.93% during the forecast period.
| Report attribute | Details |
|---|---|
| Historical Period | 2020-2024 |
| Base Year | 2025 |
| Forecast Period | 2026-2035 |
| Data Center Transformer Market Size 2025 | USD 3.48 Billion |
| Data Center Transformer Market, CAGR | 8.93% |
| Data Center Transformer Market Size 2035 | USD 8.18 Billion |
The market grew at 28.93% a year between 2020 and 2025, and 2025 alone added 26.4% over 2024. Two forces stacked on top of each other: annual capacity completions more than doubled from 5.0 GW in 2020 to 12.0 GW in 2025 in the DC Market Insights capacity model, and the price of a medium-voltage transformer rose from about USD 30.5 thousand per megavolt-ampere (MVA) in 2020 to USD 53.6 thousand per MVA in 2025 while Wood Mackenzie reported transformer supply deficits.
Growth slows to 8.93% a year from 2025 to 2035 because transformer prices flatten once new factories in the United States and Asia reach output, while annual completions keep rising to 22.0 GW in 2030 and 27.0 GW in 2035. The installed base grows from about 116 GW at the end of 2025 to about 318 GW by 2035, which lifts replacement and upgrade spending from 5.4% of the market to 10.7%.
Market Scope: What Does the Data Center Transformer Market Cover?
The Data Center Transformer Market covers every transformer bought for a data center, from the grid connection to the rack, valued at first sale in current US dollars, with 2025 as the base year and forecasts to 2035. DC Market Insights sizes it at USD 3.48 billion in 2025.
Included. Power transformers above 10 MVA in substations that serve a data center, medium-voltage distribution transformers (liquid-filled pad-mount units and cast-resin or vacuum-pressure-impregnated (VPI) dry-type units), low-voltage dry-type transformers in power distribution units and plant rooms, solid-state transformers, and replacement and upgrade units on operating sites.
Excluded. Switchgear, protection relays, civil works and installation labor, uninterruptible power supplies (UPS), busways, instrument transformers, generator step-up transformers at power plants, and grid transformers not dedicated to a data center.
How the segments fit together. The type, technology, power rating, data center type and project type splits each re-cut the same USD 3.48 billion. Power transformers in this report equal the transformer line of the Data Center Substation Market report, which values them at USD 2.02 billion in 2025, so the two models can be read side by side. Solid-state transformers appear both as a type and as a technology.
Market Drivers: What Drives the Data Center Transformer Market?
Three drivers explain most of the growth in the Data Center Transformer Market: a construction pipeline worth about USD 5.69 billion of transformers, electricity demand that the International Energy Agency (IEA) expects to more than double by 2030, and long-term supply agreements.
More Than 23 GW Under Construction Carries About USD 5.69 Billion of Transformers
BloombergNEF counted 23.1 GW of data center capacity under construction globally at the end of September 2025, split across 831 sites, with the United States hosting 15.9 GW of it. At the DC Market Insights estimate of USD 0.25 million of new-build transformer spend per MW of IT load, that pipeline alone carries about USD 5.69 billion of transformers, more than one and a half years of 2025 market value. DC Market Insights sizes medium-voltage transformer capacity at about 1.6 MVA per MW of IT load, in line with a Schneider Electric reference design for a site scalable to 56.16 MW that uses 36 medium-voltage (12 kV to 400 V) transformers rated 2,500 kVA each, or 90 MVA in total.
Data Center Electricity Use Rises from 415 TWh to About 945 TWh by 2030
The IEA estimates that data centers used 415 terawatt-hours (TWh) in 2024, about 1.5% of world electricity consumption, and expects their consumption to more than double to around 945 TWh by 2030. The United States accounted for 45% of data center electricity consumption in 2024.
Big Tech Buyers Lock In Power Equipment Supply Through 2028
Big tech buyers now sign multi-year supply agreements. In September 2026, Hyosung Heavy Industries signed ultra-high-voltage transformer supply contracts totaling KRW 386.5 billion (about USD 286 million) with two US big tech companies, for 765 kV and 345 kV transformers that will be deployed in new AI data centers in the northern and southern United States. In July 2026, HD Hyundai Electric signed a long-term framework agreement worth up to KRW 1.12 trillion (about USD 720 million) with a global big tech company for distribution and high-voltage equipment for data centers under construction across North America through 2028.
Market Trends: How Is Data Center Power Conversion Changing?
Data center power conversion is moving toward solid-state transformers, larger units and ester insulating fluids; together, solid-state and ester-fluid transformers rise from 7.1% of the market in 2025 to 18.9% by 2035.
800 VDC Power Opens the Door to Solid-State Transformers
NVIDIA is leading a move to 800 VDC data center power to support 1 MW IT racks, with full-scale production of 800 VDC data centers planned to coincide with its Kyber rack-scale systems in 2027. Its design converts 13.8 kV alternating current (AC) grid power directly to 800 VDC at the data center perimeter and points to solid-state transformer (SST) approaches to enable that transition, with Eaton, Schneider Electric and Vertiv among its data center power system partners. In February 2026, DG Matrix raised a USD 60 million Series A led by Engine Ventures for its multi-port solid-state transformer. DC Market Insights forecasts solid-state transformers to grow from USD 12.37 million in 2025 to USD 425.25 million by 2035, taking 9.0% of new medium-voltage transformer capacity by 2035.
Units Above 100 MVA Grow at 11.46% a Year
In the DC Market Insights model, the largest AI campuses connect at transmission voltage and use fewer, larger transformers. DC Market Insights estimates transformers above 100 MVA at USD 929.31 million in 2025 and forecasts USD 2.75 billion by 2035, which lifts their share from 26.7% to 33.6%.
Ester Fluids Replace Mineral Oil Close to Buildings
Ester fluid-immersed transformers are the fastest-growing liquid-filled technology at 16.95% a year in the DC Market Insights model, from USD 233.79 million in 2025 to USD 1.12 billion by 2035. DC Market Insights expects operators placing medium-voltage transformers closer to data halls to specify ester fluids more often to ease permitting and spacing on dense campuses.
Market Challenges: What Holds the Data Center Transformer Market Back?
Lead times that reached 120 weeks on average in 2024 and prices about 80% above pre-pandemic levels are the two constraints that DC Market Insights expects to cap the pace of the Data Center Transformer Market through 2027.
Transformer Lead Times Reached 120 Weeks
A June 2024 draft report for the US National Infrastructure Advisory Council (NIAC) put transformer lead times at around 50 weeks in 2021 and 120 weeks on average in 2024, and lead times for large substation power and generator step-up transformers at 80 to 210 weeks. The IEA found that wait times for critical grid components such as transformers and cables have doubled in the past three years. Wood Mackenzie expected US supply shortages of 30% for power transformers and 10% for distribution transformers in 2025.
Prices Are About 80% Higher Than Before the Pandemic
The same NIAC draft report found transformer prices 80% higher than at the beginning of the pandemic. DC Market Insights models the price of a medium-voltage transformer at USD 53.6 thousand per MVA in 2025, up 76% from USD 30.5 thousand per MVA in 2020, and expects prices to peak at about USD 56.4 thousand per MVA in 2028 before easing as new capacity arrives.
Efficiency Standards Tighten from 2029
The US Department of Energy (DOE) final rule on energy conservation standards for distribution transformers covers liquid-immersed, low-voltage dry-type and medium-voltage dry-type distribution transformers, with compliance required on and after April 23, 2029 (Source: Federal Register, DOE final rule). DOE projects national energy savings of 4.58 quads full fuel cycle. DC Market Insights expects the rule to support distribution transformer prices from 2029 even as supply loosens.
Market Opportunities: Where Are the New Revenue Pools?
The two largest new revenue pools in the Data Center Transformer Market are AI and GPU cloud campuses, growing at 15.12% a year, and replacement and upgrade work on operating sites, growing at 16.69% a year.
AI and GPU Cloud Campuses Grow to USD 2.21 Billion by 2035
Specialist AI and GPU cloud operators spent USD 539.80 million on transformers in 2025, and DC Market Insights expects their spend to reach USD 2.21 billion by 2035, about four times the 2025 level. Grid-scale direct current is the longer-term option for the largest sites, covered in the Data Center High-Voltage Direct Current (HVDC) Market report.
Replacement and Upgrade Work Reaches USD 879.15 Million by 2035
In the DC Market Insights model, older halls refitted for AI racks need more transformer capacity, and the installed base nearly triples by 2035. DC Market Insights models replacement and upgrade spending at USD 187.88 million in 2025 and USD 879.15 million by 2035.
Pricing: How Much Do Data Centers Spend on Transformers per MW?
A new data center spends about USD 0.25 million on transformers per MW of IT load in 2025, of which about USD 0.14 million per MW goes to substation power transformers. These are DC Market Insights estimates at first sale.
| Transformer cost metric | 2020 | 2025 | 2030 | 2035 |
|---|---|---|---|---|
| New-build transformer spend per MW of IT (USD million) | 0.17 | 0.25 | 0.26 | 0.27 |
| Power transformers per MW of IT (USD million) | 0.10 | 0.14 | 0.16 | 0.16 |
| Medium-voltage transformer price (USD thousand per MVA) | 30.5 | 53.6 | 55.9 | 54.3 |
| Medium-voltage capacity per MW of IT (MVA) | 1.62 | 1.60 | 1.58 | 1.55 |
| Solid-state share of new medium-voltage capacity | 0% | 0% | 3.3% | 9.0% |
A public price list gives a check on the medium-voltage figure. Supplier Giga Energy puts distribution transformers at roughly USD 40,000 to over USD 150,000, depending on size and voltage, and substation transformers at USD 150,000 to well over USD 2,000,000. At the model price, a 2,500 kVA unit costs about USD 134 thousand, inside that distribution transformer range.
Standards and Regulation: Which Rules Shape Data Center Transformers?
Four sets of rules shape data center transformers: IEEE C57.12.00 for liquid-immersed units, IEC 60076-11 for dry-type units, US efficiency standards and EU ecodesign rules.
IEEE C57.12.00-2021. The Institute of Electrical and Electronics Engineers (IEEE) Standard for General Requirements for Liquid-Immersed Distribution, Power, and Regulating Transformers sets electrical and mechanical requirements for liquid-immersed distribution and power transformers with 601 V or more in the highest-voltage winding.
IEC 60076-11:2018. The International Electrotechnical Commission (IEC) standard for dry-type transformers covers units with a highest voltage for equipment up to and including 72.5 kV.
DOE distribution transformer standards. The April 2024 final rule took effect on July 8, 2024, and requires compliance on and after April 23, 2029, for liquid-immersed, low-voltage dry-type and medium-voltage dry-type distribution transformers.
EU ecodesign. Commission Regulation (EU) 2019/1783 amends Regulation (EU) No 548/2014, the ecodesign rules for small, medium and large power transformers in the European Union.
Market Segmentation: Which Segment Leads the Data Center Transformer Market?
Power transformers lead the Data Center Transformer Market with 58.0% of 2025 value, hyperscale data centers lead buyers with 46.9%, and mineral oil-immersed units lead technologies with 69.3%. Solid-state transformers are the fastest-growing segment at 42.44% a year, from USD 12.37 million in 2025 to USD 425.25 million by 2035, because DC Market Insights expects 800 VDC power systems for AI racks to replace part of the conventional transformer chain with power electronics.
By Type: Power Transformers Lead with 58.0%
| Type | 2025 (USD billion) | Share 2025 | 2035 (USD billion) | CAGR 2025-2035 |
|---|---|---|---|---|
| Power Transformers | 2.02 | 58.0% | 5.00 | 9.49% |
| Medium-Voltage Distribution Transformers | 1.20 | 34.6% | 2.34 | 6.87% |
| Low-Voltage Dry-Type Transformers | 0.25 | 7.0% | 0.42 | 5.54% |
| Solid-State Transformers | 0.01 | 0.4% | 0.43 | 42.44% |
Low-voltage dry-type transformers grow slowest because, in the DC Market Insights model, higher distribution voltages inside the hall remove transformation steps at the rack. Figures in the tables may not add exactly because of rounding.
By Technology: Mineral Oil-Immersed Units Lead with 69.3%
| Technology | 2025 (USD billion) | Share 2025 | 2035 (USD billion) | CAGR 2025-2035 |
|---|---|---|---|---|
| Mineral Oil-Immersed | 2.41 | 69.3% | 5.19 | 7.97% |
| Ester Fluid-Immersed | 0.23 | 6.7% | 1.12 | 16.95% |
| Dry-Type (Cast Resin and VPI) | 0.82 | 23.6% | 1.45 | 5.83% |
| Solid-State | 0.01 | 0.4% | 0.43 | 42.44% |
Dry-type units hold almost a quarter of value because, in the DC Market Insights model, most transformers installed inside data center buildings are cast-resin units. The National Renewable Energy Laboratory (NREL) expects dry-type three-phase transformers to see demand from data centers.
By Power Rating: Units Up to 2.5 MVA Lead with 34.4%
| Power rating | 2025 (USD billion) | Share 2025 | 2035 (USD billion) | CAGR 2025-2035 |
|---|---|---|---|---|
| Up to 2.5 MVA | 1.20 | 34.4% | 2.37 | 7.06% |
| Above 2.5 MVA to 10 MVA | 0.26 | 7.6% | 0.82 | 11.95% |
| Above 10 MVA to 100 MVA | 1.09 | 31.3% | 2.25 | 7.51% |
| Above 100 MVA | 0.93 | 26.7% | 2.75 | 11.46% |
By Data Center Type: Hyperscale Data Centers Lead with 46.9%
| Data center type | 2025 (USD billion) | Share 2025 | 2035 (USD billion) | CAGR 2025-2035 |
|---|---|---|---|---|
| Hyperscale Data Centers | 1.63 | 46.9% | 3.68 | 8.45% |
| Colocation Data Centers | 0.95 | 27.2% | 1.82 | 6.73% |
| AI and GPU Cloud Data Centers | 0.54 | 15.5% | 2.21 | 15.12% |
| Enterprise and Edge Data Centers | 0.36 | 10.3% | 0.48 | 3.01% |
AI and GPU cloud data centers overtake colocation before 2035 and reach 27.0% of the market.
By Project Type: New Build Leads with 94.6%
New-build transformers are worth USD 3.29 billion (94.6%) in 2025 and USD 7.31 billion by 2035, growing at 8.30% a year. Replacement and upgrade projects are worth USD 187.88 million (5.4%) and grow at 16.69% a year to USD 879.15 million.
DC Exclusive: The Transformer Spend per MW Model and Type × Buyer Matrix
At USD 1.02 billion in 2025, power transformers for hyperscale campuses are the single largest cell of the matrix and 29.3% of all data center transformer spending. The matrix is a DC Market Insights model, not a shipment count, built from 52 inputs: 32 capacity cohorts (16 years of new-build and installed-base capacity from 2020 to 2035), 4 transformer cost curves, 3 sizing ratios (medium-voltage and low-voltage MVA per MW and solid-state adoption), 4 buyer splits, 5 regional splits and 4 public disclosures used as cross-checks.
| 2025, USD billion | Power | MV Distribution | LV Dry-Type | Solid-State | Total |
|---|---|---|---|---|---|
| Hyperscale Data Centers | 1.02 | 0.52 | 0.09 | 0.01 | 1.63 |
| Colocation Data Centers | 0.51 | 0.36 | 0.08 | <0.01 | 0.95 |
| AI and GPU Cloud Data Centers | 0.33 | 0.17 | 0.03 | 0.01 | 0.54 |
| Enterprise and Edge Data Centers | 0.16 | 0.15 | 0.05 | <0.01 | 0.36 |
| Total | 2.02 | 1.20 | 0.25 | 0.01 | 3.48 |
Hyperscale buyers spend 62.5% of their transformer budget on substation power transformers, against 44.4% for enterprise and edge sites, because they connect at transmission voltage. Enterprise and edge sites spend 13.6% on low-voltage dry-type units, more than twice the hyperscale share of 5.6% in the DC Market Insights model. AI and GPU cloud operators carry the highest solid-state share at 1.1% of their spend.
The transformer spend per MW model behind these figures has two inputs that any reader can check: IT capacity completed each year (12.0 GW in 2025 and 14.5 GW in 2026) and the new-build transformer spend per MW of IT load (USD 0.25 million in 2025). The model and its assumptions are explained on our research methodology page.
Regional Insights: Which Region Leads the Data Center Transformer Market?
North America leads the Data Center Transformer Market with 46.8% of 2025 value, and the Middle East and Africa is the fastest-growing region at 12.65% a year, because, in the DC Market Insights model, the region is adding campus-scale capacity from a small installed base.
North America Leads with 46.8% Share
North American data centers spent USD 1.63 billion on transformers in 2025, and the region is forecast to reach USD 3.40 billion by 2035, a CAGR of 7.63%. The United States hosted 15.9 GW of the 23.1 GW under construction worldwide at the end of September 2025. Hitachi Energy and Eaton are both expanding US transformer manufacturing capacity.
Asia Pacific Holds 26.1% Share
Asia Pacific is worth USD 908.39 million in 2025 and USD 2.42 billion by 2035, a CAGR of 10.31%. BloombergNEF counted 3.2 GW under construction in Asia Pacific across 283 sites at the end of September 2025. In the DC Market Insights model, India, Malaysia and Japan add the most new transformer demand outside China, and Asia Pacific gains 3.5 points of share by 2035, the largest gain of any region.
Europe Holds 17.4% Share
Europe is worth USD 605.59 million in 2025 and USD 1.33 billion by 2035, a CAGR of 8.22%. Europe grows below the global rate in the DC Market Insights model, and transformers placed on the EU market must meet the ecodesign requirements of Regulation (EU) No 548/2014, as amended in 2019, unless exempt.
Latin America Holds 4.7% Share
Latin America is worth USD 163.58 million in 2025 and USD 458.33 million by 2035, a CAGR of 10.85%, led in the DC Market Insights model by Brazil at USD 71.98 million.
Middle East and Africa Holds 5.0% Share
The Middle East and Africa is worth USD 174.02 million in 2025 and USD 572.91 million by 2035, the fastest growth of any region at 12.65% a year. Saudi Arabia is the largest country market in the region at USD 47.86 million in 2025 in the DC Market Insights model, growing at 13.83% a year.
Country Analysis: Which Countries Spend the Most on Data Center Transformers?
The United States is the largest country market for data center transformers at USD 1.49 billion in 2025, 42.9% of global value, followed by China at USD 340.65 million (9.8%) and Canada at USD 136.82 million (3.9%). The 12 largest countries account for 80.1% of 2025 spending.
| Rank | Country | Region | 2025 (USD billion) | Share 2025 | 2035 (USD billion) | CAGR 2025-2035 |
|---|---|---|---|---|---|---|
| 1 | United States | North America | 1.49 | 42.9% | 3.04 | 7.36% |
| 2 | China | Asia Pacific | 0.34 | 9.8% | 0.78 | 8.57% |
| 3 | Canada | North America | 0.14 | 3.9% | 0.36 | 10.16% |
| 4 | Germany | Europe | 0.13 | 3.7% | 0.27 | 7.65% |
| 5 | Japan | Asia Pacific | 0.13 | 3.7% | 0.31 | 9.00% |
| 6 | United Kingdom | Europe | 0.12 | 3.5% | 0.25 | 7.61% |
| 7 | India | Asia Pacific | 0.10 | 2.8% | 0.39 | 15.09% |
| 8 | Australia | Asia Pacific | 0.08 | 2.4% | 0.23 | 10.67% |
| 9 | Brazil | Latin America | 0.07 | 2.1% | 0.19 | 10.47% |
| 10 | France | Europe | 0.07 | 2.0% | 0.16 | 8.49% |
| 11 | Malaysia | Asia Pacific | 0.07 | 1.9% | 0.20 | 11.58% |
| 12 | Saudi Arabia | Middle East and Africa | 0.05 | 1.4% | 0.17 | 13.83% |
India is the fastest-growing large country market at 15.09% a year, ahead of Saudi Arabia at 13.83%. The United States grows slowest of the 12, at 7.36% a year. The country figures are a DC Market Insights allocation of the regional totals, weighted by each country’s estimated share of installed and new data center capacity.
Forecast Scenarios: How Could the 2035 Forecast Change?
The Data Center Transformer Market reaches USD 8.18 billion by 2035 in the base case, with a range of USD 6.95 billion to USD 9.21 billion across the low and high scenarios.
| Scenario | Assumption from 2026 | 2035 (USD billion) | CAGR 2025-2035 |
|---|---|---|---|
| Low | Capacity additions 15% below base; solid-state adoption 30% slower | 6.95 | 7.16% |
| Base | Additions rise to 27.0 GW a year; solid-state units reach 9.0% of new medium-voltage capacity | 8.18 | 8.93% |
| High | Additions 12% above base; solid-state adoption 35% faster | 9.21 | 10.22% |
The high case assumes new transformer factories reach full output on time and 800 VDC designs spread beyond the first AI campuses. On-site generation is the main swing factor, because a self-generating campus needs a smaller grid transformer.
Competitive Insights: Who Leads the Data Center Transformer Market?
- Hitachi Energy
- Siemens Energy
- GE Vernova (Prolec GE)
- Schneider Electric
- Eaton
- Hammond Power Solutions
- HD Hyundai Electric
- Hyosung Heavy Industries
- LS Electric
- Mitsubishi Electric
- Toshiba Energy Systems & Solutions
- WEG
- DG Matrix
The three largest suppliers, Hitachi Energy, Siemens Energy and GE Vernova, together hold about 27% of the Data Center Transformer Market in 2025 (DC Market Insights estimate, based on their position in power transformers, which make up 58.0% of the market, and GE Vernova’s distribution transformer lines through Prolec GE). GE Vernova completed its purchase of the remaining 50% stake in Prolec GE for USD 5.275 billion in February 2026 (Source: GE Vernova press release); Prolec GE expected about USD 3 billion of revenue in 2025, serving markets where electricity demand growth is driven in part by data centers. Hammond Power Solutions reported record 2025 sales of CAD 898 million, up 13.9%, with backlog 122% higher than a year earlier and growth tied in part to data center expansion. Hyosung Heavy Industries booked about KRW 9.3 trillion of new orders through August 2026, already above its total for all of 2025, and formed a dedicated data center business team. Schneider Electric, Eaton, HD Hyundai Electric, LS Electric, Mitsubishi Electric, Toshiba and WEG compete in power and distribution transformers, and DG Matrix in solid-state units.
Recent Developments
- In February 2025, Eaton announced a USD 340 million investment to convert a facility in Jonesville, South Carolina, into a three-phase transformer plant, with production expected to begin in 2027 (Source: Eaton press release).
- In August 2025, Eaton completed the acquisition of Resilient Power Systems, a developer of solid-state transformer-based technology with application potential for data centers (Source: Eaton press release).
- In September 2025, Hitachi Energy announced a USD 457 million investment in South Boston, Virginia, that will make the site the largest manufacturing site for large power transformers in the United States (Source: Virginia Governor’s Office news release).
- In February 2026, GE Vernova completed its USD 5.275 billion acquisition of the remaining 50% stake in Prolec GE (Source: GE Vernova press release).
- In July 2026, HD Hyundai Electric signed a framework agreement worth up to KRW 1.12 trillion with a global big tech company for distribution and high-voltage equipment for North American data centers through 2028 (Source: The Korea Times news report).
- In September 2026, Hyosung Heavy Industries signed KRW 386.5 billion of 765 kV and 345 kV transformer contracts with two US big tech companies for new AI data centers (Source: Asia Economy news report).
We follow these orders, factory investments and power architecture changes as they happen in our data center industry updates.
Methodology: How We Built the Data Center Transformer Market Model
DC Market Insights built this market bottom-up from 16 annual capacity cohorts (2020 to 2035). Each year weights 45% of that year’s IT capacity completions and 55% of the next year’s. Power transformers are priced per MW of IT load (USD 0.10 million in 2020, USD 0.14 million in 2025, USD 0.16 million by 2035). Medium-voltage transformers are sized at 1.62 MVA per MW in 2020, falling to 1.55 MVA by 2035, and priced per MVA; low-voltage dry-type transformers fall from 0.43 MVA per MW in 2025 to 0.31 MVA by 2035. Solid-state transformers take a rising share of new medium-voltage capacity from 2027 at a premium that falls from 3.5 times a conventional unit in 2025 to about 2.1 times by 2035, and replacement and upgrade spending is added on the installed base. Every split sums to the market total. Because no major supplier we reviewed reports data center transformer sales separately, the result was checked against bounds: the power transformer line equals our substation model, the medium-voltage price sits inside a public distribution transformer price range, and the roughly 76 GVA of medium-voltage capacity the model installs in the United States between 2025 and 2030, about 38 GW of served load if half is redundant, is broadly consistent with the 12.6 GW to 72 GW of transformer capacity for power delivery units that NREL expects data center demand may add by 2030. The analyst named on this page built the model, and the reviewer checked the arithmetic, the sources and the dates before publication.
Table of contents
- 01Introduction
- 1.1Market Definition and Scope
- 1.2Transformer Types, Buyers and Regions Covered
- 1.3Currency, Base Year and Forecast Period
- 1.4Key Questions Answered
- 02Research Methodology
- 2.1Transformer Spend per MW Model
- 2.2Capacity Cohorts and Delivery Timing
- 2.3Replacement and Upgrade Spending Model
- 2.4Bound Checks Against Public Disclosures
- 2.5Assumptions and Limitations
- 03Executive Summary
- 3.1Market at a Glance, 2020-2035
- 3.2Key Findings
- 3.3Analyst Recommendations by Buyer Type
- 04Market Dynamics
- 4.1Drivers
- 4.2Challenges and Restraints
- 4.3Opportunities
- 4.4Trends
- 4.5Impact Analysis of Drivers and Challenges, 2025-2035
- 05Pricing and Cost Analysis
- 5.1Transformer Spend per MW of IT Load, 2020-2035
- 5.2Medium-Voltage Transformer Price per MVA, 2020-2035
- 5.3Lead Times and Supply Deficits
- 5.4Solid-State Transformer Price Premium, 2025-2035
- 06Standards and Regulation
- 6.1IEEE C57.12.00-2021
- 6.2IEC 60076-11:2018
- 6.3US DOE Distribution Transformer Standards
- 6.4EU Ecodesign Regulation (EU) No 548/2014 and 2019/1783
- 07Supply Chain and Value Chain Analysis
- 7.1Core Steel, Windings and Insulating Fluids
- 7.2Transformer Manufacturing Capacity and New Factories
- 7.3Power Electronics for Solid-State Transformers
- 7.4Long-Term Supply Agreements
- 08Global Data Center Transformer Market Size and Forecast
- 8.1Market Size, 2020-2024
- 8.2Market Size, 2025
- 8.3Market Forecast, 2026-2035
- 8.4New Build vs Replacement and Upgrade Spending
- 09Market by Type
- 9.1Power Transformers
- 9.2Medium-Voltage Distribution Transformers
- 9.3Low-Voltage Dry-Type Transformers
- 9.4Solid-State Transformers
- 10Market by Technology
- 10.1Mineral Oil-Immersed
- 10.2Ester Fluid-Immersed
- 10.3Dry-Type (Cast Resin and VPI)
- 10.4Solid-State
- 11Market by Power Rating
- 11.1Up to 2.5 MVA
- 11.2Above 2.5 MVA to 10 MVA
- 11.3Above 10 MVA to 100 MVA
- 11.4Above 100 MVA
- 12Market by Data Center Type
- 12.1Hyperscale Data Centers
- 12.2Colocation Data Centers
- 12.3AI and GPU Cloud Data Centers
- 12.4Enterprise and Edge Data Centers
- 13Market by Project Type
- 13.1New Build
- 13.2Replacement and Upgrade
- 14DC Exclusive: Type × Buyer Matrix
- 14.1Type × Data Center Type Matrix, 2025
- 14.2Implications for Transformer Suppliers
- 15Market by Region
- 15.1North America (United States, Canada)
- 15.2Europe (Germany, United Kingdom, France, Rest of Europe)
- 15.3Asia Pacific (China, Japan, India, Australia, Malaysia, Rest of Asia Pacific)
- 15.4Latin America (Brazil, Rest of Latin America)
- 15.5Middle East and Africa (Saudi Arabia, Rest of Middle East and Africa)
- 15.6Top 12 Countries, 2025 and 2035
- 16Regional Cross-Sections
- 16.1Region × Type, 2025 and 2035
- 16.2Region × Data Center Type, 2025 and 2035
- 17Forecast Scenarios
- 17.1Base, Low and High Cases to 2035
- 17.2Sensitivity to Capacity Additions
- 17.3Sensitivity to Solid-State Adoption
- 18Competitive Landscape
- 18.1Top-Three Concentration, 2025
- 18.2Mergers, Acquisitions and Factory Investments, 2025-2026
- 18.3Supply Agreements with Data Center Buyers
- 19Company Profiles
- 19.1Hitachi Energy
- 19.2Siemens Energy
- 19.3GE Vernova (Prolec GE)
- 19.4Schneider Electric
- 19.5Eaton
- 19.6Hammond Power Solutions
- 19.7HD Hyundai Electric
- 19.8Hyosung Heavy Industries
- 19.9LS Electric
- 19.10Mitsubishi Electric
- 19.11Toshiba Energy Systems & Solutions
- 19.12WEG
- 19.13DG Matrix
- 20Analyst Recommendations
- 20.1For Transformer Suppliers
- 20.2For Hyperscale, Colocation and AI Cloud Operators
- 20.3For Investors
- Fig. 1Data Center Transformer Market Size, 2020-2035
- Fig. 2Energized-Weighted IT Capacity per Year, 2020-2035
- Fig. 3Transformer Spend per MW of IT Load, 2020-2035
- Fig. 4New Build vs Replacement and Upgrade Spending, 2020-2035
- Fig. 5Market Share by Type, 2025 and 2035
- Fig. 6Market Share by Technology, 2025 and 2035
- Fig. 7Market Share by Data Center Type, 2025 and 2035
- Fig. 8Type × Data Center Type Matrix, 2025
- Fig. 9Market by Region, 2025 and 2035
- Fig. 10Top 12 Countries, 2025
- Fig. 11Forecast Scenarios, 2025-2035
- Table 1Report Attributes
- Table 2Transformer Cost Metrics, 2020-2035
- Table 3Market by Type, 2020-2035
- Table 4Market by Technology, 2020-2035
- Table 5Market by Power Rating, 2020-2035
- Table 6Market by Data Center Type, 2020-2035
- Table 7Market by Project Type, 2020-2035
- Table 8Type × Data Center Type Matrix, 2025
- Table 9Market by Region, 2020-2035
- Table 10Top 12 Countries, 2025 and 2035
- Table 11Forecast Scenarios, 2035
- Table 12Mergers, Acquisitions and Factory Investments, 2025-2026
- Table 13Company Profiles: Products and Data Center Focus
About this report
Written by Satyabrat Rajawat and reviewed by Deepti Agrawal, Senior Editor, Research. Figures are built top-down and bottom-up and reconciled before publication, with 2025 as the base year.
Read our methodologyHow we built this
- Historical period2020-2024
- Base year2025
- Forecast period2026-2035
- Sizing approachTop-down + bottom-up
Need more than the report?
Advisory on this market
Due diligence, site selection and market entry work, by the analysts who wrote this report.
See consulting servicesFrequently asked questions
USD 3.48 billion in 2025, rising to USD 8.18 billion by 2035. DC Market Insights estimates the market at USD 0.98 billion in 2020.
8.93% a year from 2025 to 2035. Growth was faster, at 28.93% a year, between 2020 and 2025 as capacity completions more than doubled and transformer prices rose.
Power transformers, with USD 2.02 billion or 58.0% of the market in 2025. Solid-state transformers are the fastest-growing type at 42.44% a year.
About USD 0.25 million per MW of IT load for a new data center in 2025, of which about USD 0.14 million per MW goes to substation power transformers, according to DC Market Insights estimates.
North America, with USD 1.63 billion or 46.8% of 2025 value. The Middle East and Africa grows fastest at 12.65% a year.
Hitachi Energy, Siemens Energy and GE Vernova together hold about 27% of the market (DC Market Insights estimate). Schneider Electric, Eaton, Hammond Power Solutions, HD Hyundai Electric, Hyosung Heavy Industries, LS Electric, Mitsubishi Electric, Toshiba and WEG also compete.
42.44% a year, from USD 12.37 million in 2025 to USD 425.25 million by 2035, because 800 VDC power systems for AI racks, planned by NVIDIA for 2027, can use solid-state transformer approaches.
USD 1.49 billion in the United States, or 42.9% of 2025 spending, followed by China at USD 340.65 million. India grows fastest among large country markets at 15.09% a year (DC Market Insights estimate).
Licences, delivery and payment
Which licence should I choose?
Single User is a view-only PDF for one person. Multi User adds a printable PDF and the Excel data for unlimited users at one location. Enterprise covers your whole company and includes 100 free analyst hours.
How and when will I receive the report?
By email, within 24–48 business hours of payment, in the formats of your licence.
How can I pay?
Securely through PayPal: with a PayPal account, a debit or credit card, or PayPal Pay Later where available. Prices are in US dollars.
Can I see a sample first?
Yes. Request a free sample and we will email it to you.
Can the report be tailored to my needs?
Yes. We can add countries, segments or data cuts. Talk to an analyst about the scope you need.
Can I get an invoice or pay against a purchase order?
Write to sales@dcmarketinsights.com and our team will help.