
Software-Defined Data Center Market Size, Share & Forecast to 2035
Market at a glance
The Software-Defined Data Center market was worth USD 44.97 billion in 2025 and is forecast to reach USD 103.81 billion by 2035, growing at a 8.73% CAGR. North America accounts for 41.8% of the market.
 By Amit Jain, Senior Consultant, ICT & Emerging Technologies
 Reviewed by Deepti Agrawal
Last updated 7 Oct 2026
Base year 2025 PDF + Excel
Reviewed by Deepti Agrawal
Last updated 7 Oct 2026
Base year 2025 PDF + Excel
Source: DC Market Insights analysis
Key findings
Spend per Core Rose 32.7% Between 2020 and 2025 as VMware Licensing Moved to VMware Cloud Foundation
Enterprises Run Second Platforms Alongside VMware
Licensing Cost Increases Delay Projects and Trigger Legal Action
AI and Data Analytics Workloads Reach USD 21.93 Billion by 2035
What is inside the report
- 01Introduction
- 02Research Methodology
- 03Executive Summary
- 04Market Dynamics
- 05Pricing and Cost Analysis
- 06Standards and Regulation
- 07Supply Chain and Value Chain Analysis
- 08Global Software-Defined Data Center Market Size and Forecast
- 09Market by Component
- 10Market by Deployment Model
- 20chapters
- 2020-2024Historical period
- 2026-2035Forecast period
- 17Companies profiled
Regional insights
- North America41.8%
- Europe26.6%
- Asia Pacific22.6%
- Latin America4.9%
- Middle East and Africa4.1%
Segmentation
Companies profiled
- Broadcom (VMware)
- Microsoft
- Nutanix
- Red Hat
- Hewlett Packard Enterprise
- Dell Technologies
- Cisco
- IBM
- Oracle
- Huawei
- Lenovo
- NetApp
- Pure Storage
- Scale Computing
- Juniper Networks
- Arista Networks
- Citrix
Recent developments
HPE expanded its private cloud portfolio with Morpheus software and VM Essentials, licensed per socket, claiming up to 90% lower virtual machine license costs (Source: HPCwire news report).
Broadcom announced general availability of VMware Cloud Foundation 9.0, a single unified platform for traditional, modern and AI applications (Source: Broadcom press release).
CISPE filed an appeal before the European General Court seeking annulment of the European Commission's approval of Broadcom's acquisition of VMware (Source: StorageNewsletter news report).
Nutanix and Pure Storage announced general availability of a joint solution combining Nutanix Cloud Infrastructure with Pure Storage FlashArray (Source: Nutanix blog).
at Red Hat Summit 2026, Emirates NBD described moving more than 9,000 virtual machines from VMware to Red Hat OpenShift (Source: TechTarget news report).
Nutanix reported fiscal 2026 revenue of USD 2.85 billion and ARR of USD 2.55 billion, with over 3,000 new customers added in the year (Source: Nutanix earnings release).
Full analysis
The Software-Defined Data Center Market covers the software that virtualizes and pools the compute, storage and network resources of a data center and runs them as one programmable private cloud, together with the professional and managed services that deploy and operate that software. DC Market Insights values the global Software-Defined Data Center Market at USD 44.97 billion in 2025 and forecasts USD 103.81 billion by 2035, a CAGR of 8.73%. The 2025 value is built from the licensed base: about 98.0 million physical processor cores running software-defined data center (SDDC) platforms at an average software spend of USD 345.00 per core per year give USD 33.81 billion of software, and deployment and managed services worth 33% of software spend add USD 11.16 billion. AI and data analytics workloads are the fastest-growing segment at 16.17% a year because enterprises are moving model training, inference and data pipelines onto private cloud platforms that schedule graphics processing units (GPUs) alongside virtual machines, and Asia Pacific is the fastest-growing region at 10.84% a year as enterprises in India, Australia and Southeast Asia build private clouds from a smaller base.
Executive Summary
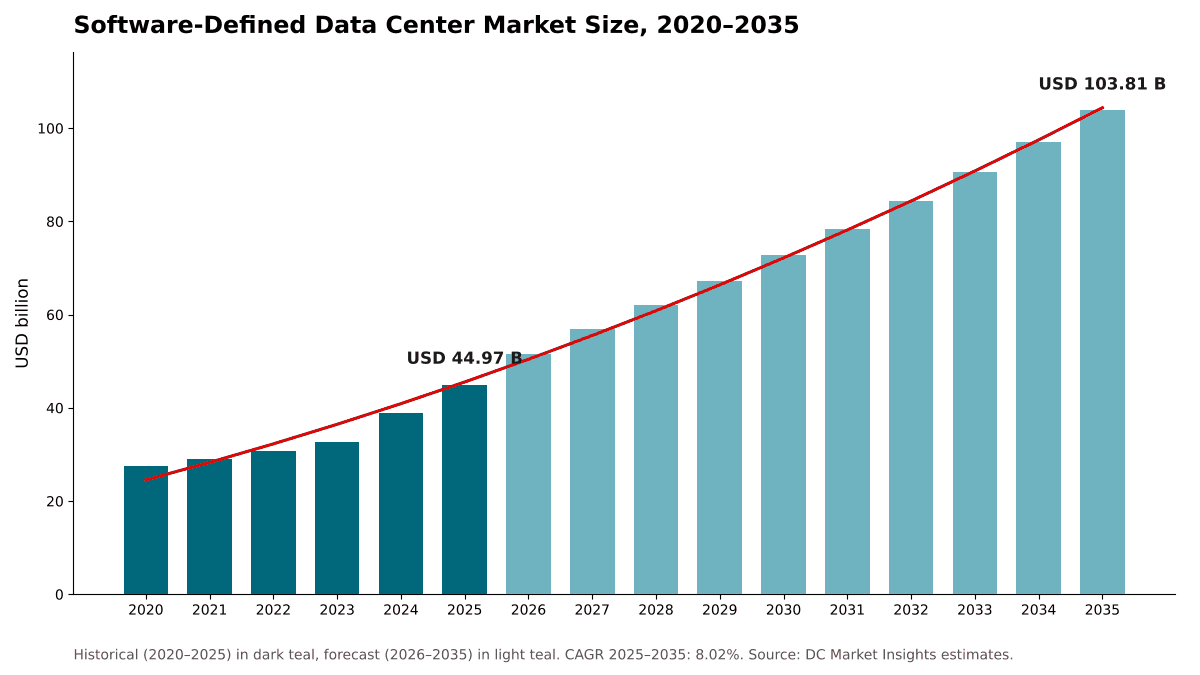
The Global Software-Defined Data Center Market size was valued at USD 27.58 billion in 2020, reached USD 44.97 billion in 2025, and is anticipated to reach USD 103.81 billion by 2035, at a CAGR of 8.73% during the forecast period.
| Report attribute | Details |
|---|---|
| Historical Period | 2020-2024 |
| Base Year | 2025 |
| Forecast Period | 2026-2035 |
| Software-Defined Data Center Market Size 2025 | USD 44.97 Billion |
| Software-Defined Data Center Market, CAGR | 8.73% |
| Software-Defined Data Center Market Size 2035 | USD 103.81 Billion |
The market grew at 10.27% a year between 2020 and 2025, but the growth was uneven. From 2020 to 2023 the Software-Defined Data Center Market added about 5.8% a year as the licensed core base expanded slowly and per-core prices barely moved. Then the new VMware licensing conditions introduced after Broadcom’s acquisition, built around VMware Cloud Foundation, lifted the market by 18.8% in 2024 and a further 15.8% in 2025 to USD 44.97 billion. Broadcom’s own disclosures show the scale of that shift: its infrastructure software segment, which includes VMware Cloud Foundation, sold USD 27.03 billion in fiscal 2025, up from USD 21.48 billion in fiscal 2024 (Source: Broadcom fiscal 2025 results filed with the US Securities and Exchange Commission).
DC Market Insights expects growth of 14.8% in 2026 as the last three-year VMware contracts renew at the new prices, then a slower and steadier 7% to 9% a year from 2027. Volume then takes over from price as the driver, as servers with more cores replace older hosts and containers, AI workloads and edge sites move onto the same platforms.
Market Scope: What Does the Software-Defined Data Center Market Cover?
The Software-Defined Data Center Market covers the software layer that turns servers, storage devices and switches into pooled resources that are provisioned, secured and managed through software rather than by hand, valued at first sale in current US dollars, with 2025 as the base year and forecasts to 2035. DC Market Insights sizes it at USD 44.97 billion in 2025.
Included. Server virtualization and hypervisors (software-defined compute), software-defined storage and the storage software inside hyper-converged infrastructure (HCI), network virtualization and data center software-defined networking (SDN) software, private and hybrid cloud management, automation, orchestration and self-service portals, composable infrastructure software, Kubernetes platforms that run on the same private cloud stack, and the consulting, migration, deployment and managed services sold to implement and run these platforms.
Excluded. Server, storage and switch hardware, public cloud infrastructure-as-a-service revenue, desktop virtualization, backup software sold separately, and the internal labor of the enterprise IT team.
How the segments fit together. The component split divides the same USD 44.97 billion into four software layers and services. The deployment, workload, enterprise-size and vertical splits each re-cut the full market by a different attribute, so every split sums to the market total. SDN products are covered in the Software-Defined Networking (SDN) in the Data Center Market report.
Market Drivers: What Drives the Software-Defined Data Center Market?
A 32.7% rise in software spend per core between 2020 and 2025 is the main driver of the Software-Defined Data Center Market. Two more drivers add volume: a licensed core base that grows 5.5% a year, and AI and container workloads that move onto private cloud platforms.
Spend per Core Rose 32.7% Between 2020 and 2025 as VMware Licensing Moved to VMware Cloud Foundation
DC Market Insights estimates that average software spend per licensed core rose from USD 260.00 in 2020 to USD 345.00 in 2025, a 32.7% increase, with most of it in 2024 and 2025. The cause is the change in how VMware is sold: under new licensing conditions, customers are steered to VMware Cloud Foundation (VCF), which combines compute, networking, storage, management and security in one platform. Broadcom’s chief executive said in June 2025 that over 87% of its 10,000 largest customers had adopted VCF and that Broadcom was more than halfway through VMware renewals, on contracts that typically run three years. The repricing continues in 2026: Broadcom’s infrastructure software revenue reached USD 8.75 billion in the third quarter of fiscal 2026, up 29.0% from USD 6.79 billion a year earlier. DC Market Insights models an 8.5% rise in spend per core in 2026, tapering to about 2% a year from 2033.
The Licensed Core Base Grows from 98.0 Million to 167.4 Million Cores
Software-defined data center platforms are licensed per core or per socket, so the installed base of processor cores is the volume driver of the market. DC Market Insights estimates 98.0 million licensed physical cores in 2025, up from 78.0 million in 2020, and forecasts 129.9 million in 2030 and 167.4 million in 2035.
Containers and AI Workloads Add a Second Growth Engine
Private cloud platforms now run Kubernetes clusters and GPU workloads next to virtual machines. Broadcom positioned VCF 9.0, released in June 2025, as a single unified platform that supports traditional, modern and AI applications. Spending tied to containers and Kubernetes reached USD 9.31 billion in 2025 and spending tied to AI and data analytics USD 4.90 billion, by DC Market Insights estimates; together they grow from 31.6% of the market in 2025 to 50.6% in 2035. Orchestration of these mixed estates is covered in more depth in the Data Center Orchestration Market report.
Market Trends: How Is the Software-Defined Data Center Changing?
The Software-Defined Data Center Market is moving from a single dominant hypervisor toward multi-platform estates, from bundled appliances toward disaggregated hardware, and from virtual machines alone toward platforms that run virtual machines, containers and AI together.
Enterprises Run Second Platforms Alongside VMware
Price increases have pushed large buyers to test or adopt a second platform. At Red Hat Summit 2026, Emirates NBD described moving more than 9,000 virtual machines from VMware to Red Hat OpenShift, and Cleveland Clinic, with more than 10,000 virtual machines, said it expects a 50% lower total cost of ownership from its move. Nutanix added over 3,000 new customers in fiscal 2026 and grew annual recurring revenue (ARR) 16% to USD 2.55 billion. DC Market Insights expects most large enterprises to keep VMware for core estates while placing new or less critical workloads on a second platform, which raises spending on cross-platform management and automation.
Hyperconverged Software Separates from Its Hardware
Hyperconverged software is now sold in validated and joint solutions with external storage arrays. Nutanix and Pure Storage announced general availability of a joint solution combining Nutanix Cloud Infrastructure with Pure Storage FlashArray in December 2025, and Nutanix reported in August 2026 that Dell Private Cloud with PowerStore for Nutanix Cloud Platform was available. DC Market Insights forecasts software-defined storage to grow at 9.91% a year to USD 20.36 billion in 2035, faster than the compute layer at 6.41%, because storage software is now bought separately from the hardware it runs on.
Management and Automation Become the Fastest-Growing Software Layer
Management and automation software, which provisions, monitors and governs resources across platforms and sites, is worth USD 4.33 billion in 2025 and grows at 12.85% a year to USD 14.50 billion in 2035. Hewlett Packard Enterprise (HPE) expanded its private cloud portfolio with Morpheus software and VM Essentials in May 2025, with multi-hypervisor support and per-socket licensing, an example of how vendors now compete on the management layer above the hypervisor.
Market Challenges: What Holds the Software-Defined Data Center Market Back?
Licensing cost shocks and the migration costs of moving thousands of virtual machines are the two constraints that DC Market Insights expects to slow the Software-Defined Data Center Market in 2026 and 2027.
Licensing Cost Increases Delay Projects and Trigger Legal Action
Cloud Infrastructure Service Providers in Europe (CISPE) filed an appeal before the European General Court in July 2025 seeking annulment of the European Commission’s approval of Broadcom’s acquisition of VMware, citing cost increases that sometimes exceeded tenfold under the new licensing conditions. FedHIVE, a compliance-as-a-service provider, faced a renewal price nine times its previous licensing price and explored other platforms. Cost shocks of this size push some enterprises to cut licensed cores, consolidate clusters or delay private cloud expansion, which is why DC Market Insights forecasts traditional virtual machine spending to grow only 5.25% a year.
Migration Takes Years, Not Months
Cleveland Clinic aims to move all its virtual machines in the roughly 19 months before its next license renewal, and Emirates NBD moved up to 200 machines per night. DC Market Insights expects migration projects to keep services spending high, at USD 11.16 billion in 2025 rising to USD 23.96 billion in 2035, while slowing the pace at which software spending shifts between vendors.
Market Opportunities: Where Are the New Revenue Pools?
The two largest new revenue pools in the Software-Defined Data Center Market are AI and data analytics workloads, growing at 16.17% a year, and edge and remote sites, growing at 12.17% a year.
AI and Data Analytics Workloads Reach USD 21.93 Billion by 2035
Enterprises that keep sensitive data on premises need private platforms that can schedule GPUs, store training data and serve models. AI and data analytics workloads account for USD 4.90 billion of spending in 2025 and USD 21.93 billion in 2035, or 21.1% of the market, by DC Market Insights estimates. Nutanix reported new or enhanced agreements with AMD, Lenovo, NetApp and NVIDIA in fiscal 2026, an example of platform vendors widening their hardware partnerships.
Edge and Remote Sites Become a Larger Revenue Pool
Edge and remote sites account for USD 4.27 billion of spending in 2025 and USD 13.47 billion in 2035, a CAGR of 12.17%, by DC Market Insights estimates. Microsoft announced Azure Local at its Ignite 2024 conference as a hybrid infrastructure solution enabled by Azure Arc that replaces Azure Stack HCI and lets enterprise customers deploy and manage virtual machines and containers at the edge.
Pricing: How Much Do Enterprises Spend per Core on Software-Defined Data Center Platforms?
Enterprises spend an average of USD 345.00 per licensed core per year on software-defined data center software in 2025, according to DC Market Insights estimates, plus services worth about 33% of that software spend.
| Software-defined data center pricing model | 2020 | 2025 | 2030 | 2035 |
|---|---|---|---|---|
| Software spend per licensed core (USD per year) | 260.00 | 345.00 | 425.78 | 477.05 |
| Licensed physical cores (million) | 78.0 | 98.0 | 129.9 | 167.4 |
| Services as a share of software spend | 36.0% | 33.0% | 31.5% | 30.0% |
Spend per core rose fastest in 2024 and 2025, when the new VMware licensing conditions reached renewals, and DC Market Insights expects it to keep rising, but more slowly, through 2035 as buyers gain alternatives and as the EU Data Act limits switching charges.
Standards and Regulation: Which Rules Shape the Software-Defined Data Center?
Four sets of rules shape how software-defined data centers are built and bought: hypervisor security guidance from the US National Institute of Standards and Technology (NIST), the Open Virtualization Format standard, the EU Digital Operational Resilience Act and the EU Data Act.
NIST SP 800-125A Revision 1. Published in June 2018, Security Recommendations for Server-based Hypervisor Platforms adds security recommendations for technologies such as device passthrough and self-virtualizing devices used in virtualized servers for high-performance applications. The guidance gives government and defense buyers, worth USD 6.43 billion in 2025, a published reference for hypervisor security.
ISO/IEC 17203:2017 (Open Virtualization Format). The Open Virtualization Format (OVF) specification describes an open, secure, efficient and extensible format for the packaging and distribution of software to be run in virtual systems.
Digital Operational Resilience Act (DORA). Regulation (EU) 2022/2554 entered into application on 17 January 2025 and covers ICT risk management and ICT third-party risk management for financial entities. Its third-party risk rules reach the platforms that banks and insurers, the largest buyer vertical at USD 10.39 billion in 2025, run their core systems on, and DC Market Insights expects them to favor multi-platform designs.
EU Data Act. The switching rules of Regulation (EU) 2023/2854 became applicable on September 12, 2025. Customers must be able to switch to another provider or to on-premises infrastructure with a maximum two months’ notice and a maximum 30-day transition period, extendable only where it is technically unfeasible, and all switching and data egress charges must be eliminated from January 12, 2027, with limited exceptions. DC Market Insights expects the rules to make it easier for European buyers to bring workloads back from public cloud into private software-defined data centers.
Market Segmentation: Which Segment Leads the Software-Defined Data Center Market?
Software-defined compute leads the Software-Defined Data Center Market with 35.2% of 2025 value, on-premises data centers lead deployment with 58.7%, and traditional virtual machines still account for 68.4% of spending. AI and data analytics workloads are the fastest-growing segment at 16.17% a year, because enterprises are moving training, inference and data pipelines onto private platforms that schedule GPUs next to virtual machines, followed by management and automation software at 12.85% among components.
By Component: Software-Defined Compute Leads with 35.2%
| Component | 2025 (USD billion) | Share 2025 | 2035 (USD billion) | CAGR 2025-2035 |
|---|---|---|---|---|
| Software-Defined Compute | 15.82 | 35.2% | 29.46 | 6.41% |
| Software-Defined Storage | 7.91 | 17.6% | 20.36 | 9.91% |
| Software-Defined Networking | 5.75 | 12.8% | 15.54 | 10.46% |
| Management and Automation | 4.33 | 9.6% | 14.50 | 12.85% |
| Services | 11.16 | 24.8% | 23.96 | 7.94% |
Software-defined compute loses 6.8 points of share by 2035 because the hypervisor layer faces the most price competition from second platforms. DC Market Insights expects networking and storage software to gain share as security and storage functions move from dedicated appliances into the private cloud platform.
By Deployment Model: On-Premises Data Centers Lead with 58.7%
| Deployment model | 2025 (USD billion) | Share 2025 | 2035 (USD billion) | CAGR 2025-2035 |
|---|---|---|---|---|
| On-Premises Data Centers | 26.40 | 58.7% | 51.15 | 6.84% |
| Hosted and Colocation Private Cloud | 14.30 | 31.8% | 39.18 | 10.61% |
| Edge and Remote Sites | 4.27 | 9.5% | 13.47 | 12.17% |
Hosted and colocation private cloud grows faster than on-premises deployments because enterprises that close their own server rooms still want dedicated, software-defined platforms, and colocation operators and managed service providers offer them as a service.
By Workload: Traditional Virtual Machines Lead with 68.4%
Traditional virtual machines account for USD 30.76 billion in 2025 and USD 51.32 billion in 2035, growing at 5.25% a year. Containers and Kubernetes account for USD 9.31 billion (20.7%) and grow at 12.62% a year to USD 30.56 billion. AI and data analytics account for USD 4.90 billion (10.9%) and grow at 16.17% a year to USD 21.93 billion, so the two newer workload types together overtake traditional virtual machines by 2035.
By Enterprise Size: Large Enterprises Lead with 71.2%
Large enterprises spend USD 32.02 billion in 2025 and USD 70.40 billion in 2035, a CAGR of 8.20%. Small and medium enterprises spend USD 12.95 billion (28.8%) and grow faster, at 9.94% a year, to USD 33.41 billion, because hyperconverged platforms and hosted private cloud let a small IT team run a software-defined estate without specialist storage and network staff.
By End-user Vertical: BFSI Leads with 23.1%
| End-user vertical | 2025 (USD billion) | Share 2025 | 2035 (USD billion) | CAGR 2025-2035 |
|---|---|---|---|---|
| BFSI | 10.39 | 23.1% | 22.99 | 8.27% |
| IT and Telecom | 9.62 | 21.4% | 23.30 | 9.25% |
| Government and Defense | 6.43 | 14.3% | 15.16 | 8.95% |
| Healthcare | 4.36 | 9.7% | 11.35 | 10.04% |
| Manufacturing | 5.31 | 11.8% | 12.20 | 8.68% |
| Retail and E-commerce | 3.87 | 8.6% | 8.68 | 8.42% |
| Others | 4.99 | 11.1% | 10.12 | 7.33% |
Banking, financial services and insurance (BFSI) is the largest vertical because, in DC Market Insights’ view, banks keep large private estates for core and regulated systems, while IT and telecom overtakes it before 2035 as operators virtualize network functions on the same platforms. Healthcare grows fastest at 10.04% a year as clinical systems and imaging archives move onto hyperconverged and private cloud platforms.
DC Exclusive: The Core × Price Model and Component × Deployment Matrix
At USD 10.08 billion in 2025, software-defined compute in on-premises data centers is the single largest cell of the matrix and 22.4% of all software-defined data center spending. The matrix below cross-tabulates what is bought and where it runs.
| 2025, USD billion | On-Premises | Hosted and Colocation | Edge and Remote | Total |
|---|---|---|---|---|
| Software-Defined Compute | 10.08 | 4.31 | 1.43 | 15.82 |
| Software-Defined Storage | 4.61 | 2.43 | 0.87 | 7.91 |
| Software-Defined Networking | 2.97 | 2.29 | 0.49 | 5.75 |
| Management and Automation | 2.10 | 1.78 | 0.45 | 4.33 |
| Services | 6.64 | 3.49 | 1.03 | 11.16 |
| Total | 26.40 | 14.30 | 4.27 | 44.97 |
Hosted and colocation private clouds spend 16.0% of their budget on networking software and 12.4% on management and automation, against 11.3% and 8.0% for on-premises data centers: multi-tenant platforms need micro-segmentation and self-service portals that a single-company estate can do without. Edge sites spend the largest share on storage software, 20.4% of their budget, because each site is a small hyperconverged cluster.
The matrix is a DC Market Insights model, not a license count. The model is built from 87 inputs: 16 annual counts of licensed cores (2020 to 2035), 16 annual values of software spend per core, 16 annual services ratios, 37 segment, regional and country weights, and 2 supplier disclosures used as a top-down cross-check. Multiplying licensed cores by spend per core gives software value; adding services gives the market. The model and its assumptions are explained on our research methodology page.
Regional Insights: Which Region Leads the Software-Defined Data Center Market?
North America leads the Software-Defined Data Center Market with 41.8% of 2025 value. Asia Pacific is the fastest-growing region at 10.84% a year, because enterprises in India, Australia and Southeast Asia are building private clouds from a smaller base while DC Market Insights estimates that North American estates are already largely virtualized.
North America Leads with 41.8% Share
North America spent USD 18.80 billion on software-defined data center software and services in 2025, and DC Market Insights forecasts USD 39.41 billion in 2035, a CAGR of 7.68%. North America loses 3.8 points of share by 2035 as other regions catch up, not because its spending slows sharply.
Europe Holds 26.6% Share
Europe is worth USD 11.96 billion in 2025 and USD 25.67 billion in 2035, a CAGR of 7.94%. DC Market Insights expects DORA and the EU Data Act to raise demand for multi-platform designs and on-premises private clouds, which supports software-defined storage, networking and management spending.
Asia Pacific Holds 22.6% Share
Asia Pacific is worth USD 10.16 billion in 2025 and USD 28.44 billion in 2035, the fastest growth of any region at 10.84% a year. China and Japan hold the largest country markets in the region, while India grows fastest as banks, government departments and telecom operators build private clouds. Asia Pacific gains 4.8 points of share, the largest gain of any region.
Latin America Holds 4.9% Share
Latin America is worth USD 2.20 billion in 2025 and USD 5.39 billion in 2035, a CAGR of 9.35%, led by Brazil, which DC Market Insights estimates at 41.8% of regional spending in 2025.
Middle East and Africa Holds 4.1% Share
The Middle East and Africa is worth USD 1.84 billion in 2025 and USD 4.90 billion in 2035, a CAGR of 10.26%. DC Market Insights expects Saudi Arabia and the United Arab Emirates to drive most of the growth as government agencies and banks build private clouds, and Emirates NBD’s move of more than 9,000 virtual machines to Red Hat OpenShift is an example of a large bank in the region adopting a second platform.
Country Analysis: Which Countries Spend the Most on Software-Defined Data Centers?
The United States is the largest country market at USD 17.01 billion in 2025, 37.8% of global value, followed by China at USD 3.23 billion (7.2%) and Germany at USD 2.49 billion (5.5%). The 12 largest countries account for 78.0% of 2025 spending.
| Rank | Country | Region | 2025 (USD billion) | Share 2025 | 2035 (USD billion) | CAGR 2025-2035 |
|---|---|---|---|---|---|---|
| 1 | United States | North America | 17.01 | 37.8% | 34.99 | 7.48% |
| 2 | China | Asia Pacific | 3.23 | 7.2% | 8.41 | 10.04% |
| 3 | Germany | Europe | 2.49 | 5.5% | 5.19 | 7.64% |
| 4 | United Kingdom | Europe | 2.34 | 5.2% | 4.85 | 7.54% |
| 5 | Japan | Asia Pacific | 2.17 | 4.8% | 5.46 | 9.64% |
| 6 | Canada | North America | 1.79 | 4.0% | 4.10 | 8.68% |
| 7 | France | Europe | 1.70 | 3.8% | 3.68 | 8.04% |
| 8 | India | Asia Pacific | 1.20 | 2.7% | 4.62 | 14.44% |
| 9 | Australia | Asia Pacific | 0.93 | 2.1% | 2.66 | 11.04% |
| 10 | Brazil | Latin America | 0.92 | 2.0% | 2.34 | 9.75% |
| 11 | Netherlands | Europe | 0.85 | 1.9% | 1.86 | 8.14% |
| 12 | Saudi Arabia | Middle East and Africa | 0.44 | 1.0% | 1.40 | 12.36% |
India is the fastest-growing country market at 14.44% a year, ahead of Saudi Arabia at 12.36% and Australia at 11.04%, and moves from eighth to sixth place by 2035. Outside the top 12, Italy is worth USD 765.52 million in 2025 and USD 1.71 billion in 2035, growing 8.34% a year, and Mexico is worth USD 577.29 million and USD 1.49 billion, growing 9.95% a year. The country figures are a DC Market Insights allocation of the regional totals, weighted by each country’s estimated share of enterprise server capacity and private cloud adoption.
Forecast Scenarios: How Could the 2035 Forecast Change?
The Software-Defined Data Center Market reaches USD 103.81 billion by 2035 in the base case, with a range of USD 86.47 billion to USD 120.21 billion across the low and high scenarios.
| Scenario | Assumption from 2026 | 2035 (USD billion) | CAGR 2025-2035 |
|---|---|---|---|
| Low | Licensed core growth 1 point lower each year; spend per core growth 1 point lower from 2028 as buyers switch platforms | 86.47 | 6.76% |
| Base | Licensed cores reach 167.4 million; spend per core reaches USD 477.05 | 103.81 | 8.73% |
| High | Licensed core growth 1 point higher each year as AI and edge sites adopt private cloud; spend per core growth 0.5 points higher | 120.21 | 10.33% |
The low case is what wider platform switching looks like: lower-priced hypervisors and the EU Data Act pull average spend per core down.
Competitive Insights: Who Leads the Software-Defined Data Center Market?
- Broadcom (VMware)
- Microsoft
- Nutanix
- Red Hat
- Hewlett Packard Enterprise
- Dell Technologies
- Cisco
- IBM
- Oracle
- Huawei
- Lenovo
- NetApp
- Pure Storage
- Scale Computing
- Juniper Networks
- Arista Networks
- Citrix
Broadcom is the market leader with about 45% of the Software-Defined Data Center Market in 2025 (DC Market Insights estimate: Broadcom’s infrastructure software revenue of USD 27.03 billion in fiscal 2025, of which DC Market Insights attributes about three quarters to VMware products, set against the USD 44.97 billion market). Broadcom’s chief executive reported VCF adoption by over 87% of its 10,000 largest customers, and its infrastructure software revenue grew 29.0% in the third quarter of fiscal 2026. Nutanix reported revenue of USD 2.85 billion in fiscal 2026, up 12% from USD 2.54 billion, ARR of USD 2.55 billion and fiscal 2027 revenue guidance of USD 3.18 billion to USD 3.23 billion (Source: Nutanix fiscal 2026 results filed with the US Securities and Exchange Commission). Microsoft competes through Azure Local, Red Hat through OpenShift Virtualization, and HPE through Morpheus and VM Essentials.
Recent Developments
- In May 2025, HPE expanded its private cloud portfolio with Morpheus software and VM Essentials, licensed per socket, claiming up to 90% lower virtual machine license costs (Source: HPCwire news report).
- In June 2025, Broadcom announced general availability of VMware Cloud Foundation 9.0, a single unified platform for traditional, modern and AI applications (Source: Broadcom press release).
- In July 2025, CISPE filed an appeal before the European General Court seeking annulment of the European Commission’s approval of Broadcom’s acquisition of VMware (Source: StorageNewsletter news report).
- In December 2025, Nutanix and Pure Storage announced general availability of a joint solution combining Nutanix Cloud Infrastructure with Pure Storage FlashArray (Source: Nutanix blog).
- In May 2026, at Red Hat Summit 2026, Emirates NBD described moving more than 9,000 virtual machines from VMware to Red Hat OpenShift (Source: TechTarget news report).
- In August 2026, Nutanix reported fiscal 2026 revenue of USD 2.85 billion and ARR of USD 2.55 billion, with over 3,000 new customers added in the year (Source: Nutanix earnings release).
We follow these launches, deals and platform shifts as they happen in our data center industry updates.
Methodology: How We Built the Software-Defined Data Center Market Model
DC Market Insights built this market bottom-up from 16 annual cohorts (2020 to 2035) of licensed physical processor cores, each priced with an average software spend per core per year: 78.0 million cores at USD 260.00 in 2020, 98.0 million cores at USD 345.00 in 2025 and 167.4 million cores at USD 477.05 in 2035. Services were added as a share of software spend, falling from 36.0% in 2020 to 33.0% in 2025 and 30.0% in 2035. The total was split by 5 components, 3 deployment models, 3 workload types, 2 enterprise sizes, 7 verticals and 5 regions, and every split sums to the market total. Country values allocate each regional total by country weights. The result was checked top-down against 2 supplier disclosures: Broadcom’s infrastructure software revenue of USD 27.03 billion in fiscal 2025 and Nutanix’s revenue of USD 2.54 billion in fiscal 2025, which together imply that the two vendors hold about half of the market on DC Market Insights’ attribution of Broadcom revenue to VMware. The analyst named on this page built the model, and the reviewer checked the arithmetic, the sources and the dates before publication.
Table of contents
- 01Introduction
- 1.1Market Definition and Scope
- 1.2Components, Deployment Models, Workloads and Regions Covered
- 1.3Currency, Base Year and Forecast Period
- 1.4Key Questions Answered
- 02Research Methodology
- 2.1Licensed Core × Spend per Core Model
- 2.2Licensed Core Cohorts, 2020-2035
- 2.3Services Ratio Model
- 2.4Top-Down Check Against Supplier Disclosures
- 2.5Assumptions and Limitations
- 03Executive Summary
- 3.1Market at a Glance, 2020-2035
- 3.2Key Findings
- 3.3Analyst Recommendations by Buyer Type
- 04Market Dynamics
- 4.1Drivers
- 4.2Challenges and Restraints
- 4.3Opportunities
- 4.4Trends
- 4.5Impact Analysis of Drivers and Challenges, 2025-2035
- 05Pricing and Cost Analysis
- 5.1Software Spend per Licensed Core, 2020-2035
- 5.2Licensing Models: per Core and per Socket
- 5.3Services as a Share of Software Spend
- 5.4Price Outlook, 2026-2030
- 06Standards and Regulation
- 6.1NIST SP 800-125A Revision 1
- 6.2ISO/IEC 17203:2017 Open Virtualization Format
- 6.3Digital Operational Resilience Act (DORA)
- 6.4EU Data Act Switching Rules
- 07Supply Chain and Value Chain Analysis
- 7.1Platform Software Vendors
- 7.2Server, Storage and Network Hardware Partners
- 7.3Distributors, Integrators and Managed Service Providers
- 7.4Migration and Platform Switching
- 08Global Software-Defined Data Center Market Size and Forecast
- 8.1Market Size, 2020-2024
- 8.2Market Size, 2025
- 8.3Market Forecast, 2026-2035
- 8.4Software vs Services Spending
- 09Market by Component
- 9.1Software-Defined Compute
- 9.2Software-Defined Storage
- 9.3Software-Defined Networking
- 9.4Management and Automation
- 9.5Services
- 10Market by Deployment Model
- 10.1On-Premises Data Centers
- 10.2Hosted and Colocation Private Cloud
- 10.3Edge and Remote Sites
- 11Market by Workload
- 11.1Traditional Virtual Machines
- 11.2Containers and Kubernetes
- 11.3AI and Data Analytics
- 12Market by Enterprise Size
- 12.1Large Enterprises
- 12.2Small and Medium Enterprises
- 13Market by End-user Vertical
- 13.1BFSI
- 13.2IT and Telecom
- 13.3Government and Defense
- 13.4Healthcare
- 13.5Manufacturing
- 13.6Retail and E-commerce
- 13.7Others
- 14DC Exclusive: Component × Deployment Model Matrix
- 14.1Component × Deployment Model Matrix, 2025
- 14.2Spending Mix by Deployment Model
- 14.3Implications for Platform Vendors
- 15Market by Region
- 15.1North America (United States, Canada)
- 15.2Europe (Germany, United Kingdom, France, Netherlands, Rest of Europe)
- 15.3Asia Pacific (China, Japan, India, Australia, Rest of Asia Pacific)
- 15.4Latin America (Brazil, Rest of Latin America)
- 15.5Middle East and Africa (Saudi Arabia, Rest of Middle East and Africa)
- 15.6Top 12 Countries, 2025 and 2035
- 16Regional Cross-Sections
- 16.1Region × Component, 2025 and 2035
- 16.2Region × Deployment Model, 2025 and 2035
- 17Forecast Scenarios
- 17.1Base, Low and High Cases to 2035
- 17.2Sensitivity to Spend per Core
- 17.3Sensitivity to Licensed Core Growth
- 18Competitive Landscape
- 18.1Market Share of the Leading Vendor, 2025
- 18.2Platform Switching and Second Platforms
- 18.3Partnerships and Product Launches, 2025-2026
- 19Company Profiles
- 19.1Broadcom (VMware)
- 19.2Microsoft
- 19.3Nutanix
- 19.4Red Hat
- 19.5Hewlett Packard Enterprise
- 19.6Dell Technologies
- 19.7Cisco
- 19.8IBM
- 19.9Oracle
- 19.10Huawei
- 19.11Lenovo
- 19.12NetApp
- 19.13Pure Storage
- 19.14Scale Computing
- 20Analyst Recommendations
- 20.1For Platform Software Vendors
- 20.2For Enterprise IT Buyers
- 20.3For Investors
- Fig. 1Software-Defined Data Center Market Size, 2020-2035
- Fig. 2Licensed Physical Cores, 2020-2035
- Fig. 3Software Spend per Licensed Core, 2020-2035
- Fig. 4Software vs Services Spending, 2020-2035
- Fig. 5Market Share by Component, 2025 and 2035
- Fig. 6Market Share by Workload, 2025 and 2035
- Fig. 7Component × Deployment Model Matrix, 2025
- Fig. 8Market by Region, 2025 and 2035
- Fig. 9Forecast Scenarios, 2025-2035
- Fig. 10Top 12 Countries, 2025
- Table 1Report Attributes
- Table 2Software-Defined Data Center Pricing Model, 2020-2035
- Table 3Market by Component, 2025 and 2035
- Table 4Market by Deployment Model, 2025 and 2035
- Table 5Market by Workload, 2025 and 2035
- Table 6Market by Enterprise Size, 2025 and 2035
- Table 7Market by End-user Vertical, 2025 and 2035
- Table 8Component × Deployment Model Matrix, 2025
- Table 9Market by Region, 2025 and 2035
- Table 10Top 12 Countries, 2025 and 2035
- Table 11Forecast Scenarios, 2035
- Table 12Partnerships and Product Launches, 2025-2026
About this report
Written by Amit Jain and reviewed by Deepti Agrawal, Senior Editor, Research. Figures are built top-down and bottom-up and reconciled before publication, with 2025 as the base year.
Read our methodologyHow we built this
- Historical period2020-2024
- Base year2025
- Forecast period2026-2035
- Sizing approachTop-down + bottom-up
Need more than the report?
Advisory on this market
Due diligence, site selection and market entry work, by the analysts who wrote this report.
See consulting servicesFrequently asked questions
USD 44.97 billion in 2025, rising to USD 103.81 billion by 2035. DC Market Insights estimates the market at USD 27.58 billion in 2020.
8.73% a year from 2025 to 2035. Growth was faster, at 10.27% a year, between 2020 and 2025 as VMware licensing moved to VMware Cloud Foundation.
12.85% a year for management and automation software, from USD 4.33 billion in 2025 to USD 14.50 billion by 2035. Software-defined compute remains the largest offering with 35.2% of 2025 value.
A 32.7% rise in software spend per core, from USD 260.00 in 2020 to USD 345.00 in 2025 according to DC Market Insights estimates, as VMware licensing moved to VMware Cloud Foundation.
16.17% a year for AI and data analytics, from USD 4.90 billion in 2025 to USD 21.93 billion by 2035. Containers and Kubernetes grow at 12.62% a year.
North America, with USD 18.80 billion or 41.8% of 2025 value. Asia Pacific grows fastest at 10.84% a year.
About 45% of the market is held by Broadcom (VMware), according to a DC Market Insights estimate. Microsoft, Nutanix, Red Hat, Hewlett Packard Enterprise, Dell Technologies, Cisco, IBM, Oracle, Huawei, Lenovo, NetApp, Pure Storage and Scale Computing also compete.
USD 17.01 billion in the United States, or 37.8% of 2025 spending, followed by China at USD 3.23 billion. India grows fastest at 14.44% a year (DC Market Insights estimate).
Licences, delivery and payment
Which licence should I choose?
Single User is a view-only PDF for one person. Multi User adds a printable PDF and the Excel data for unlimited users at one location. Enterprise covers your whole company and includes 100 free analyst hours.
How and when will I receive the report?
By email, within 24–48 business hours of payment, in the formats of your licence.
How can I pay?
Securely through PayPal: with a PayPal account, a debit or credit card, or PayPal Pay Later where available. Prices are in US dollars.
Can I see a sample first?
Yes. Request a free sample and we will email it to you.
Can the report be tailored to my needs?
Yes. We can add countries, segments or data cuts. Talk to an analyst about the scope you need.
Can I get an invoice or pay against a purchase order?
Write to sales@dcmarketinsights.com and our team will help.