
Data Center Asset Management Market Size, Share & Forecast to 2035
Market at a glance
The Data Center Asset Management market was worth USD 2,260.0 million in 2025 and is forecast to reach USD 6,100.0 million by 2035, growing at a 10.46% CAGR. North America accounts for 41.2% of the market.
 By Amit Jain, Senior Consultant, ICT & Emerging Technologies
 Reviewed by Deepti Agrawal
Last updated 10 Oct 2026
Base year 2025 PDF + Excel
Reviewed by Deepti Agrawal
Last updated 10 Oct 2026
Base year 2025 PDF + Excel
Source: DC Market Insights analysis
Key findings
Server Retirements Double from 14.37 Million to 28.55 Million a Year
Cloud and SaaS Tools Reach 63.8% of Software Spend
Hyperscalers Keep Most Asset Work In-House
Edge and Telecom Sites Need Remote Inventories
What is inside the report
- 01Introduction
- 02Research Methodology
- 03Executive Summary
- 04Market Dynamics
- 05Pricing Analysis
- 06Standards and Regulation
- 07Supply Chain and Asset Lifecycle
- 08Market Size and Forecast
- 09Market by Component
- 10Market by Asset Type
- 21chapters
- 2020-2024Historical period
- 2026-2035Forecast period
- 14Companies profiled
Regional insights
- North America41.2%
- Asia Pacific26.3%
- Europe24.6%
- Latin America4.3%
- Middle East and Africa3.6%
Segmentation
Companies profiled
- Iron Mountain
- SK tes
- Schneider Electric
- Vertiv
- Sunbird Software
- Carrier (Nlyte)
- Hyperview
- Freshworks (Device42)
- ServiceNow
- RF Code
- Sims Lifecycle Services
- Blancco
- Dell Technologies
- Hewlett Packard Enterprise
Recent developments
SK tes announced a purpose-built 36,000 square foot ITAD and data center lifecycle facility in Shannon, Ireland, to serve customers including hyperscale data centers (Source: SK tes press release).
McCarter & English reported that it had represented Iron Mountain in its acquisition of Premier Surplus, which complements Iron Mountain's asset lifecycle management services (Source: McCarter & English transaction announcement).
NIST published SP 800-88 Rev. 2, Guidelines for Media Sanitization (Source: NIST publication record).
Iron Mountain acquired ACT Logistics, expanding its investment in asset lifecycle management (Source: IDM trade report).
Sunbird released a dcTrack version that adds OAuth2 authentication to its ServiceNow Asset Connector (Source: Sunbird press release).
Iron Mountain reported Q4 2025 ALM revenue of USD 190 million, up 70%, and guided to USD 850 million of ALM revenue in 2026 (Source: Iron Mountain earnings call).
Full analysis
The Data Center Asset Management Market covers the software, tracking hardware and services that data center operators use to record, locate and finally retire the servers, storage, network and facility assets inside their buildings. DC Market Insights values the global Data Center Asset Management Market at USD 2.26 billion in 2025 and forecasts USD 6.10 billion by 2035, a CAGR of 10.46%. The 2025 value is built from the fleet itself: about 14.37 million servers retired worldwide, of which 60% pass through professional decommissioning and IT asset disposition (ITAD) at about USD 165 of service and remarketing revenue per server, gives USD 1.42 billion; software on 35% of about 7.46 million racks at USD 165 per rack per year adds USD 430.81 million, and tracking hardware and professional services complete the total. Edge and telecom data centers are the fastest-growing segment at 14.04% a year because small, unstaffed sites cannot be audited by walking the floor, and the Middle East and Africa is the fastest-growing region at 11.91% a year, because DC Market Insights expects its new large campuses to buy asset software from day one and to retire their first server fleets before 2035.
Executive Summary
The Global Data Center Asset Management Market size was valued at USD 1.18 billion in 2020, reached USD 2.26 billion in 2025, and is anticipated to reach USD 6.10 billion by 2035, at a CAGR of 10.46% during the forecast period.
| Report attribute | Details |
|---|---|
| Historical Period | 2020-2024 |
| Base Year | 2025 |
| Forecast Period | 2026-2035 |
| Data Center Asset Management Market Size 2025 | USD 2.26 Billion |
| Data Center Asset Management Market, CAGR | 10.46% |
| Data Center Asset Management Market Size 2035 | USD 6.10 Billion |
The market grew at 13.85% a year between 2020 and 2025, and 2025 alone added 13.5% over 2024, as the global server fleet expanded from about 52.5 million to about 74.7 million units in the DC Market Insights model. Decommissioning and ITAD services made up 63.1% of 2025 value, because every retired server needs a verified chain of custody and a resale or recycling route.
Growth slows to 10.46% a year from 2025 to 2035. The installed server base keeps rising, to about 137.0 million units in 2035, and DC Market Insights assumes that AI servers shorten the average service life from 5.2 years to 4.8 years, which lifts annual retirements from 14.37 million to 28.55 million. Software adoption rises more slowly, from 35% of racks in 2025 to 52% in 2035.

Market Scope: What Does the Data Center Asset Management Market Cover?
The Data Center Asset Management Market covers vendor revenue from managing the physical assets of a data center across their whole life, valued in current US dollars, with 2025 as the base year and forecasts to 2035. DC Market Insights sizes it at USD 2.26 billion in 2025.
Included. Asset management software, meaning the asset, inventory and capacity modules of data center infrastructure management (DCIM) suites and the discovery and IT asset management (ITAM) tools used for data center hardware, sold as cloud subscriptions or on-premises licenses. Asset tracking hardware: RFID tags and readers, barcode labels, printers and scanners, and rack-level sensor strips used to locate assets. Decommissioning and ITAD services: on-site de-racking, chain-of-custody logistics, drive sanitization and shredding, audit reporting, and the remarketing and recycling revenue that ITAD providers book. Professional and managed services: physical audits, inventory reconciliation, tagging projects, integration with service-management systems, and outsourced asset operations.
Excluded. The value of the servers, drives and network equipment themselves, power and environmental monitoring modules of DCIM that do not track assets, building access control, laptops and end-user devices, and the general-purpose service-management platforms that asset tools connect to.
How the segments fit together. The component split (software, tracking hardware, decommissioning and ITAD services, professional and managed services) adds up to the market total, and the asset-type and data-center-type splits re-cut the same USD 2.26 billion. The software-deployment split covers only the software component, worth USD 430.81 million in 2025. Radio-frequency identification (RFID) tracking hardware is sized on its own in the Data Center RFID Market report.
Market Drivers: What Drives the Data Center Asset Management Market?
Three drivers explain most of the growth in the Data Center Asset Management Market: annual server retirements that DC Market Insights models rising from 14.37 million in 2025 to 28.55 million in 2035, a step-up in component resale value that turns decommissioning into a revenue line, and stricter rules on data destruction and reporting.
Server Retirements Double from 14.37 Million to 28.55 Million a Year
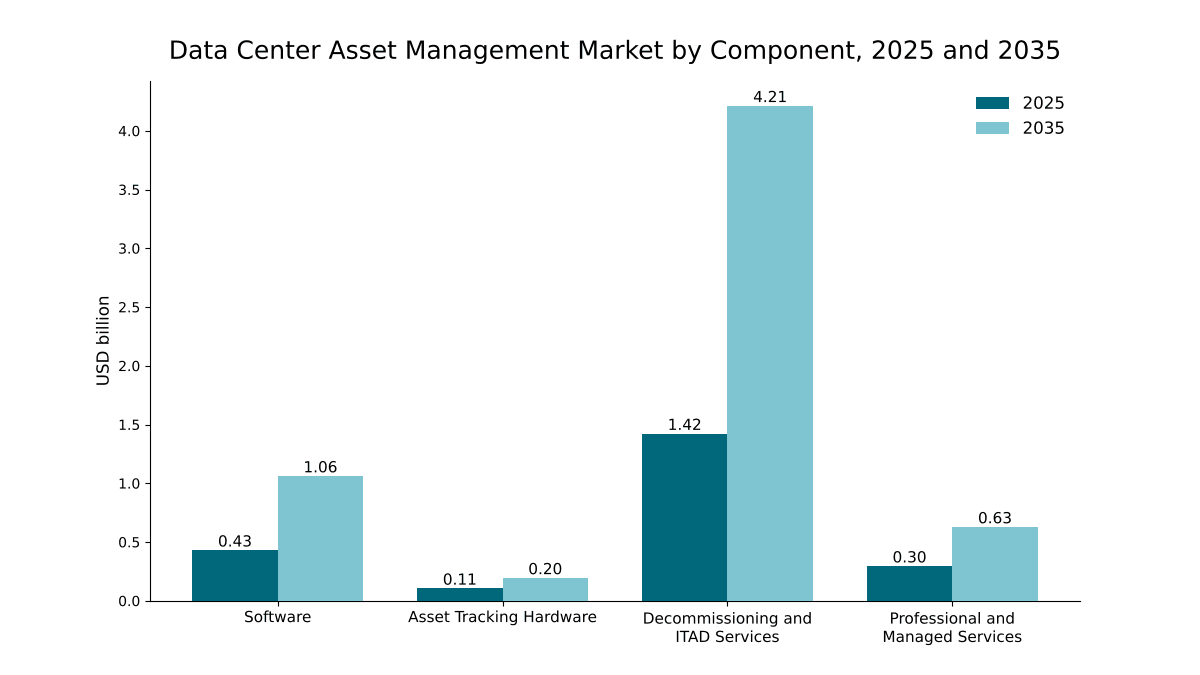
DC Market Insights estimates the global installed base at about 74.7 million servers in 2025, anchored on the Lawrence Berkeley National Laboratory count of 21 million US servers at the end of 2020 and its projection of almost 37 million US servers by 2028, of which 8 to 12 million are AI servers. With an average service life of 5.2 years, about 14.37 million servers left service in 2025; at 4.8 years and a fleet of about 137.0 million, retirements reach 28.55 million in 2035. Decommissioning and ITAD services therefore grow fastest among components, at 11.47% a year, from USD 1.42 billion to USD 4.21 billion.
Component Resale Turns Decommissioning into a Revenue Line
Retired AI servers carry memory, processors and accelerators that keep a resale value, which lets ITAD providers book remarketing revenue on top of service fees. Iron Mountain reported that its asset lifecycle management (ALM) revenue increased 63% in 2025, including 40% on an organic basis. On the same call, the company said memory tends to be between 40% and 50% of the revenue in its ALM pricing discussion, and that hyperscale customers represent generally about 40% of its ALM business. DC Market Insights models blended decommissioning and ITAD revenue per retired server rising from USD 165 in 2025 to USD 205 in 2035 as the share of high-value AI hardware in the retirement stream grows.
Data Destruction and Reporting Rules Raise the Floor on Spend
Regulators now expect documented proof of what happened to each asset. The European Union’s ecodesign rules for servers have required a secure data deletion function since 1 March 2020, and the EU reporting rules for data centers of at least 500 kW require operators to report by 15 May each year. In the United States, the National Institute of Standards and Technology (NIST) published a revised media sanitization guideline in September 2025. Each rule adds audit trails and inventory reconciliation, and DC Market Insights forecasts professional and managed services to grow at 7.85% a year, from USD 295.21 million in 2025 to USD 628.59 million in 2035.
Market Trends: How Is Data Center Asset Management Changing?
The Data Center Asset Management Market is shifting toward cloud-delivered software, closer links between asset records and service-management platforms, and hyperscale-grade decommissioning plants built near the largest data center clusters.
Cloud and SaaS Tools Reach 63.8% of Software Spend
Cloud and software-as-a-service (SaaS) asset tools accounted for USD 199.47 million, or 46.3% of software spend, in 2025, and DC Market Insights forecasts them to grow at 13.01% a year to USD 677.62 million, 63.8% of software spend, by 2035. On-premises licenses grow only 5.21% a year. Subscription pricing lowers the entry cost: one vendor, Hyperview, lists its base subscription at USD 3 per asset per year with a 500-asset minimum and its asset tracking add-on at USD 24 per rack per year.
Asset Records Move into the Service-Management Workflow
Operators want one record per asset across facilities, IT and finance teams, so DCIM vendors now build connectors to the service-management systems that hold the configuration database. In December 2025, Sunbird released a dcTrack version that adds OAuth2 authentication to its ServiceNow Asset Connector. The same logic drove consolidation: Freshworks agreed in May 2024 to acquire Device42, which helps companies manage their IT infrastructure from mainframes to cloud, for USD 230 million.
Decommissioning Plants Scale to Hyperscale Volumes
ITAD providers are building dedicated plants beside the largest clusters. In April 2025, SK tes announced a purpose-built 36,000 square foot site in Shannon, Ireland, due to open in mid-2025 to serve Irish enterprises, including hyperscale data centers, and in July 2023 the company, then TES, announced a 128,000 square foot site in Virginia to be designed exclusively for data center ITAD, scaling from 5,000 drives at a time to 100,000 drives simultaneously. Iron Mountain says it processes more than 1 million servers and more than 3 million drives a year. DC Market Insights estimates that 60% of retired servers passed through professional decommissioning in 2025, rising to 72% in 2035.
Market Challenges: What Holds the Data Center Asset Management Market Back?
Inaccurate inventories and a shortage of skilled staff are the two constraints that DC Market Insights expects to slow the Data Center Asset Management Market, with only 35% of racks under dedicated asset software in 2025.
Hyperscalers Keep Most Asset Work In-House
The largest operators run their own reuse programs, which caps what outside vendors can sell to them. Microsoft reported a 90.9% reuse and recycling rate for servers and components in 2024 and reused more than 3.2 million components through internal and external channels, using a network of Circular Centers that began with Amsterdam in 2020. DC Market Insights assumes that in-house programs of this scale buy outside sanitization, logistics and resale capacity mainly for peaks, so hyperscale data centers spend only USD 129.27 million on outside asset software in 2025, less than enterprise data centers.
Skills Gaps Leave Inventories Out of Date
Asset records are only as good as the last audit. Uptime Institute’s 2026 survey found that 53% of operators report difficulty finding qualified candidates, up from 46% in 2025. Sites without the staff to reconcile every change keep spreadsheet inventories that drift from reality. DC Market Insights forecasts enterprise data centers, where this gap is widest, to grow at only 7.25% a year.
Market Opportunities: Where Are the New Revenue Pools?
The two largest new revenue pools in the Data Center Asset Management Market are edge and telecom sites, growing at 14.04% a year, and the remarketing of retired AI hardware.
Edge and Telecom Sites Need Remote Inventories
Edge and telecom data centers spent USD 126.28 million on asset management in 2025, and DC Market Insights forecasts USD 469.64 million by 2035, more than three and a half times the 2025 level. Small rooms with no on-site staff are audited through remote discovery and tags rather than walk-throughs. Automating those audits is one of the use cases covered in the Data Center Automation Market report.
Retired AI Servers Lift Recovery Value per Server
Iron Mountain expects USD 850 million of ALM revenue in 2026, about 35% growth, and its chief financial officer put the total addressable market for data center decommissioning at USD 8 billion in August 2025. DC Market Insights sizes the decommissioning and ITAD component at USD 1.42 billion in 2025, 17.8% of that figure, which leaves room for providers that can test, refurbish and resell accelerators and high-capacity memory rather than shred them.
Pricing: How Much Do Operators Spend on Asset Management per Rack and per Server?
A data center spent about USD 165 per rack per year on asset management software in 2025, and about USD 165 of decommissioning and ITAD revenue was earned per retired server. These are DC Market Insights estimates, including remarketing revenue.
| Price point (USD) | 2020 | 2025 | 2030 | 2035 |
|---|---|---|---|---|
| Software per managed rack per year | 150.00 | 165.00 | 171.50 | 178.00 |
| Tracking hardware per rack per year | 12.50 | 14.20 | 15.60 | 17.00 |
| Decommissioning and ITAD revenue per retired server | 140.00 | 165.00 | 185.00 | 205.00 |
| Share of racks under asset software | 26.0% | 35.0% | 43.5% | 52.0% |
Software prices per rack rise slowly as subscription tools undercut perpetual licenses. Revenue per retired server rises faster, by about 2.2% a year from 2025, because each retired AI server carries more resalable memory and accelerator content than a general-purpose server.
Standards and Regulation: Which Rules Shape Data Center Asset Management?
Three rules decide how data center assets must be tracked and retired: NIST media sanitization guidance, the EU ecodesign regulation for servers and the EU data center reporting regulation.
NIST SP 800-88 Rev. 2 (September 2025). The NIST Guidelines for Media Sanitization help organizations set up a media sanitization program with techniques and controls for sanitization and disposal based on the sensitivity of their information.
EU Regulation 2019/424. The EU ecodesign regulation for servers and data storage products requires a functionality for secure data deletion from 1 March 2020, and from 1 March 2021 the latest firmware must be available for at least eight years after the last product of a model is placed on the market.
EU Delegated Regulation 2024/1364. Operators of data centers with an installed IT power demand of at least 500 kW had to report by 15 September 2024, then by 15 May 2025 and every year after.
Market Segmentation: Which Segment Leads the Data Center Asset Management Market?
Decommissioning and ITAD services lead the Data Center Asset Management Market with 63.1% of 2025 value, servers and compute lead asset types with 52.4%, and hyperscale data centers lead buyers with 38.6%. Edge and telecom data centers are the fastest-growing segment at 14.04% a year, because unstaffed sites need remote inventories, while decommissioning and ITAD services are the fastest-growing component at 11.47% a year.
By Component: Decommissioning and ITAD Services Lead with 63.1%
| Component | 2025 (USD billion) | Share 2025 | 2035 (USD billion) | CAGR 2025-2035 |
|---|---|---|---|---|
| Decommissioning and ITAD Services | 1.42 | 63.1% | 4.21 | 11.47% |
| Software | 0.43 | 19.1% | 1.06 | 9.44% |
| Professional and Managed Services | 0.30 | 13.1% | 0.63 | 7.85% |
| Asset Tracking Hardware | 0.11 | 4.7% | 0.20 | 6.30% |
Decommissioning gains 6.0 points of share by 2035, reaching 69.1%, because retirements double while software adoption rises more gradually. Asset tracking hardware grows slowest at 6.30% a year.
By Asset Type: Servers and Compute Lead with 52.4%
| Asset type | 2025 (USD billion) | Share 2025 | 2035 (USD billion) | CAGR 2025-2035 |
|---|---|---|---|---|
| Servers and Compute | 1.18 | 52.4% | 3.42 | 11.22% |
| Storage and Drives | 0.49 | 21.6% | 1.18 | 9.22% |
| Network Equipment | 0.28 | 12.3% | 0.72 | 10.00% |
| Power and Cooling Assets | 0.20 | 8.9% | 0.52 | 10.08% |
| Racks, Cabling and Other | 0.11 | 4.8% | 0.26 | 9.00% |
Servers and compute carry the highest resale value and the shortest life, so they take more than half of spend; storage and drives grow slower at 9.22% a year.
By Data Center Type: Hyperscale Data Centers Lead with 38.6%
| Data center type | 2025 (USD billion) | Share 2025 | 2035 (USD billion) | CAGR 2025-2035 |
|---|---|---|---|---|
| Hyperscale Data Centers | 0.87 | 38.6% | 2.68 | 11.89% |
| Enterprise Data Centers | 0.71 | 31.7% | 1.44 | 7.25% |
| Colocation Data Centers | 0.54 | 24.1% | 1.51 | 10.78% |
| Edge and Telecom Data Centers | 0.13 | 5.6% | 0.47 | 14.04% |
Hyperscale buyers spend 71.9% of their asset management budget on decommissioning and ITAD, against 59.0% for enterprise data centers. Colocation spend overtakes enterprise spend shortly before 2035 as tenants move out of owned halls.
By Software Deployment: Cloud and SaaS Grow Fastest at 13.01%
Within the USD 430.81 million software component, on-premises licenses hold 53.7% in 2025 and cloud and SaaS subscriptions 46.3%. Cloud and SaaS overtake on-premises tools before 2028.
DC Exclusive: The Retirement Flow Model and Component × Buyer Matrix
At USD 626.23 million in 2025, hyperscale decommissioning and ITAD is the single largest cell of the matrix and 27.8% of all data center asset management spending. The matrix cross-tabulates what is bought against who buys it. It is a DC Market Insights model, not a vendor revenue count, built from 31 inputs: 27 driver anchors (9 drivers, from installed servers and service life to software price per rack, each set for 2020, 2025 and 2035) and 4 buyer-mix profiles, one per component.
| 2025, USD million | Hyperscale | Colocation | Enterprise | Edge and Telecom | Total |
|---|---|---|---|---|---|
| Decommissioning and ITAD Services | 626.23 | 306.72 | 421.45 | 68.73 | 1,423.13 |
| Software | 129.27 | 119.39 | 148.86 | 33.29 | 430.81 |
| Professional and Managed Services | 88.50 | 84.77 | 104.84 | 17.10 | 295.21 |
| Asset Tracking Hardware | 26.47 | 32.59 | 39.71 | 7.16 | 105.93 |
| Total | 870.47 | 543.47 | 714.86 | 126.28 | 2,255.08 |
Enterprise data centers are the largest buyers of software at USD 148.86 million, even though hyperscale data centers spend more in total, because hyperscalers build most of their asset tools in-house. Colocation operators spend the highest share on tracking hardware, at 6.0%. Edge and telecom sites spend 26.4% of their budget on software, the highest software share of any buyer.
The retirement flow model behind these figures has inputs that any reader can check: the installed server base (about 74.7 million in 2025), the average service life (5.2 years) and the share of retirements handled by professional ITAD (60%). Multiplying retirements by revenue per server gives decommissioning spend; adding software and hardware per rack, and services as a ratio of both, gives the market. The model and its assumptions are explained on our research methodology page.
Regional Insights: Which Region Leads the Data Center Asset Management Market?
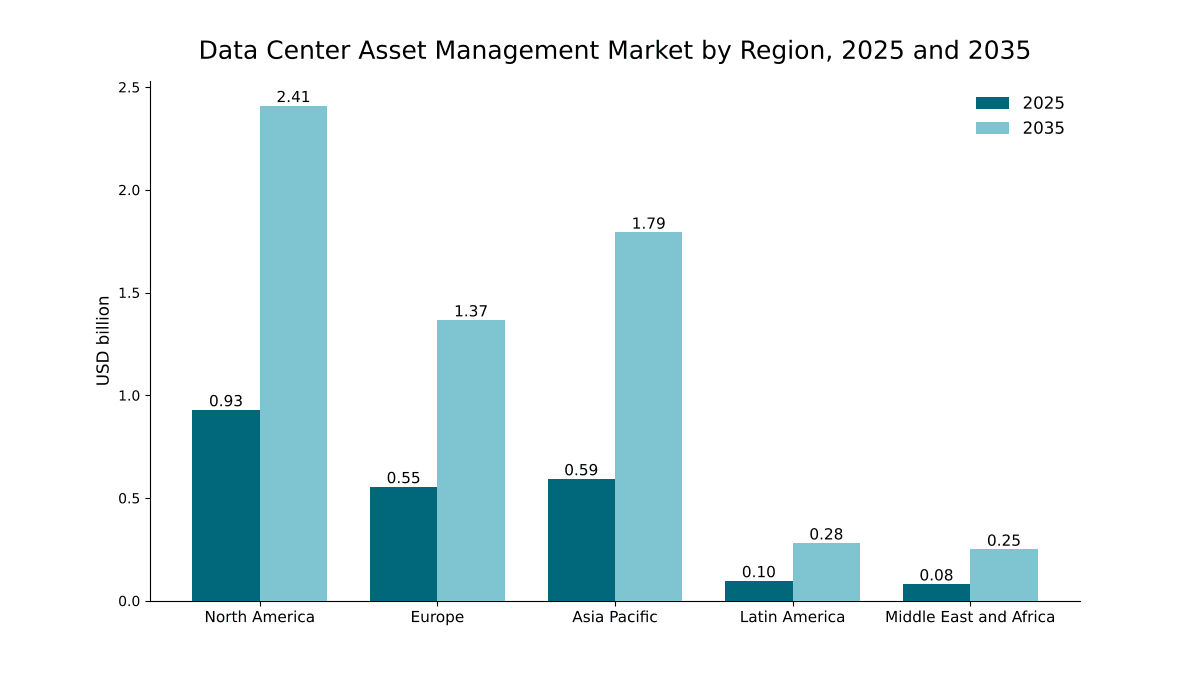
North America leads the Data Center Asset Management Market with 41.2% of 2025 value, and the Middle East and Africa is the fastest-growing region at 11.91% a year, because DC Market Insights expects its new large campuses to build asset records from day one and to retire their first server fleets before 2035.
North America Leads with 41.2% Share
North American operators spent USD 929.09 million on asset management in 2025, and the region is forecast to reach USD 2.41 billion in 2035, a CAGR of 10.00%. The United States accounted for 45% of global data center electricity use in 2024, according to the International Energy Agency (IEA). North America loses 1.7 points of share by 2035.
Asia Pacific Holds 26.3% Share
Asia Pacific is worth USD 593.09 million in 2025 and USD 1.79 billion by 2035, a CAGR of 11.70%. China, which used 25% of global data center electricity in 2024 according to the IEA, is the second-largest country market, and India and Australia grow fastest in the DC Market Insights model. Asia Pacific gains 3.1 points of share, the largest gain of any region.
Europe Holds 24.6% Share
Europe is worth USD 554.75 million in 2025 and USD 1.37 billion by 2035, a CAGR of 9.43%. In the DC Market Insights model, Europe’s share of spend is well above its 15% share of data center electricity, according to the IEA, because EU reporting and ecodesign rules raise documentation and reuse requirements per asset.
Latin America Holds 4.3% Share
Latin America is worth USD 96.97 million in 2025 and USD 280.56 million by 2035, a CAGR of 11.21%, led by Brazil.
Middle East and Africa Holds 3.6% Share
The Middle East and Africa is worth USD 81.18 million in 2025 and USD 250.07 million by 2035, a CAGR of 11.91%. DC Market Insights expects most of the growth to come from large new campuses in the Gulf states, which buy software and tracking hardware first and decommissioning services later in the decade.
Country Analysis: Which Countries Spend the Most on Data Center Asset Management?
The United States is the largest country market for data center asset management at USD 841.14 million in 2025, 37.3% of global value, followed by China at USD 221.00 million (9.8%) and the United Kingdom at USD 133.05 million (5.9%). The 12 largest countries account for 79.8% of 2025 spending.
| Rank | Country | Region | 2025 (USD billion) | Share 2025 | 2035 (USD billion) | CAGR 2025-2035 |
|---|---|---|---|---|---|---|
| 1 | United States | North America | 0.84 | 37.3% | 2.16 | 9.89% |
| 2 | China | Asia Pacific | 0.22 | 9.8% | 0.68 | 11.95% |
| 3 | United Kingdom | Europe | 0.13 | 5.9% | 0.32 | 9.08% |
| 4 | Germany | Europe | 0.12 | 5.2% | 0.29 | 9.35% |
| 5 | Japan | Asia Pacific | 0.09 | 4.1% | 0.24 | 10.19% |
| 6 | Canada | North America | 0.09 | 3.9% | 0.25 | 11.02% |
| 7 | France | Europe | 0.07 | 2.9% | 0.16 | 9.26% |
| 8 | Netherlands | Europe | 0.06 | 2.6% | 0.14 | 9.12% |
| 9 | India | Asia Pacific | 0.05 | 2.2% | 0.22 | 16.04% |
| 10 | Australia | Asia Pacific | 0.05 | 2.1% | 0.15 | 12.08% |
| 11 | Brazil | Latin America | 0.05 | 2.0% | 0.13 | 11.52% |
| 12 | Ireland | Europe | 0.04 | 1.8% | 0.10 | 9.83% |
India is the fastest-growing large country market at 16.04% a year, ahead of Australia at 12.08% and China at 11.95%, as DC Market Insights expects new hyperscale capacity there to reach its first refresh cycle within the forecast period. The country figures are a DC Market Insights allocation of the regional totals, weighted by each country’s estimated share of installed servers, new capacity and ITAD processing capacity.
Forecast Scenarios: How Could the 2035 Forecast Change?
The Data Center Asset Management Market reaches USD 6.10 billion by 2035 in the base case, with a range of USD 4.60 billion to USD 7.78 billion across the low and high scenarios.
| Scenario | Assumption from 2026 | 2035 (USD billion) | CAGR 2025-2035 |
|---|---|---|---|
| Low | Server fleet grows 5.0% then 3.8% a year; ITAD share reaches 66%; USD 185 per retired server; 45% of racks under software | 4.60 | 7.38% |
| Base | Server fleet grows 7.0% then 5.5% a year; ITAD share reaches 72%; USD 205 per retired server; 52% of racks under software | 6.10 | 10.46% |
| High | Server fleet grows 8.5% then 6.8% a year; ITAD share reaches 78%; USD 225 per retired server; 58% of racks under software | 7.78 | 13.18% |
The low case reflects a pause in AI capital spending: fewer servers enter service, so fewer leave it, and lower memory prices cut remarketing revenue. The high case assumes faster AI refreshes and firm component prices.
Competitive Insights: Who Leads the Data Center Asset Management Market?
- Iron Mountain
- SK tes
- Schneider Electric
- Vertiv
- Sunbird Software
- Carrier (Nlyte)
- Hyperview
- Freshworks (Device42)
- ServiceNow
- RF Code
- Sims Lifecycle Services
- Blancco
- Dell Technologies
- Hewlett Packard Enterprise
Iron Mountain is the market leader with about 15% of the Data Center Asset Management Market in 2025 (DC Market Insights estimate: about USD 330 million of data center work, set against the USD 2.26 billion market, made up of about USD 250 million of hyperscale work and about USD 80 million of enterprise and colocation data center work). The estimate starts from the company’s own figures: Iron Mountain expects USD 850 million of ALM revenue in 2026, about 35% growth, which DC Market Insights reads as about USD 630 million in 2025, and hyperscale represents generally about 40% of its ALM business. Iron Mountain built that position through acquisitions, including the ITAD provider Regency Technologies at an initial price of USD 200 million, and Premier Surplus and ACT Logistics in 2025. Its full-year 2025 revenue was USD 6.9 billion (Source: Iron Mountain filing with the US Securities and Exchange Commission). SK tes has announced dedicated data center ITAD sites in Virginia and in Shannon, Ireland. Sunbird, with its dcTrack software, and Carrier, through its purchase of the DCIM vendor Nlyte, compete on DCIM asset software, while Freshworks, through Device42, helps companies manage their IT infrastructure, and Sunbird connects dcTrack to ServiceNow asset records.
Recent Developments
- In April 2025, SK tes announced a purpose-built 36,000 square foot ITAD and data center lifecycle facility in Shannon, Ireland, to serve customers including hyperscale data centers (Source: SK tes press release).
- In May 2025, McCarter & English reported that it had represented Iron Mountain in its acquisition of Premier Surplus, which complements Iron Mountain’s asset lifecycle management services (Source: McCarter & English transaction announcement).
- In September 2025, NIST published SP 800-88 Rev. 2, Guidelines for Media Sanitization (Source: NIST publication record).
- In November 2025, Iron Mountain acquired ACT Logistics, expanding its investment in asset lifecycle management (Source: IDM trade report).
- In December 2025, Sunbird released a dcTrack version that adds OAuth2 authentication to its ServiceNow Asset Connector (Source: Sunbird press release).
- In February 2026, Iron Mountain reported Q4 2025 ALM revenue of USD 190 million, up 70%, and guided to USD 850 million of ALM revenue in 2026 (Source: Iron Mountain earnings call).
We follow these deals, launches and capacity announcements as they happen in our data center industry updates.
Methodology: How We Built the Data Center Asset Management Market Model
DC Market Insights built this market bottom-up from 16 annual cohorts (2020 to 2035) of installed servers and racks. The server base starts from the Lawrence Berkeley National Laboratory US counts (21 million in 2020, almost 37 million by 2028) divided by a 40% US share of global servers, a DC Market Insights assumption anchored on the US 45% share of data center electricity reported by the IEA; this gives about 74.7 million servers in 2025. Retirements equal the installed base divided by an assumed service life (5.6 years in 2020, 5.2 years in 2025, 4.8 years in 2035). Decommissioning and ITAD spend equals retirements times the share handled by professional providers (52%, 60% and 72%) times revenue per retired server (USD 140, USD 165 and USD 205). The rack base comes from 415 TWh of data center electricity in 2024 (IEA), a power usage effectiveness (PUE) of 1.54 and an average modal rack density of 7.5 kW, excluding outliers (Uptime Institute 2025 survey), at an assumed 55% average utilization: about 30.8 GW of IT load and 7.46 million racks. Software equals racks times the share under asset software times the price per rack; tracking hardware equals racks times hardware spend per rack; professional and managed services equal 58%, 55% and 50% of software and hardware. Values between anchor years are interpolated, and every split sums to the total.
The result was checked against three bounds. As a floor, the decommissioning and ITAD component (USD 1.42 billion) must exceed the data center part of the largest provider’s business, which DC Market Insights estimates at about USD 250 million of hyperscale ALM revenue at Iron Mountain in 2025 (USD 850 million of 2026 guidance divided by 1.35, times the 40% hyperscale share). As a ceiling, it sits at 17.8% of the USD 8 billion data center decommissioning addressable market cited by Iron Mountain’s chief financial officer. As a spend check, the whole market equals 0.51% of the USD 444.1 billion of worldwide server revenue in 2025 reported by IDC. The analyst named on this page built the model, and the reviewer checked the arithmetic and sources before publication.
Table of contents
- 01Introduction
- 1.1Market Definition and Scope
- 1.2Asset Lifecycle Stages Covered
- 1.3Currency, Base Year and Forecast Period
- 1.4Key Stakeholders
- 02Research Methodology
- 2.1Research Approach
- 2.2Retirement Flow and Rack Base Model
- 2.3Bound Checks
- 2.4Data Sources and Assumptions
- 03Executive Summary
- 3.1Market Snapshot, 2025 and 2035
- 3.2Key Findings
- 3.3Analyst View
- 04Market Dynamics
- 4.1Market Drivers
- 4.2Market Trends
- 4.3Market Challenges
- 4.4Market Opportunities
- 05Pricing Analysis
- 5.1Software Price per Managed Rack
- 5.2Tracking Hardware Spend per Rack
- 5.3Decommissioning and ITAD Revenue per Retired Server
- 06Standards and Regulation
- 6.1NIST SP 800-88 Rev. 2 Media Sanitization
- 6.2EU Regulation 2019/424 Ecodesign for Servers
- 6.3EU Delegated Regulation 2024/1364 Data Center Reporting
- 07Supply Chain and Asset Lifecycle
- 7.1Procurement and Receiving
- 7.2Deployment, Tagging and Tracking
- 7.3Operation and Audit
- 7.4Decommissioning, Sanitization and Remarketing
- 08Market Size and Forecast
- 8.1Market Size, 2020-2035
- 8.2Year-on-Year Growth
- 8.3Installed Servers and Annual Retirements
- 09Market by Component
- 9.1Software
- 9.2Asset Tracking Hardware
- 9.3Decommissioning and ITAD Services
- 9.4Professional and Managed Services
- 10Market by Asset Type
- 10.1Servers and Compute
- 10.2Storage and Drives
- 10.3Network Equipment
- 10.4Power and Cooling Assets
- 10.5Racks, Cabling and Other
- 11Market by Data Center Type
- 11.1Hyperscale Data Centers
- 11.2Colocation Data Centers
- 11.3Enterprise Data Centers
- 11.4Edge and Telecom Data Centers
- 12Market by Software Deployment
- 12.1Cloud and SaaS
- 12.2On-Premises
- 13DC Exclusive: Retirement Flow Model and Component × Buyer Matrix
- 13.1Matrix, 2025
- 13.2Model Inputs
- 14Market by Region
- 14.1North America (United States, Canada)
- 14.2Europe (United Kingdom, Germany, France, Netherlands, Ireland, Rest of Europe)
- 14.3Asia Pacific (China, Japan, India, Australia, Rest of Asia Pacific)
- 14.4Latin America (Brazil, Rest of Latin America)
- 14.5Middle East and Africa
- 15Country Analysis
- 15.1Top 12 Countries, 2025 and 2035
- 15.2Fastest-Growing Countries
- 16Regional Cross-Sections
- 16.1Regional Share Shift, 2025 to 2035
- 16.2Regional Growth Comparison
- 17Forecast Scenarios
- 17.1Low Scenario
- 17.2Base Scenario
- 17.3High Scenario
- 18Competitive Landscape
- 18.1Market Leader and Concentration
- 18.2Competitive Positioning by Component
- 18.3Mergers and Acquisitions
- 19Company Profiles
- 19.1Iron Mountain
- 19.2SK tes
- 19.3Schneider Electric
- 19.4Vertiv
- 19.5Sunbird Software
- 19.6Carrier (Nlyte)
- 19.7Hyperview
- 19.8Freshworks (Device42)
- 19.9ServiceNow
- 19.10RF Code
- 19.11Sims Lifecycle Services
- 19.12Blancco
- 19.13Dell Technologies
- 19.14Hewlett Packard Enterprise
- 20Recent Developments
- 20.1Deals and Acquisitions
- 20.2Facilities and Capacity
- 20.3Product Releases and Standards
- 21Analyst Recommendations
- 21.1For Data Center Operators
- 21.2For ITAD and Service Providers
- 21.3For Software Vendors
- 21.4For Investors
- Fig. 1Data Center Asset Management Market Size, 2020–2035
- Fig. 2Data Center Asset Management Market by Component, 2025 and 2035
- Fig. 3Data Center Asset Management Market by Region, 2025 and 2035
- Table 1Report Attributes
- Table 2Asset Management Price Points, 2020, 2025, 2030 and 2035
- Table 3Market by Component, 2025 and 2035
- Table 4Market by Asset Type, 2025 and 2035
- Table 5Market by Data Center Type, 2025 and 2035
- Table 6Market by Software Deployment, 2025 and 2035
- Table 7Component × Data Center Type Matrix, 2025
- Table 8Market by Region, 2025 and 2035
- Table 9Top 12 Countries, 2025 and 2035
- Table 10Forecast Scenarios, 2035
About this report
Written by Amit Jain and reviewed by Deepti Agrawal, Senior Editor, Research. Figures are built top-down and bottom-up and reconciled before publication, with 2025 as the base year.
Read our methodologyHow we built this
- Historical period2020-2024
- Base year2025
- Forecast period2026-2035
- Sizing approachTop-down + bottom-up
Need more than the report?
Advisory on this market
Due diligence, site selection and market entry work, by the analysts who wrote this report.
See consulting servicesFrequently asked questions
USD 2.26 billion in 2025, rising to USD 6.10 billion by 2035. DC Market Insights estimates the market at USD 1.18 billion in 2020.
10.46% a year from 2025 to 2035. Growth was faster, at 13.85% a year, between 2020 and 2025 as the global server fleet expanded.
Decommissioning and ITAD services, with USD 1.42 billion or 63.1% of the market in 2025. They are also the fastest-growing component at 11.47% a year.
About USD 165 per managed rack per year on software in 2025, plus USD 14.20 per rack on tracking hardware, according to DC Market Insights estimates.
North America, with USD 929.09 million or 41.2% of 2025 value. The Middle East and Africa grows fastest at 11.91% a year.
Iron Mountain leads with about 15% of the market (DC Market Insights estimate). SK tes, Schneider Electric, Vertiv, Sunbird Software, Carrier (Nlyte), Hyperview, Freshworks (Device42), ServiceNow and RF Code also compete.
Edge and telecom data centers, at 14.04% a year from USD 126.28 million in 2025 to USD 469.64 million by 2035. Hyperscale data centers are the largest buyers with 38.6%.
USD 841.14 million in the United States, or 37.3% of 2025 spending, followed by China at USD 221.00 million. India grows fastest among large country markets at 16.04% a year (DC Market Insights estimate).
Licences, delivery and payment
Which licence should I choose?
Single User is a view-only PDF for one person. Multi User adds a printable PDF and the Excel data for unlimited users at one location. Enterprise covers your whole company and includes 100 free analyst hours.
How and when will I receive the report?
By email, within 24–48 business hours of payment, in the formats of your licence.
How can I pay?
Securely through PayPal: with a PayPal account, a debit or credit card, or PayPal Pay Later where available. Prices are in US dollars.
Can I see a sample first?
Yes. Request a free sample and we will email it to you.
Can the report be tailored to my needs?
Yes. We can add countries, segments or data cuts. Talk to an analyst about the scope you need.
Can I get an invoice or pay against a purchase order?
Write to sales@dcmarketinsights.com and our team will help.