
Arm-Based Server Market Size, Share & Forecast to 2035
Market at a glance
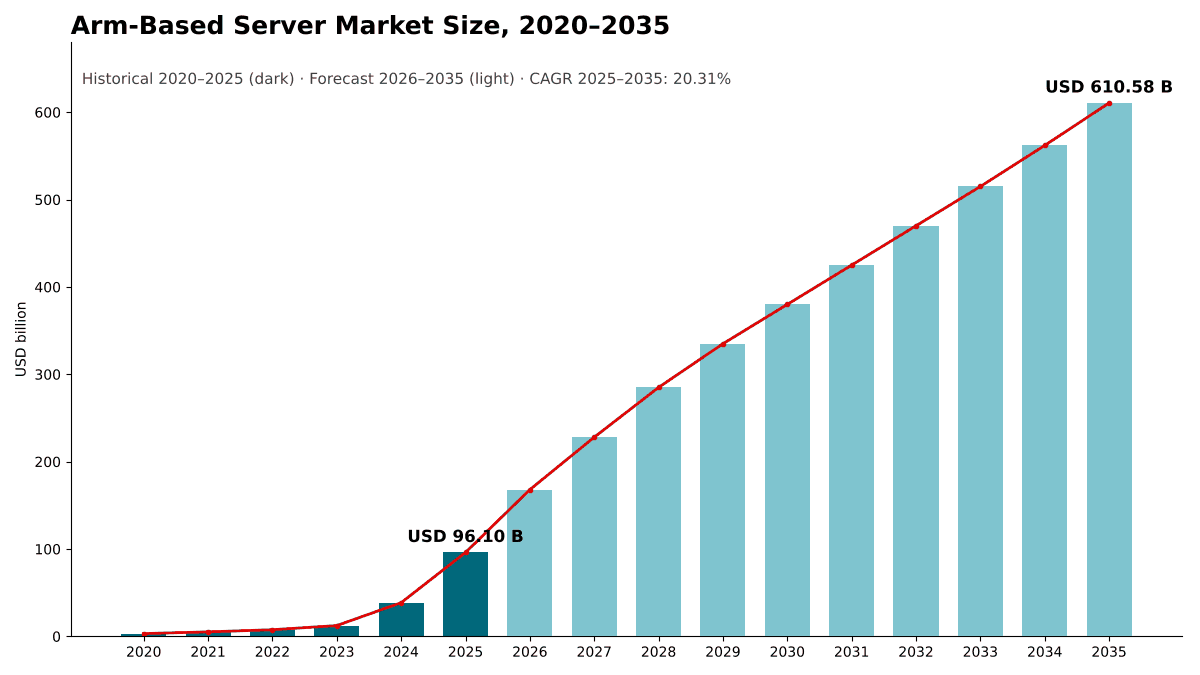
The Arm-Based Server market was worth USD 96.10 billion in 2025 and is forecast to reach USD 610.58 billion by 2035, growing at a 20.31% CAGR. North America accounts for 55.8% of the market.
 By Amit Jain, Senior Consultant, ICT & Emerging Technologies
 Reviewed by Deepti Agrawal
Last updated 10 Oct 2026
Base year 2025 PDF + Excel
Reviewed by Deepti Agrawal
Last updated 10 Oct 2026
Base year 2025 PDF + Excel
Source: DC Market Insights analysis
Key findings
Arm-Hosted AI Racks Account for USD 68.40 Billion, or 71.2% of 2025 Value
Core Counts Pass 128 per Socket
Enterprise Software Still Assumes x86
Merchant Arm CPUs Open the Market Beyond the Hyperscalers
What is inside the report
- 01Introduction
- 02Research Methodology
- 03Executive Summary
- 04Market Dynamics
- 05Pricing
- 06Standards and Regulation
- 07Supply Chain
- 08Market Size and Forecast
- 09Market by Server Type
- 10Market by Processor Source
- 22chapters
- 2020-2024Historical period
- 2026-2035Forecast period
- 13Companies profiled
Regional insights
- North America55.8%
- Asia Pacific26.4%
- Europe11.2%
- Middle East and Africa4.1%
- Latin America2.5%
Segmentation
Companies profiled
- NVIDIA
- Amazon Web Services
- Microsoft
- Arm
- Ampere Computing
- Huawei
- Alibaba Cloud
- Fujitsu
- Qualcomm
- Hewlett Packard Enterprise
- Supermicro
- Oracle
Recent developments
Microsoft launched Azure Cobalt 100-based virtual machines, claiming up to 50% better price performance than its earlier Arm-based virtual machines (Source: DatacenterDynamics news report).
SoftBank Group completed its acquisition of Ampere Computing for USD 6.5 billion (Source: Nasdaq news report).
Microsoft unveiled Azure Cobalt 200, with 132 active cores on a 3 nm process and a 50% performance increase over the previous generation, with general availability expected in 2026 (Source: DatacenterDynamics news report).
AWS launched Graviton5 with 192 cores in a single package and said Graviton powered more than half of its new CPU capacity for the third year in a row (Source: Constellation Research news analysis).
NVIDIA said its 88-core Vera CPU had entered full production, with CoreWeave planning to be the first cloud provider to offer it as a standalone product (Source: DatacenterDynamics news report).
Arm launched the Arm AGI CPU, its first data center CPU, with up to 136 Neoverse V3 cores, co-developed with Meta (Source: DatacenterDynamics news report).
Full analysis
The Arm-Based Server Market covers servers whose host central processing unit (CPU) uses the Arm instruction set, from hyperscale cloud servers built on custom Arm chips to rack-scale AI systems that pair Arm CPUs with graphics processing units (GPUs). DC Market Insights values the global Arm-Based Server Market at USD 96.10 billion in 2025 and forecasts USD 610.58 billion by 2035, a CAGR of 20.31%. The 2025 value is built from units and prices: about 21,375 rack-scale AI systems equivalent to a 72-GPU rack at roughly USD 3.20 million each give USD 68.40 billion, about 1.55 million hyperscaler custom Arm servers at USD 12,500 each add USD 19.38 billion, and about 0.64 million merchant and China domestic Arm servers at USD 13,000 each add USD 8.32 billion. Servers built on merchant Arm CPUs are the fastest-growing segment at 27.54% a year because Arm and Ampere now sell Arm server CPUs, and Fujitsu and Qualcomm are preparing new ones, for buyers that do not design their own silicon, and the Middle East and Africa is the fastest-growing region at 23.76% a year, which DC Market Insights attributes to sovereign AI programs in Saudi Arabia and the United Arab Emirates adding rack-scale systems from a small base.
Executive Summary
The Global Arm-Based Server Market size was valued at USD 3.20 billion in 2020, reached USD 96.10 billion in 2025, and is anticipated to reach USD 610.58 billion by 2035, at a CAGR of 20.31% during the forecast period.
| Report attribute | Details |
|---|---|
| Historical Period | 2020-2024 |
| Base Year | 2025 |
| Forecast Period | 2026-2035 |
| Arm-Based Server Market Size 2025 | USD 96.10 Billion |
| Arm-Based Server Market, CAGR | 20.31% |
| Arm-Based Server Market Size 2035 | USD 610.58 Billion |
The Arm-Based Server Market grew at 97.48% a year between 2020 and 2025. In the DC Market Insights model, growth came in two waves. The first, from 2020 to 2023, was general-purpose cloud compute on custom Arm chips, and the market rose from USD 3.20 billion to USD 12.38 billion. The second wave, in the DC Market Insights model, began in 2024 with rack-scale AI systems that use Arm host CPUs; the market reached USD 38.60 billion in 2024 and then grew 149.0% to USD 96.10 billion in 2025.
DC Market Insights forecasts slower but still rapid growth from 2026: 74.8% in 2026 as the newest rack-scale systems reach full volume, easing to 13.4% in 2030 and 8.6% in 2035 as Arm approaches parity with x86 in new hyperscale deployments. By 2030 the market reaches USD 380.00 billion. Arm’s own results support the early part of this path: Arm reported that its data center royalty more than doubled year over year in the fourth quarter of fiscal 2026, the quarter to March 2026 (Source: Arm shareholder letter filed with the US Securities and Exchange Commission), and again more than doubled in the quarter to June 2026.
Market Scope: What Does the Arm-Based Server Market Cover?
The Arm-Based Server Market covers every complete data center server whose host CPU implements the Arm architecture, valued at first sale (or at equivalent build cost for servers that hyperscalers design and build for their own use) in current US dollars, with 2025 as the base year and forecasts to 2035. DC Market Insights sizes it at USD 96.10 billion in 2025, about 26.3% of the USD 365.40 billion Data Center Server Market.
Included. Rack-scale AI systems in which Arm CPUs host the accelerators, such as racks built around NVIDIA Grace and Vera CPUs; general-purpose cloud servers built on hyperscaler Arm chips such as AWS Graviton, Google Axion and Microsoft Azure Cobalt; servers built on merchant Arm CPUs from Ampere, Arm, Fujitsu and others; servers built on China domestic Arm CPUs such as Huawei Kunpeng and Alibaba Yitian; and high-performance computing (HPC) and storage servers with Arm hosts. The full system value is counted, including accelerators, memory, storage, networking inside the server and the chassis.
Excluded. Servers with x86 host CPUs, even where an Arm-based data processing unit (DPU) or smart network card sits inside them; Arm chips sold on their own; edge gateways and devices outside the data center; cloud instance rental revenue; software and support; and installation labor.
How the segments fit together. Server type, processor source, core count, form factor and end-user each re-cut the same USD 96.10 billion. Core count refers to the cores in each host CPU package.
Market Drivers: What Drives the Arm-Based Server Market?
Three drivers explain most of the growth in the Arm-Based Server Market: Arm host CPUs inside rack-scale AI systems, which account for USD 68.40 billion of 2025 value; hyperscalers moving general-purpose fleets to their own Arm chips; and better performance per watt in power-limited data halls.
Arm-Hosted AI Racks Account for USD 68.40 Billion, or 71.2% of 2025 Value
The largest single driver is the rack-scale AI system. An NVIDIA GB300 NVL72 rack combines 36 Arm-based Grace CPUs with 72 Blackwell Ultra GPUs in a fully liquid-cooled, rack-scale design, with 2,592 Arm Neoverse V2 cores per rack. DC Market Insights estimates about 21,375 racks of this class, measured as 72-GPU rack equivalents, at an average of USD 3.20 million each, worth USD 68.40 billion in 2025. NVIDIA reported record fiscal 2026 Data Center revenue of USD 193.70 billion, up 68% (Source: NVIDIA results filed with the US Securities and Exchange Commission), and its chief executive, Jensen Huang, called Grace Blackwell with NVLink “the king of inference today”. DC Market Insights forecasts AI and accelerated Arm servers to grow at 20.79% a year to USD 452.30 billion by 2035.
Hyperscalers Move General-Purpose Compute to Their Own Arm Chips
Cloud providers now design their own Arm CPUs and deploy them across general-purpose fleets. AWS said Graviton has powered more than half of its new CPU capacity for the third year in a row, and that 98% of its top 1,000 EC2 customers have used Graviton. Google made its Axion-based C4A virtual machines generally available in late 2024, and Microsoft launched Azure Cobalt 100 virtual machines in October 2024. Arm reported that its share of CPU compute among top hyperscalers is now about 50%. DC Market Insights values hyperscaler custom Arm servers at USD 19.38 billion in 2025, about 1.55 million servers at USD 12,500 each, and forecasts USD 160.40 billion by 2035, a CAGR of 23.53%.
Performance per Watt Matters When Power Is the Limit
In a power-limited data hall, every watt saved on a general-purpose server can go to AI compute. Google said its C4A instances offer up to 65% better price performance and up to 60% better energy efficiency than current-generation x86 instances. Microsoft said Cobalt 100 virtual machines deliver up to 50% better price performance than its earlier Arm-based virtual machines. According to Arm, ten of the largest hyperscalers are developing and deploying Arm-based chips. DC Market Insights expects efficiency-led migration to lift general-purpose Arm servers from USD 24.90 billion in 2025 to USD 140.10 billion by 2035.
Market Trends: How Is the Arm Server Changing?
The Arm-Based Server Market is moving toward higher core counts, standalone Arm CPUs from AI accelerator vendors and Arm itself selling finished chips. Servers with more than 128 cores per CPU grow fastest by core count, at 46.53% a year.
Core Counts Pass 128 per Socket
New Arm server CPUs now exceed 128 cores. AWS Graviton5 places 192 cores in a single package, Microsoft Cobalt 200 has 132 active cores on a 3 nm process, the Arm AGI CPU offers up to 136 Neoverse V3 cores, and Fujitsu’s Monaka has 144 cores, with a compute chiplet built on a 2 nm process. DC Market Insights forecasts servers with more than 128 cores per CPU to grow from USD 7.60 billion (7.9%) in 2025 to USD 346.78 billion (56.8%) in 2035, overtaking the 65-to-128-core class that holds 85.7% of value today.
AI Accelerator Vendors Sell Arm CPUs on Their Own
Arm host CPUs designed for AI racks are now sold for general compute too. NVIDIA’s Vera CPU, with 88 custom Olympus cores, entered full production in March 2026, and CoreWeave plans to be the first cloud provider to offer Vera as a standalone product.
Arm Moves from Licensor to Chip Supplier
In March 2026, Arm launched the Arm AGI CPU, its first data center CPU, co-developed with Meta, with Cerebras, Cloudflare, F5, OpenAI, Positron, Rebellions, SAP and SK Telecom named as launch partners. Arm later said demand for the AGI CPU exceeds USD 2 billion, including customers in the US and China. Merchant Arm CPUs are worth USD 4.62 billion of server value in 2025, and DC Market Insights forecasts USD 52.60 billion by 2035.
Market Challenges: What Holds the Arm-Based Server Market Back?
Software migration cost and dependence on a few very large buyers are the two constraints that DC Market Insights expects to slow the Arm-Based Server Market, which draws 60.6% of 2025 value from hyperscale cloud providers.
Enterprise Software Still Assumes x86
DC Market Insights sees software certification as the main barrier outside the cloud: enterprise applications must be ported, tested and supported on Arm before buyers switch. Enterprises account for just USD 9.40 billion (9.8%) of 2025 Arm server value, against USD 78.20 billion of enterprise spending on all server types in the DC Market Insights server model. Firmware standards help: Arm SystemReady defines a minimum hardware base for operating systems to boot, with bands for servers that use standard firmware interfaces. DC Market Insights forecasts enterprise Arm server spending to grow fastest among end-users, at 25.66% a year, as more software vendors certify Arm builds.
Demand Depends on a Few Buyers
Hyperscale cloud providers and GPU and neocloud providers together account for 78.9% of 2025 value. A pause in AI spending by a handful of buyers would cut rack orders quickly.
Market Opportunities: Where Are the New Revenue Pools?
The two largest new revenue pools in the Arm-Based Server Market are merchant Arm CPUs sold to buyers without their own chip teams, growing at 27.54% a year, and sovereign and government AI programs, growing at 21.60% a year.
Merchant Arm CPUs Open the Market Beyond the Hyperscalers
Buyers outside the largest cloud providers need Arm CPUs they can buy rather than design. SoftBank completed its USD 6.5 billion purchase of Ampere Computing in November 2025. Oracle Cloud Infrastructure made its AmpereOne M-based A4 instances generally available in December 2025 at USD 0.0138 per OCPU-hour, with up to 35% better per-core performance, depending on the workload, for customers migrating from A2-based virtual machines. Qualcomm said it is developing a general-purpose data center CPU focused on hyperscalers, built on innovations from its Arm-based Oryon CPUs, and expects revenue to begin in fiscal 2028 if its advanced discussions with a leading hyperscaler succeed. Fujitsu plans production shipments of Monaka in 2027.
Government and Research Buyers Add USD 43.10 Billion by 2035
Government and research buyers, including national laboratories, sovereign AI programs and university HPC centers, spend USD 7.10 billion on Arm servers in 2025. DC Market Insights forecasts USD 50.20 billion by 2035, a gain of USD 43.10 billion, as national AI programs buy rack-scale systems and HPC centers adopt Arm CPUs with high-bandwidth memory. Policy makers and investors can follow the wider context in the Data Center Chip Market report.
Pricing: How Much Does an Arm-Based Server Cost?
A general-purpose Arm server built on a hyperscaler custom chip costs about USD 12,500 in 2025, a merchant or China domestic Arm server about USD 13,000, and a rack-scale AI system about USD 3.20 million per 72-GPU rack equivalent. These are DC Market Insights estimates of system value at first sale or equivalent build cost.
| 2025 build input | Units | Average value per unit (USD) | Value (USD billion) |
|---|---|---|---|
| Rack-scale AI systems (72-GPU rack equivalents) | 21,375 racks | 3,200,000 | 68.40 |
| Hyperscaler custom Arm servers | 1.55 million | 12,500 | 19.38 |
| Merchant and China domestic Arm servers | 0.64 million | 13,000 | 8.32 |
| Total | 96.10 |
Rack-scale AI systems carry most of their value in the accelerators, so their price follows GPU generations rather than the CPU. In the cloud, Oracle lists its A4 instances at USD 0.0138 per OCPU-hour, with one OCPU equal to two AmpereOne M cores.
Standards and Regulation: Which Rules Shape Arm Servers?
Two sets of rules shape the Arm-Based Server Market: the Arm SystemReady compliance program, which defines a minimum hardware base for operating systems to boot on Arm servers, and efficiency rules for servers such as the European Union ecodesign regulation.
Arm SystemReady. SystemReady builds on the Base System Architecture (BSA), which sets a minimum set of hardware requirements for an operating system to boot, and on the Server Base System Architecture (SBSA) supplement. The SystemReady SR band, successor to the earlier ServerReady program, covers servers whose firmware supports the Unified Extensible Firmware Interface (UEFI) and the Advanced Configuration and Power Interface (ACPI); the LS band targets hyperscalers that use LinuxBoot firmware.
EU ecodesign for servers. Commission Regulation (EU) 2019/424 lays down ecodesign requirements for servers and data storage products in the European Union. Such rules reward more work per watt.
Market Segmentation: Which Segment Leads the Arm-Based Server Market?
AI and accelerated servers lead the Arm-Based Server Market with 71.2% of 2025 value, accelerator-vendor Arm CPUs lead by processor source with 69.6%, and hyperscale cloud providers lead buyers with 60.6%. Servers built on merchant Arm CPUs are the fastest-growing segment at 27.54% a year, because Arm and Ampere now sell Arm server CPUs to buyers that do not design their own chips, and Fujitsu and Qualcomm are preparing new ones.
By Server Type: AI and Accelerated Servers Lead with 71.2%
| Server type | 2025 (USD billion) | Share 2025 | 2035 (USD billion) | CAGR 2025-2035 |
|---|---|---|---|---|
| AI and Accelerated Servers | 68.40 | 71.2% | 452.30 | 20.79% |
| General-Purpose Servers | 24.90 | 25.9% | 140.10 | 18.86% |
| HPC and Storage Servers | 2.80 | 2.9% | 18.18 | 20.57% |
AI and accelerated servers hold more than seven tenths of value because each rack-scale system costs as much as several hundred general-purpose servers.
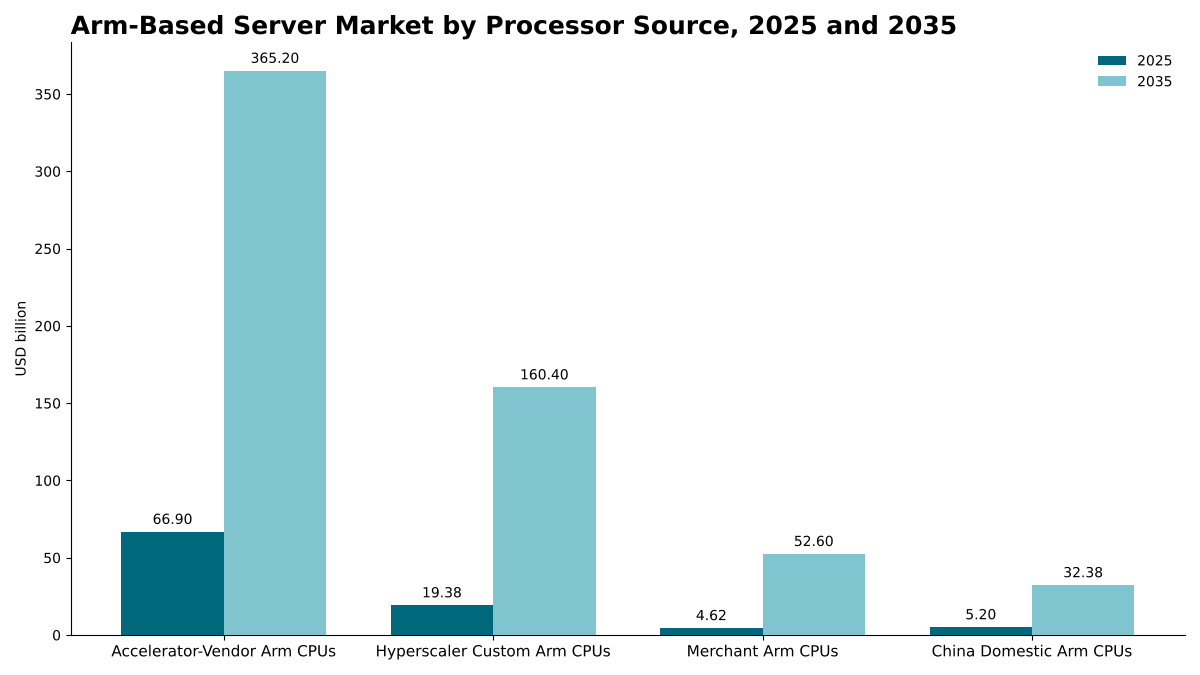
By Processor Source: Accelerator-Vendor Arm CPUs Lead with 69.6%
| Processor source | 2025 (USD billion) | Share 2025 | 2035 (USD billion) | CAGR 2025-2035 |
|---|---|---|---|---|
| Accelerator-Vendor Arm CPUs | 66.90 | 69.6% | 365.20 | 18.50% |
| Hyperscaler Custom Arm CPUs | 19.38 | 20.2% | 160.40 | 23.53% |
| Merchant Arm CPUs | 4.62 | 4.8% | 52.60 | 27.54% |
| China Domestic Arm CPUs | 5.20 | 5.4% | 32.38 | 20.07% |
Accelerator-vendor Arm CPUs, mainly NVIDIA Grace and Vera, host most AI racks; hyperscaler custom Arm CPUs grow at 23.53% a year.
By Core Count: Servers with 65 to 128 Cores Lead with 85.7%
| Core count | 2025 (USD billion) | Share 2025 | 2035 (USD billion) | CAGR 2025-2035 |
|---|---|---|---|---|
| Up to 64 Cores | 6.10 | 6.3% | 15.30 | 9.63% |
| 65 to 128 Cores | 82.40 | 85.7% | 248.50 | 11.67% |
| Above 128 Cores | 7.60 | 7.9% | 346.78 | 46.53% |
Grace, with 72 cores per CPU, places most 2025 value in the 65-to-128-core class.
By Form Factor: Rack-Scale Integrated Systems Lead with 67.4%
| Form factor | 2025 (USD billion) | Share 2025 | 2035 (USD billion) | CAGR 2025-2035 |
|---|---|---|---|---|
| Rack-Scale Integrated Systems | 64.80 | 67.4% | 402.30 | 20.03% |
| Standard Rack Servers | 26.40 | 27.5% | 172.50 | 20.65% |
| Multi-Node and Blade Servers | 4.90 | 5.1% | 35.78 | 22.00% |
Multi-node and blade servers grow fastest by form factor at 22.00% a year.
By End-user: Hyperscale Cloud Providers Lead with 60.6%
| End-user | 2025 (USD billion) | Share 2025 | 2035 (USD billion) | CAGR 2025-2035 |
|---|---|---|---|---|
| Hyperscale Cloud Providers | 58.20 | 60.6% | 342.10 | 19.38% |
| GPU and Neocloud Providers | 17.60 | 18.3% | 96.50 | 18.55% |
| Enterprises | 9.40 | 9.8% | 92.30 | 25.66% |
| Government and Research | 7.10 | 7.4% | 50.20 | 21.60% |
| Telecom and Other Service Providers | 3.80 | 4.0% | 29.48 | 22.74% |
Enterprises grow fastest among buyers at 25.66% a year from a small base as software support widens.
DC Exclusive: The Arm Server Processor Source × Buyer Matrix
At USD 33.15 billion in 2025, hyperscale purchases of servers built on accelerator-vendor Arm CPUs form the single largest cell of the matrix and 34.5% of the Arm-Based Server Market. The matrix shows whose Arm CPU is inside the server and who buys it.
| 2025, USD billion | Accelerator-Vendor Arm CPUs | Hyperscaler Custom Arm CPUs | Merchant Arm CPUs | China Domestic Arm CPUs | Total |
|---|---|---|---|---|---|
| Hyperscale Cloud Providers | 33.15 | 19.38 | 1.45 | 4.22 | 58.20 |
| GPU and Neocloud Providers | 16.90 | 0.00 | 0.70 | 0.00 | 17.60 |
| Enterprises | 7.40 | 0.00 | 1.45 | 0.55 | 9.40 |
| Government and Research | 6.30 | 0.00 | 0.50 | 0.30 | 7.10 |
| Telecom and Other Service Providers | 3.15 | 0.00 | 0.52 | 0.13 | 3.80 |
| Total | 66.90 | 19.38 | 4.62 | 5.20 | 96.10 |
Hyperscalers spend 33.3% of their Arm server budget on servers built on their own chips, while every other buyer group relies on accelerator-vendor or merchant Arm CPUs. GPU and neocloud providers spend 96.0% of their Arm server budget on accelerator-vendor platforms, which ties their spending to one supplier’s product cycle. Enterprises spend 15.4% on merchant Arm CPUs, the highest merchant share of any buyer.
The matrix is a DC Market Insights model, built from 44 inputs: 16 annual market totals (2020 to 2035), 3 unit-and-price build blocks for 2025, 4 processor-source splits, 5 end-user splits, 3 core-count splits, 3 form-factor splits, 5 regional splits and 5 public disclosures used as bound checks. The model and its assumptions are explained on our research methodology page.
Regional Insights: Which Region Leads the Arm-Based Server Market?
North America leads the Arm-Based Server Market with 55.8% of 2025 value, and the Middle East and Africa is the fastest-growing region at 23.76% a year, which DC Market Insights attributes to sovereign AI programs in Saudi Arabia and the United Arab Emirates adding rack-scale systems from a small base.
North America Leads with 55.8% Share
North American buyers spent USD 53.62 billion on Arm servers in 2025, and the region is forecast to reach USD 318.40 billion in 2035, a CAGR of 19.50%. DC Market Insights attributes most of the region’s value to hyperscale cloud and GPU cloud buyers.
Asia Pacific Holds 26.4% Share
Asia Pacific is worth USD 25.37 billion in 2025 and USD 172.30 billion by 2035, a CAGR of 21.11%. China is the largest Asia Pacific market, where, in the DC Market Insights model, Huawei Kunpeng and Alibaba Yitian CPUs carry most Arm server demand; Japan, India, South Korea, Australia and Singapore add most of the rest.
Europe Holds 11.2% Share
Europe is worth USD 10.76 billion in 2025 and USD 70.90 billion by 2035, a CAGR of 20.75%. Ecodesign rules favor efficient general-purpose servers, and Germany, the United Kingdom and France are the largest European country markets in the DC Market Insights allocation.
Middle East and Africa Holds 4.1% Share and Grows Fastest
The Middle East and Africa is worth USD 3.94 billion in 2025 and USD 33.20 billion by 2035, a CAGR of 23.76%. Saudi Arabia and the United Arab Emirates account for more than half of regional value, in the DC Market Insights allocation, driven by sovereign AI programs.
Latin America Holds 2.5% Share
Latin America is worth USD 2.41 billion in 2025 and USD 15.78 billion by 2035, a CAGR of 20.67%, led by Brazil with 45% of regional value in the DC Market Insights allocation.
Country Analysis: Which Countries Buy the Most Arm-Based Servers?
The United States is the largest country market for Arm-based servers at USD 48.53 billion in 2025, 50.5% of global value, followed by China at USD 11.92 billion (12.4%) and Canada at USD 3.75 billion (3.9%). The 12 largest countries account for 85.0% of 2025 spending.
| Rank | Country | Region | 2025 (USD billion) | Share 2025 | 2035 (USD billion) | CAGR 2025-2035 |
|---|---|---|---|---|---|---|
| 1 | United States | North America | 48.53 | 50.5% | 283.38 | 19.30% |
| 2 | China | Asia Pacific | 11.92 | 12.4% | 72.37 | 19.76% |
| 3 | Canada | North America | 3.75 | 3.9% | 24.84 | 20.80% |
| 4 | Japan | Asia Pacific | 3.55 | 3.7% | 22.40 | 20.22% |
| 5 | Germany | Europe | 2.37 | 2.5% | 15.95 | 21.02% |
| 6 | United Kingdom | Europe | 2.21 | 2.3% | 14.18 | 20.45% |
| 7 | India | Asia Pacific | 2.03 | 2.1% | 20.68 | 26.13% |
| 8 | South Korea | Asia Pacific | 1.90 | 2.0% | 13.78 | 21.90% |
| 9 | France | Europe | 1.61 | 1.7% | 10.99 | 21.15% |
| 10 | Australia | Asia Pacific | 1.52 | 1.6% | 10.68 | 21.51% |
| 11 | Saudi Arabia | Middle East and Africa | 1.14 | 1.2% | 10.62 | 24.98% |
| 12 | Singapore | Asia Pacific | 1.14 | 1.2% | 8.79 | 22.64% |
India is the fastest-growing country market at 26.13% a year, ahead of Saudi Arabia at 24.98%, in the DC Market Insights allocation, as both add Arm capacity from a small base. The country figures are a DC Market Insights allocation of the regional totals, weighted by each country’s estimated share of hyperscale cloud capacity and AI system deployments.
Forecast Scenarios: How Could the 2035 Forecast Change?
The Arm-Based Server Market reaches USD 610.58 billion by 2035 in the base case, with a range of USD 455.20 billion to USD 742.30 billion across the low and high scenarios.
| Scenario | Assumption from 2026 | 2035 (USD billion) | CAGR 2025-2035 |
|---|---|---|---|
| Low | AI rack volumes 20% below base; Arm share of new general-purpose hyperscale servers stalls near today’s level | 455.20 | 16.83% |
| Base | Rack-scale AI keeps Arm hosts; Arm reaches parity with x86 in new hyperscale general-purpose deployments | 610.58 | 20.31% |
| High | Merchant Arm CPUs win enterprise and colocation buyers; AI rack volumes 15% above base | 742.30 | 22.68% |
The main swing factor is the host CPU choice in future AI racks: a move by accelerator vendors to x86 hosts would cut the forecast more than any change in general-purpose demand.
Competitive Insights: Who Leads the Arm-Based Server Market?
- NVIDIA
- Amazon Web Services
- Microsoft
- Arm
- Ampere Computing
- Huawei
- Alibaba Cloud
- Fujitsu
- Qualcomm
- Hewlett Packard Enterprise
- Supermicro
- Oracle
NVIDIA leads the Arm-Based Server Market through its Grace and Vera platforms, which host 69.6% of 2025 Arm server value (DC Market Insights estimate, measured by the source of the host CPU, not by who assembles the server). Accelerator-vendor and hyperscaler custom Arm CPUs together host 89.8% of value. Hewlett Packard Enterprise and Supermicro each sell a GB300 NVL72 rack with 36 Grace CPUs. AWS, Google and Microsoft design their own Arm CPUs: Graviton5, Axion and Cobalt 200. Arm became a chip supplier with the AGI CPU in 2026, while Ampere, now owned by SoftBank, supplies the Arm CPUs used in Oracle Cloud Infrastructure A4 instances. In China, Huawei’s Kunpeng and Alibaba’s Yitian 710, a 128-core Armv9-compatible CPU, serve domestic buyers. Fujitsu plans production shipments of its Arm-based Monaka in 2027, and Qualcomm is developing a data center CPU built on innovations from its Arm-based Oryon CPUs.
Recent Developments
- In October 2024, Microsoft launched Azure Cobalt 100-based virtual machines, claiming up to 50% better price performance than its earlier Arm-based virtual machines (Source: DatacenterDynamics news report).
- In November 2025, SoftBank Group completed its acquisition of Ampere Computing for USD 6.5 billion (Source: Nasdaq news report).
- In November 2025, Microsoft unveiled Azure Cobalt 200, with 132 active cores on a 3 nm process and a 50% performance increase over the previous generation, with general availability expected in 2026 (Source: DatacenterDynamics news report).
- In December 2025, AWS launched Graviton5 with 192 cores in a single package and said Graviton powered more than half of its new CPU capacity for the third year in a row (Source: Constellation Research news analysis).
- In March 2026, NVIDIA said its 88-core Vera CPU had entered full production, with CoreWeave planning to be the first cloud provider to offer it as a standalone product (Source: DatacenterDynamics news report).
- In March 2026, Arm launched the Arm AGI CPU, its first data center CPU, with up to 136 Neoverse V3 cores, co-developed with Meta (Source: DatacenterDynamics news report).
We follow these launches, deals and capacity announcements as they happen in our data center industry updates.
Methodology: How We Built the Arm-Based Server Market Model
DC Market Insights built this market bottom-up from units and prices, using the three 2025 build blocks shown in the pricing section. Annual totals for 2020 to 2035 were set from the installed and announced Arm CPU generations and the AI rack ramp. Unit counts and prices are DC Market Insights assumptions, not disclosed figures, because no supplier reports Arm server sales on their own. The model therefore uses bound checks rather than a single top-down match: (a) a ceiling from the DC Market Insights Data Center Server Market of USD 365.40 billion in 2025, of which the Arm-Based Server Market is 26.3%; (b) a ceiling from NVIDIA’s fiscal 2026 Data Center revenue of USD 193.70 billion, of which the Arm-hosted AI rack value of USD 68.40 billion is 35.3% at full system value; (c) Arm’s report that its data center royalty more than doubled year over year in the quarter to March 2026 and again in the quarter to June 2026, consistent with growth of 149.0% in 2025 and 74.8% in 2026; and (d) Arm’s statement that it holds about half of CPU compute among top hyperscalers. The total was split by 3 server types, 4 processor sources, 3 core-count classes, 3 form factors, 5 end-users and 5 regions, and every split sums to the market total. Country values allocate each regional total by country weights. The analyst named on this page built the model, and the reviewer checked the arithmetic, the sources and the dates before publication.
Table of contents
- 01Introduction
- 1.1Market Definition and Scope
- 1.2Research Objectives
- 1.3Currency, Units and Years Considered
- 02Research Methodology
- 2.1Bottom-Up Units × Price Model
- 2.2Bound Checks and Sources
- 2.3Assumptions and Limitations
- 03Executive Summary
- 3.1Key Findings
- 3.2Market Snapshot, 2025 and 2035
- 04Market Dynamics
- 4.1Drivers
- 4.2Trends
- 4.3Challenges
- 4.4Opportunities
- 05Pricing
- 5.1Arm Server Value per Unit, 2025
- 5.2Rack-Scale AI System Value
- 5.3Cloud Instance Pricing
- 06Standards and Regulation
- 6.1Arm SystemReady, BSA and SBSA
- 6.2EU Ecodesign Regulation for Servers
- 07Supply Chain
- 7.1Arm Architecture Licensing
- 7.2CPU Design and Foundry
- 7.3Server Assembly and Integration
- 7.4Buyers and Deployment
- 08Market Size and Forecast
- 8.1Market Size, 2020-2035
- 8.2Year-on-Year Growth, 2021-2035
- 09Market by Server Type
- 9.1AI and Accelerated Servers
- 9.2General-Purpose Servers
- 9.3HPC and Storage Servers
- 10Market by Processor Source
- 10.1Accelerator-Vendor Arm CPUs
- 10.2Hyperscaler Custom Arm CPUs
- 10.3Merchant Arm CPUs
- 10.4China Domestic Arm CPUs
- 11Market by Core Count
- 11.1Up to 64 Cores
- 11.265 to 128 Cores
- 11.3Above 128 Cores
- 12Market by Form Factor
- 12.1Rack-Scale Integrated Systems
- 12.2Standard Rack Servers
- 12.3Multi-Node and Blade Servers
- 13Market by End-user
- 13.1Hyperscale Cloud Providers
- 13.2GPU and Neocloud Providers
- 13.3Enterprises
- 13.4Government and Research
- 13.5Telecom and Other Service Providers
- 14DC Exclusive: Processor Source × Buyer Matrix
- 14.1Matrix, 2025
- 14.2Model Inputs
- 15Market by Region
- 15.1North America (United States, Canada)
- 15.2Asia Pacific (China, Japan, India, South Korea, Australia, Singapore)
- 15.3Europe (Germany, United Kingdom, France)
- 15.4Middle East and Africa (Saudi Arabia, United Arab Emirates)
- 15.5Latin America (Brazil)
- 16Country Analysis
- 16.1Top 12 Countries, 2025 and 2035
- 16.2Fastest-Growing Countries
- 17Regional Cross-Sections
- 17.1Regional Share, 2025 and 2035
- 17.2Regional CAGR, 2025-2035
- 18Forecast Scenarios
- 18.1Low Scenario
- 18.2Base Scenario
- 18.3High Scenario
- 19Competitive Landscape
- 19.1Market Leadership by CPU Source
- 19.2Server Makers and Integrators
- 20Company Profiles
- 20.1NVIDIA
- 20.2Amazon Web Services
- 20.3Microsoft
- 20.4Google
- 20.5Arm
- 20.6Ampere Computing
- 20.7Huawei
- 20.8Alibaba Cloud
- 20.9Fujitsu
- 20.10Qualcomm
- 20.11Hewlett Packard Enterprise
- 20.12Supermicro
- 20.13Oracle
- 21Recent Developments
- 21.1Launches, 2024-2026
- 21.2Acquisitions
- 22Analyst Recommendations
- 22.1For Server Buyers
- 22.2For CPU and Server Suppliers
- 22.3For Investors
- Fig. 1Arm-Based Server Market Size, 2020-2035
- Fig. 2Arm-Based Server Market by Processor Source, 2025 and 2035
- Fig. 3Arm-Based Server Market by Server Type, 2025 and 2035
- Fig. 4Arm-Based Server Market by Region, 2025 and 2035
- Fig. 5Processor Source × End-user Matrix, 2025
- Table 1Report Attributes
- Table 2Arm Server Value per Unit, 2025
- Table 3Market by Server Type, 2025 and 2035
- Table 4Market by Processor Source, 2025 and 2035
- Table 5Market by Core Count, 2025 and 2035
- Table 6Market by Form Factor, 2025 and 2035
- Table 7Market by End-user, 2025 and 2035
- Table 8Processor Source × End-user Matrix, 2025
- Table 9Market by Region, 2025 and 2035
- Table 10Top 12 Countries, 2025 and 2035
- Table 11Forecast Scenarios, 2035
About this report
Written by Amit Jain and reviewed by Deepti Agrawal, Senior Editor, Research. Figures are built top-down and bottom-up and reconciled before publication, with 2025 as the base year.
Read our methodologyHow we built this
- Historical period2020-2024
- Base year2025
- Forecast period2026-2035
- Sizing approachTop-down + bottom-up
Need more than the report?
Advisory on this market
Due diligence, site selection and market entry work, by the analysts who wrote this report.
See consulting servicesFrequently asked questions
USD 96.10 billion in 2025, rising to USD 610.58 billion by 2035. DC Market Insights estimates the market at USD 3.20 billion in 2020.
20.31% a year from 2025 to 2035. Growth was faster, at 97.48% a year, between 2020 and 2025, as hyperscalers adopted custom Arm chips and Arm-hosted AI racks scaled up (DC Market Insights estimate).
AI and accelerated servers, with USD 68.40 billion or 71.2% of 2025 value, growing at 20.79% a year to USD 452.30 billion by 2035.
Servers built on merchant Arm CPUs grow fastest at 27.54% a year, from USD 4.62 billion in 2025 to USD 52.60 billion by 2035, as Arm and Ampere sell CPUs to buyers without their own chip teams.
About USD 12,500 for a hyperscaler custom Arm server and USD 13,000 for a merchant or China domestic Arm server in 2025, and about USD 3.20 million per 72-GPU rack-scale AI system (DC Market Insights estimates).
North America, with USD 53.62 billion or 55.8% of 2025 value. The Middle East and Africa grows fastest at 23.76% a year.
NVIDIA’s Grace and Vera platforms host 69.6% of 2025 Arm server value (DC Market Insights estimate). AWS, Microsoft, Google, Arm, Ampere Computing, Huawei, Alibaba Cloud, Fujitsu, Qualcomm, Hewlett Packard Enterprise, Supermicro and Oracle also compete or are preparing new Arm CPUs.
USD 48.53 billion in the United States, or 50.5% of 2025 spending, followed by China at USD 11.92 billion. India grows fastest at 26.13% a year (DC Market Insights estimate).
Licences, delivery and payment
Which licence should I choose?
Single User is a view-only PDF for one person. Multi User adds a printable PDF and the Excel data for unlimited users at one location. Enterprise covers your whole company and includes 100 free analyst hours.
How and when will I receive the report?
By email, within 24–48 business hours of payment, in the formats of your licence.
How can I pay?
Securely through PayPal: with a PayPal account, a debit or credit card, or PayPal Pay Later where available. Prices are in US dollars.
Can I see a sample first?
Yes. Request a free sample and we will email it to you.
Can the report be tailored to my needs?
Yes. We can add countries, segments or data cuts. Talk to an analyst about the scope you need.
Can I get an invoice or pay against a purchase order?
Write to sales@dcmarketinsights.com and our team will help.