
Data Center Fire Detection and Suppression Market Size, Share & Forecast to 2035
Market at a glance
The Data Center Fire Detection and Suppression market was worth USD 4,470.0 million in 2025 and is forecast to reach USD 10.35 billion by 2035, growing at a 8.75% CAGR. North America accounts for 40% of the market.
 By Amit Jain, Senior Consultant, ICT & Emerging Technologies
 Reviewed by Deepti Agrawal
Last updated 12 Oct 2026
Base year 2025 PDF + Excel
Reviewed by Deepti Agrawal
Last updated 12 Oct 2026
Base year 2025 PDF + Excel
Source: DC Market Insights analysis
Key findings
New Capacity of 12.0 GW a Year Adds USD 2.95 billion of New-Build Spend
Water Mist and Hybrid Systems Grow to USD 1.14 billion by 2035
PFAS and HFC Rules Squeeze Clean Agent Supply
Inspection, Testing and Maintenance Grows to USD 2.66 billion by 2035
What is inside the report
- 01Introduction
- 02Executive Summary
- 03Why Market Estimates Differ
- 04Market Dynamics: Drivers
- 05Market Trends
- 06Market Challenges
- 07Market Opportunities
- 08Pricing Analysis
- 09Standards and Regulation
- 10Market Segmentation by System Type
- 23chapters
- 2020-2024Historical period
- 2026-2035Forecast period
- 12Companies profiled
Regional insights
- North America40%
- Asia Pacific28%
- Europe23.5%
- Middle East and Africa4.3%
- Latin America4.2%
Segmentation
Companies profiled
- Johnson Controls
- Honeywell
- Siemens Smart Infrastructure
- Minimax Viking Group
- Halma
- Hochiki
- Fike
- Victaulic
- Wagner Group
- Securiton
- Firetrace International
- APi Group
Recent developments
Johnson Controls launched the Simplex Incident Manager and Autocall Fire Site Administrator workstations, aimed at data centers and other large sites, each able to monitor up to 250,000 devices (Source: Johnson Controls).
FM revised Data Sheet 5-32 for data centers, advising against clean agent systems for rack lithium-ion battery units above 20 kWh (Source: FM).
Siemens introduced its ASD+ aspirating smoke detection solution to the United States at the NFPA conference (Source: Siemens).
the US EPA published its fire suppression fact sheet confirming that recycled HFCs are required for servicing from 1 January 2026 (Source: EPA).
APi Group agreed to acquire CertaSite, a fire and life safety inspection provider with about USD 90 million of 2025 revenue (Source: APi Group).
the Uptime Institute published its analysis of the September 2025 NIRS fire in Daejeon, which began with a lithium-ion battery thermal event (Source: Uptime Institute).
Full analysis
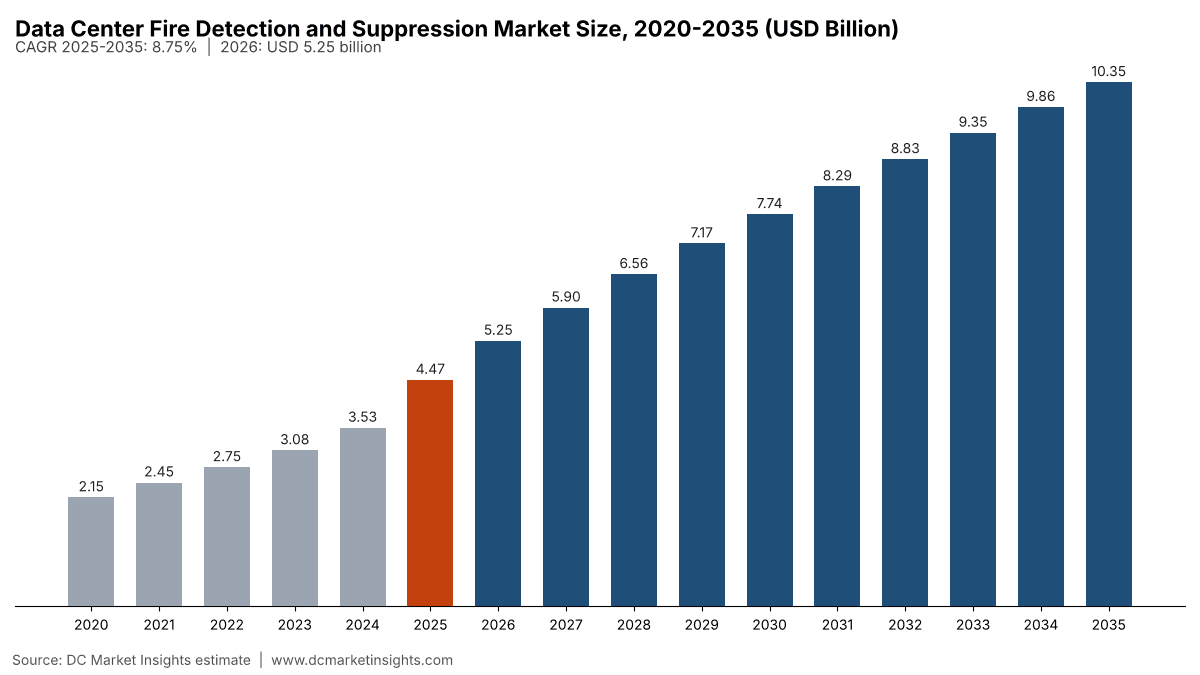
The Data Center Fire Detection and Suppression Market is valued at USD 5.25 billion in 2026 and is projected to reach USD 10.35 billion by 2035, up from USD 4.47 billion in 2025, a CAGR of 8.75% from 2025 to 2035 (DC Market Insights estimate). The market covers the fire detection and alarm systems, aspirating smoke detection, pre-action and wet-pipe sprinklers, gaseous clean agent and inert gas suppression, water mist and lithium-ion battery off-gas detection installed in a data center, together with the inspection, testing and maintenance (ITM) that keeps those systems certified. The build receipt: about 7.8 GW of new conventional information technology (IT) capacity at roughly USD 265,000 of fire protection content per MW and 4.2 GW of new artificial intelligence (AI) capacity at about USD 210,000 per MW give USD 2.95 billion of new-build spend in 2025, and replacement plus ITM contracts on an installed base of about 116 GW add USD 1.52 billion. Lithium-ion battery off-gas detection and protection is the fastest-growing system at 12.70% a year because battery-room fires caused major data center outages in South Korea in 2022 and 2025, and the Middle East and Africa is the fastest-growing region at 12.98% a year as gigawatt-scale AI campuses in Saudi Arabia and the United Arab Emirates (UAE) start from a small base.
Key Market Statistics: How Big Is the Data Center Fire Detection and Suppression Market in 2026?
DC Market Insights values the Data Center Fire Detection and Suppression Market at USD 5.25 billion in 2026, 17.2% above the USD 4.47 billion of 2025.
- Market size 2025: USD 4.47 billion
- Market size 2026: USD 5.25 billion
- Market size 2030: USD 7.74 billion
- Market size 2035: USD 10.35 billion
- CAGR 2025-2035: 8.75% in the base case, 6.37% in the low case and 10.46% in the high case
- Largest system type: fire detection and alarm systems, 34.0% of 2025 value (USD 1.52 billion)
- Fastest-growing system type: lithium-ion battery off-gas detection and protection, 12.70% a year
- Leading region: North America, 40.0% of 2025 value (USD 1.79 billion)
- Fastest-growing region: Middle East and Africa, 12.98% a year
- Largest country: the United States, USD 1.57 billion in 2025 (35.2% of global value)
- Market leader: Johnson Controls, followed by Honeywell and Siemens Smart Infrastructure (DC Market Insights assessment)
Executive Summary
The Global Data Center Fire Detection and Suppression Market size was valued at USD 2.15 billion in 2020, reached USD 4.47 billion in 2025, and is anticipated to reach USD 10.35 billion by 2035, at a CAGR of 8.75% during the forecast period.
| Report attribute | Details |
|---|---|
| Historical Period | 2020-2024 |
| Base Year | 2025 |
| Forecast Period | 2026-2035 |
| Data Center Fire Detection and Suppression Market Size 2025 | USD 4.47 Billion |
| Data Center Fire Detection and Suppression Market Size 2026 | USD 5.25 Billion |
| Data Center Fire Detection and Suppression Market, CAGR | 8.75% |
| Data Center Fire Detection and Suppression Market Size 2035 | USD 10.35 Billion |
The market grew at 15.74% a year between 2020 and 2025, and 2025 alone added 26.8% over the USD 3.53 billion of 2024 as annual completions jumped from 8.8 GW to 12.0 GW. Growth eases to 8.75% a year from 2025 to 2035 because dense AI halls need less protected floor area and room volume per MW: content per new AI MW falls from about USD 210,000 in 2025 to about USD 185,000 in 2035, against USD 265,000 to USD 290,000 per MW in a conventional hall. The installed base keeps the market growing all the same. It rises from about 116 GW in 2025 to about 313 GW in 2035, and replacement plus ITM rise from 34.1% of the market in 2025 to 42.4% in 2035.
Market Scope: What Does the Data Center Fire Detection and Suppression Market Cover?
The Data Center Fire Detection and Suppression Market covers every system that detects, alarms and suppresses fire inside a data center building, valued at installed price plus service in current US dollars; DC Market Insights sizes it at USD 4.47 billion in 2025 and USD 5.25 billion in 2026.
Included. Fire alarm control panels, spot smoke and heat detectors, very early warning aspirating smoke detection (ASD), linear heat cable and notification devices; pre-action (single- and double-interlock) and wet-pipe sprinkler systems in data halls, electrical rooms and support spaces; gaseous suppression with clean agents such as HFC-227ea and FK-5-1-12 and with inert gases such as IG-541 and IG-55; water mist and hybrid water-and-nitrogen systems; lithium-ion battery off-gas detection and battery-room protection; and the inspection, testing, maintenance, agent recharge and system upgrades bought for all of these.
Excluded. Fire-rated walls, doors and passive fire stopping, which sit in construction budgets; fire pumps and water storage counted in site civil works; portable extinguishers; fire brigade and insurance costs; video surveillance and physical security, covered in the Data Center Access Control Market; and battery and uninterruptible power supply (UPS) hardware itself.
How the segments fit together. The same USD 4.47 billion of 2025 is cut three ways: by system type (detection, sprinklers, clean agent, water mist, lithium-ion protection), by offering (new-build, replacement and upgrade, ITM services) and by data center type (hyperscale, colocation, enterprise, edge). Each cut sums to the total in every year.
Why Do Data Center Fire Detection and Suppression Market Estimates Differ?
DC Market Insights puts the Data Center Fire Detection and Suppression Market at USD 5.25 billion in 2026; public estimates for markets with a similar name vary by more than a factor of two because they draw the boundary in different places.
Broader definitions add fire-rated construction and passive fire protection, fire pumps and water tanks, portable extinguishers, physical security and video surveillance, or the whole building fire safety spend of a mixed-use campus. Some also count suppression for telecom shelters and industrial control rooms, which are not data centers. Narrower definitions count only gaseous suppression hardware and leave out detection, sprinklers and the service stream, which DC Market Insights values at USD 812.00 million in 2025. DC Market Insights keeps passive fire protection, fire pumps, extinguishers and physical security out of scope, and counts the ITM service stream in full because building codes require it every year.
| Element | In this report | Why |
|---|---|---|
| Detection, alarm and aspirating smoke detection | Yes, USD 1.52 billion in 2025 | Installed in every data hall and electrical room |
| Sprinklers (pre-action and wet pipe) | Yes, USD 1.21 billion in 2025 | Required by NFPA 75 and insurer data sheets |
| Clean agent and inert gas suppression | Yes, USD 1.07 billion in 2025 | Protects IT rooms without water damage |
| Inspection, testing and maintenance | Yes, USD 812.00 million in 2025 | Annual and semi-annual tests are mandatory |
| Passive fire protection and fire-rated construction | No | Bought in the construction package |
| Fire pumps, tanks and portable extinguishers | No | Site civil works and consumables |
| Video surveillance and physical security | No | Separate security market |
The buyers inside this scope include hyperscale cloud operators, colocation providers, enterprises running their own server rooms, small and medium-sized enterprises (SMEs) with edge rooms, government agencies and telecom operators that run data centers.
Market Drivers: What Drives the Data Center Fire Detection and Suppression Market?
Three drivers explain the rise from USD 4.47 billion in 2025 to USD 10.35 billion in 2035: new capacity, lithium-ion battery risk and the cost of downtime.
New Capacity of 12.0 GW a Year Adds USD 2.95 billion of New-Build Spend
Every new MW of IT load needs detection, sprinklers and, in most halls, gaseous or water mist suppression before it can be commissioned. DC Market Insights estimates new-build fire protection at USD 2.95 billion in 2025 on about 12.0 GW of completions, rising to USD 5.96 billion by 2035 as annual completions approach 27 GW. The pipeline is visible: CBRE counted a record 7,481 MW under construction in North American primary markets in the first half of 2026, with vacancy at 1.4%, so most of those halls will be fitted out with fire systems within two years.
Lithium-Ion Battery Fires Raise Protection Content per MW
Lithium-ion UPS and battery backup units are now the main new fire risk in a data center, and operators are adding off-gas detection and dedicated battery-room suppression worth USD 313.16 million in 2025 and USD 1.04 billion by 2035. The fire at SK C&C’s Pangyo facility on 15 October 2022 began in a battery room and took firefighters around eight hours to control, and the 26-27 September 2025 fire at Korea’s National Information Resources Service (NIRS) in Daejeon began with a lithium-ion battery thermal event that disabled hundreds of government systems. In May 2026 the Uptime Institute reported that major data center fires have increased gradually, with lithium-ion UPS batteries a contributing factor.
Downtime Costs Above USD 1 Million Justify Very Early Warning Detection
A single fire can take a whole site offline: the OVHcloud fire in Strasbourg on 10 March 2021 destroyed 14,046 servers in one building and affected 120,000 services. In its 2026 outage analysis, Uptime found that one in five operators put the cost of their latest impactful outage above USD 1 million, and it had counted 14 high-profile outages caused by fire or fire suppression systems between 2020 and early 2023. Against those losses, aspirating smoke detection at about USD 5,000 per detector is cheap insurance, which is why detection and alarm holds 34.0% of 2025 spend.
Market Trends: How Is Data Center Fire Protection Changing?
Spend is shifting from fluorinated clean agents toward water-based, inert gas and battery-specific protection: water mist grows at 12.27% a year against 5.67% for clean agents.
Water Mist and Hybrid Systems Grow to USD 1.14 billion by 2035
Insurer guidance is moving away from gas for battery hazards. FM Data Sheet 5-32 (Data Centers), revised in July 2026, says operators should not use clean agent or hybrid extinguishing for rack-level lithium-ion battery backup units above 20 kWh, and it sets quick-response sprinklers at 0.2 gpm/ft2 over 2,500 ft2 for wet-pipe data halls. DC Market Insights expects water mist and hybrid systems to rise from USD 357.89 million in 2025 to USD 1.14 billion in 2035 as hyperscale halls standardise on water-based protection.
Low-Global-Warming-Potential Agents Replace HFC-227ea
Where gas is still chosen, buyers pick agents with a low global warming potential (GWP). In March 2026 Johnson Controls advised data center owners to favor low-GWP agents like FK-5-1-12 or naturally occurring gases such as inert gas blends. Clean agent suppression still grows from USD 1.07 billion in 2025 to USD 1.86 billion in 2035, because enterprise and colocation rooms keep it, but its share falls from 24.0% to 18.0%.
Aspirating Smoke Detection Becomes the Default in Data Halls
Very early warning detection is spreading from the data hall to electrical rooms and battery rooms. Siemens brought its UL-certified ASD+ aspirating smoke detection to the United States at the NFPA conference in June 2026, aimed at data centers, joining established systems such as Honeywell’s Xtralis VESDA range. DC Market Insights expects detection and alarm spend to reach USD 3.42 billion by 2035.
Market Challenges: What Holds the Data Center Fire Detection and Suppression Market Back?
Agent supply risk and lower content per AI MW limit growth to 8.75% a year, below the 15.74% of 2020-2025.
PFAS and HFC Rules Squeeze Clean Agent Supply
3M announced in December 2022 that it would exit all PFAS manufacturing by the end of 2025, a business with about USD 1.3 billion of annual net sales, and its fluoroketone was a leading clean agent for IT rooms. In the United States, the Environmental Protection Agency (EPA) requires recycled HFCs for servicing fire suppression equipment from 1 January 2026 and for new installations from 1 January 2030. These rules raise the cost of keeping legacy HFC-227ea systems and slow clean agent growth to 5.67% a year, the lowest of the five system types.
Content per AI MW Falls 12% by 2035
An AI hall carries far more IT load per square metre than a conventional hall, so it needs fewer detectors, sprinkler heads and cubic metres of gas per MW. DC Market Insights estimates content per AI MW at USD 210,000 in 2025, falling to USD 185,000 by 2035, about 12% lower. Enterprise data centers, where most new IT moves to cloud and colocation, grow only 3.33% a year, from USD 894.74 million to USD 1.24 billion. Project timing also matters: Halma reported weaker US organic growth in 2025-26 because of customer project delays in its fire safety business.
Market Opportunities: Where Are the New Revenue Pools?
Two pools add USD 2.57 billion of annual revenue between 2025 and 2035: recurring ITM services and lithium-ion protection.
Inspection, Testing and Maintenance Grows to USD 2.66 billion by 2035
The installed base of about 116 GW in 2025 needs annual and semi-annual testing of detectors, panels, sprinklers and agent cylinders. DC Market Insights values ITM at about USD 7,000 per installed MW per year in 2025, or USD 812.00 million, rising to USD 2.66 billion on a 313 GW base in 2035, a 12.61% CAGR. Service consolidators are buying into this stream: in December 2025 APi Group agreed to acquire CertaSite, an inspection provider expected to deliver about USD 90 million of 2025 revenue. New EPA training rules, which require HFC fire suppression technicians to finish training by 1 June 2026, favour certified service firms.
Lithium-Ion Off-Gas Detection Reaches USD 1.04 billion by 2035
Battery protection is the smallest system type today at USD 313.16 million in 2025 and the fastest-growing at 12.70% a year. Off-gas sensors detect electrolyte vapour minutes before a cell goes into thermal runaway, and suppliers are adding them to building fire panels; operators are retrofitting them into existing battery rooms after the 2022 and 2025 incidents in Korea.
Pricing: How Much Does Data Center Fire Protection Cost per MW?
DC Market Insights estimates installed fire detection and suppression at about USD 265,000 per MW in a conventional hall and USD 210,000 per MW in an AI hall in 2025, or roughly 1.2% to 1.5% of total development cost.
| Year | Conventional hall (USD per MW) | AI hall (USD per MW) | ITM (USD thousand per installed MW per year) |
|---|---|---|---|
| 2020 | 240,000 | 230,000 | 6.0 |
| 2025 | 265,000 | 210,000 | 7.0 |
| 2030 | 280,000 | 195,000 | 7.8 |
| 2035 | 290,000 | 185,000 | 8.5 |
Public price anchors support these values. Cushman & Wakefield puts the average greenfield development cost at USD 17.6 million per MW for the most modern facilities, up 21% per MW since its previous guide, so USD 265,000 per MW equals about 1.5% of the build. A single aspirating smoke detector, the Xtralis VESDA VEP-A00-P, lists at USD 5,025.99 at a US distributor before installation, and a conventional hall needs several such units per MW plus spot detectors in support rooms (DC Market Insights assumption). Conventional content rises 9% from 2025 to 2035 as battery protection and very early warning detection spread, while AI content falls because of density.
Standards and Regulation: Which Rules Shape Data Center Fire Protection?
Five sets of rules decide what is installed in the USD 4.47 billion market of 2025: NFPA codes, insurer data sheets, ISO and EN agent standards, F-gas law and PFAS restrictions.
- NFPA 75 (2024 edition): the National Fire Protection Association (NFPA) Standard for the Fire Protection of Information Technology Equipment sets construction, detection and suppression requirements for IT rooms; NFPA 2001 covers clean agent systems, NFPA 72 covers alarm systems and NFPA 855 covers energy storage systems.
- FM Data Sheet 5-32 (July 2026): FM’s data center sheet sets sprinkler densities of 0.2 gpm/ft2 over 2,500 ft2 and advises against clean agent for large rack lithium-ion battery units.
- ISO 14520 and EN 15004: design standards for gaseous extinguishing systems; under the EU F-gas Regulation, inspections done to these standards satisfy the leak-check duty for fire protection equipment.
- EU F-gas Regulation (EU) 2024/573: adopted on 7 February 2024, it tightens the HFC phase-down and the rules on placing HFC-filled fire protection equipment on the EU market.
- US AIM Act rules: EPA’s emissions reduction and reclamation rule requires recycled HFCs for servicing from 1 January 2026 and technician training by 1 June 2026.
- EU PFAS restriction: the European Chemicals Agency (ECHA) planned a consultation on the draft opinion in spring 2026 for the universal PFAS restriction, which could cover fluorinated suppression agents.
Market Segmentation: Which Segment Leads the Data Center Fire Detection and Suppression Market?
Fire detection and alarm systems lead with 34.0% of 2025 value, new-build systems take 65.9% and hyperscale data centers take 38.0%.
By System Type: Fire Detection and Alarm Systems Lead with 34.0%
Detection and alarm reach USD 3.42 billion by 2035, while lithium-ion battery protection grows fastest at 12.70% a year.
| System type | 2025 (USD million) | Share 2025 | 2035 (USD million) | CAGR 2025-2035 |
|---|---|---|---|---|
| Fire Detection and Alarm Systems | 1,521.06 | 34.0% | 3,415.76 | 8.43% |
| Pre-Action and Wet-Pipe Sprinkler Systems | 1,207.89 | 27.0% | 2,898.22 | 9.15% |
| Gaseous Clean Agent Suppression | 1,073.68 | 24.0% | 1,863.14 | 5.67% |
| Water Mist and Hybrid Suppression | 357.89 | 8.0% | 1,138.59 | 12.27% |
| Lithium-Ion Battery Off-Gas Detection and Protection | 313.16 | 7.0% | 1,035.08 | 12.70% |
By Offering: New-Build Systems Lead with 65.9%
New-build systems are worth USD 2.95 billion in 2025; ITM services grow fastest at 12.61% and reach 25.7% of the market in 2035.
| Offering | 2025 (USD million) | Share 2025 | 2035 (USD million) | CAGR 2025-2035 |
|---|---|---|---|---|
| New-Build Systems | 2,949.00 | 65.9% | 5,958.90 | 7.29% |
| Inspection Testing and Maintenance Services | 812.00 | 18.2% | 2,663.18 | 12.61% |
| Replacement and Upgrade | 712.68 | 15.9% | 1,728.71 | 9.27% |
By Data Center Type: Hyperscale Data Centers Lead with 38.0%
Hyperscale spend grows at 11.09% a year to USD 4.86 billion by 2035, and colocation follows at USD 3.62 billion.
| Data center type | 2025 (USD million) | Share 2025 | 2035 (USD million) | CAGR 2025-2035 |
|---|---|---|---|---|
| Hyperscale Data Centers | 1,700.00 | 38.0% | 4,864.87 | 11.09% |
| Colocation Data Centers | 1,610.52 | 36.0% | 3,622.78 | 8.44% |
| Enterprise Data Centers | 894.74 | 20.0% | 1,242.09 | 3.33% |
| Edge Data Centers | 268.42 | 6.0% | 621.05 | 8.75% |
DC Exclusive: The Fire Protection Content per MW Model and System × Data Center Type Matrix
This DC Market Insights model splits the USD 4.47 billion of 2025 across 5 system types and 4 data center types, built from 14 inputs including capacity cohorts, content per MW, replacement and ITM rates.
Hyperscale halls spend most on sprinklers and lithium-ion protection, while enterprise and edge rooms rely more on clean agent systems, which are simpler to retrofit into small rooms with raised floors. The cross-tab below (USD million, 2025) shows where each system type is sold.
| System type | Hyperscale Data Centers | Colocation Data Centers | Enterprise Data Centers | Edge Data Centers | Total |
|---|---|---|---|---|---|
| Fire Detection and Alarm Systems | 577.12 | 541.54 | 303.82 | 98.58 | 1,521.06 |
| Pre-Action and Wet-Pipe Sprinkler Systems | 525.27 | 428.59 | 204.39 | 49.65 | 1,207.89 |
| Gaseous Clean Agent Suppression | 305.37 | 401.15 | 278.65 | 88.52 | 1,073.68 |
| Water Mist and Hybrid Suppression | 150.83 | 128.67 | 61.36 | 17.03 | 357.89 |
| Lithium-Ion Battery Off-Gas Detection and Protection | 141.41 | 110.58 | 46.53 | 14.64 | 313.16 |
| Total | 1,700.00 | 1,610.52 | 894.74 | 268.42 | 4,473.68 |
Clean agent suppression takes 31.1% of enterprise spend (USD 278.65 million) but only 18.0% of hyperscale spend (USD 305.37 million).
Regional Insights: Which Region Leads the Data Center Fire Detection and Suppression Market?
North America leads with 40.0% of 2025 value (USD 1.79 billion), and the Middle East and Africa grows fastest at 12.98% a year.
North America Leads with 40.0% Share
North America grows from USD 1.79 billion in 2025 to USD 3.88 billion by 2035. CBRE counted 7,481 MW under construction in primary markets in the first half of 2026, and Siemens reported strong orders from data center project wins in the U.S. in late 2025. NFPA 75 and FM data sheets set the design baseline across the region.
Asia Pacific Holds 28.0% Share
Asia Pacific rises from USD 1.25 billion to USD 3.16 billion at 9.68% a year. India’s capacity grew from about 375 MW in 2020 to around 1,500 MW by 2025, and Singapore’s roadmap frees at least 300 MW of additional capacity. South Korea’s NIRS fire in September 2025 pushed battery-room protection up the regional agenda.
Europe Holds 23.5% Share
Europe grows from USD 1.05 billion to USD 2.12 billion at 7.28% a year, the slowest rate, as the F-gas Regulation and the PFAS restriction move buyers to inert gas and water mist. Ireland’s data centres used 22% of metered electricity in 2024, which shows how concentrated the region’s capacity is in a few hubs. The 2021 OVHcloud fire in Strasbourg remains the reference case for European insurers.
Middle East and Africa Holds 4.3% Share
The Middle East and Africa grows from USD 192.37 million to USD 652.10 million, the fastest at 12.98% a year. Saudi Arabia’s HUMAIN targets 1.9 GW by 2030 and 6.6 GW by 2034, and desert sites need detection that copes with dust and high ambient temperatures.
Latin America Holds 4.2% Share
Latin America grows from USD 187.89 million to USD 538.24 million at 11.10% a year. Querétaro holds 79% of Mexico’s installed capacity, 186 MW as of May 2025, and Brazil is the largest country market in the region.
Country Analysis: Which Countries Spend the Most on Data Center Fire Protection?
The United States spends the most at USD 1.57 billion in 2025, and India is the fastest-growing large country at 14.64% a year.
| Rank | Country | Region | 2025 (USD million) | 2035 (USD million) | CAGR 2025-2035 |
|---|---|---|---|---|---|
| 1 | United States | North America | 1,574.74 | 3,376.95 | 7.93% |
| 2 | China | Asia Pacific | 476.00 | 1,104.95 | 8.79% |
| 3 | Germany | Europe | 220.78 | 445.60 | 7.28% |
| 4 | Canada | North America | 214.74 | 504.60 | 8.92% |
| 5 | United Kingdom | Europe | 210.26 | 403.16 | 6.73% |
| 6 | Japan | Asia Pacific | 187.89 | 410.41 | 8.13% |
| 7 | France | Europe | 126.16 | 254.63 | 7.28% |
| 8 | Australia | Asia Pacific | 125.26 | 315.70 | 9.68% |
| 9 | India | Asia Pacific | 112.74 | 441.98 | 14.64% |
| 10 | Netherlands | Europe | 105.13 | 190.97 | 6.15% |
| 11 | Singapore | Asia Pacific | 87.68 | 189.42 | 8.01% |
| 12 | Brazil | Latin America | 84.55 | 242.21 | 11.10% |
India’s spend rises from USD 112.74 million to USD 441.98 million as its capacity, which quadrupled between 2020 and 2025, keeps growing. China is the second-largest market at USD 476.00 million in 2025. The top 12 countries account for 78.8% of 2025 value.
Forecast Scenarios: How Could the 2035 Forecast Change?
The 2035 value ranges from USD 8.30 billion in the low case to USD 12.10 billion in the high case, around a base case of USD 10.35 billion.
| Scenario | Assumption | 2035 (USD million) | CAGR 2025-2035 |
|---|---|---|---|
| Low | Completions 15% below base from 2026; content per MW 8% lower as AI halls standardise on sprinklers only | 8,296.23 | 6.37% |
| Base | About 27 GW of completions in 2035; content per MW as in the pricing table | 10,350.79 | 8.75% |
| High | Completions 12% above base; content per MW 6% higher as battery protection becomes standard | 12,102.35 | 10.46% |
Competitive Insights: Who Leads the Data Center Fire Detection and Suppression Market?
Johnson Controls, Honeywell and Siemens Smart Infrastructure together hold about 35% of the market (DC Market Insights estimate, based on installed-base presence in data halls and their fire businesses’ scale), and the rest is split among specialists and regional installers.
- Johnson Controls
- Honeywell
- Siemens Smart Infrastructure
- Minimax Viking Group
- Halma
- Hochiki
- Fike
- Victaulic
- Wagner Group
- Securiton
- Firetrace International
- APi Group
Johnson Controls, owner of the Tyco, Simplex and Autocall fire brands, reported FY2025 sales of USD 23.6 billion and a Systems and Services backlog of USD 14.9 billion, up 13% organically. Honeywell’s Building Automation segment, which includes Notifier panels and Xtralis aspirating detectors, had 2025 sales of USD 7.37 billion. Siemens Smart Infrastructure booked more than EUR 3.6 billion of data center orders in fiscal 2024. Among specialists, the Minimax Viking Group reports annual turnover of about EUR 2.7 billion, and Halma’s Safety sector, which includes Apollo detectors, earned GBP 947.5 million in the year to March 2026. The service layer is consolidating around APi Group, whose Safety Services segment earned USD 5.46 billion in 2025. Carrier sold its fire businesses in 2024: the Industrial Fire business went to Sentinel Capital Partners for USD 1.425 billion and the Commercial and Residential Fire business to an affiliate of Lone Star Funds for USD 3 billion.
Recent Developments
- In August 2026, Johnson Controls launched the Simplex Incident Manager and Autocall Fire Site Administrator workstations, aimed at data centers and other large sites, each able to monitor up to 250,000 devices (Source: Johnson Controls).
- In July 2026, FM revised Data Sheet 5-32 for data centers, advising against clean agent systems for rack lithium-ion battery units above 20 kWh (Source: FM).
- In June 2026, Siemens introduced its ASD+ aspirating smoke detection solution to the United States at the NFPA conference (Source: Siemens).
- In February 2026, the US EPA published its fire suppression fact sheet confirming that recycled HFCs are required for servicing from 1 January 2026 (Source: EPA).
- In December 2025, APi Group agreed to acquire CertaSite, a fire and life safety inspection provider with about USD 90 million of 2025 revenue (Source: APi Group).
- In November 2025, the Uptime Institute published its analysis of the September 2025 NIRS fire in Daejeon, which began with a lithium-ion battery thermal event (Source: Uptime Institute).
More data center infrastructure reports are listed on the industry page; the electrical side of the same rooms is covered in the Data Center Switchgear Market.
Methodology: How We Built the Data Center Fire Detection and Suppression Market Model
DC Market Insights built the USD 4.47 billion 2025 value bottom-up from 16 annual capacity cohorts and 14 model inputs.
New-build spend equals new IT MW times fire protection content per MW: in 2025, 7.8 GW of conventional capacity at USD 265,000 per MW gives USD 2.07 billion and 4.2 GW of AI capacity at USD 210,000 per MW gives USD 882.00 million. Replacement and upgrade equal 2.5% of the installed content each year (USD 712.68 million), and ITM equals USD 7,000 per installed MW on 116 GW (USD 812.00 million). The installed base retires at 1.05% a year and reaches about 313 GW in 2035; the AI share of new capacity rises from 35% in 2025 to 60% in 2030 and 66% in 2035. Region, country and segment splits are DC Market Insights allocations that sum to the total every year.
Bound checks. (1) Ceiling: fire protection new-build of USD 2.95 billion on 12.0 GW is 1.4% of the development cost implied by USD 17.6 million per MW across the 12.0 GW built in 2025, a small line in the mechanical package as expected. (2) Ceiling: the whole market of USD 4.47 billion is well below the combined 2025 fire and building revenue of Honeywell Building Automation (USD 7.37 billion), APi Safety Services (USD 5.46 billion) and Minimax Viking (about EUR 2.7 billion), which serve all building types. (3) Floor: even at USD 100,000 per MW, a DC Market Insights minimum for detection plus sprinklers, 12.0 GW of completions would give USD 1.20 billion of new-build spend, below our USD 2.95 billion.
The full approach is described on the research methodology page.
Table of contents
- 01Introduction
- 1.1Market Definition and Scope
- 1.2Included and Excluded Systems
- 1.3Currency, Pricing Basis and Units
- 1.4Research Approach
- 02Executive Summary
- 2.1Market Snapshot, 2025, 2026 and 2035
- 2.2Key Market Statistics
- 2.3Key Findings
- 03Why Market Estimates Differ
- 3.1Scope Comparison
- 3.2In-Scope Buyer Groups
- 04Market Dynamics: Drivers
- 4.1New Data Center Capacity
- 4.2Lithium-Ion Battery Fire Risk
- 4.3Cost of Downtime
- 05Market Trends
- 5.1Water Mist and Hybrid Systems
- 5.2Low-GWP Agents Replace HFC-227ea
- 5.3Aspirating Smoke Detection
- 06Market Challenges
- 6.1PFAS and HFC Rules
- 6.2Lower Content per AI MW
- 07Market Opportunities
- 7.1Inspection, Testing and Maintenance
- 7.2Lithium-Ion Off-Gas Detection
- 08Pricing Analysis
- 8.1Content per MW, 2020-2035
- 8.2Public Price Anchors
- 09Standards and Regulation
- 9.1NFPA 75, NFPA 2001, NFPA 72 and NFPA 855
- 9.2FM Data Sheet 5-32
- 9.3ISO 14520 and EN 15004
- 9.4EU F-gas Regulation and US AIM Act
- 9.5EU PFAS Restriction
- 10Market Segmentation by System Type
- 10.1Fire Detection and Alarm Systems
- 10.2Pre-Action and Wet-Pipe Sprinkler Systems
- 10.3Gaseous Clean Agent Suppression
- 10.4Water Mist and Hybrid Suppression
- 10.5Lithium-Ion Battery Off-Gas Detection and Protection
- 11Market Segmentation by Offering
- 11.1New-Build Systems
- 11.2Replacement and Upgrade
- 11.3Inspection Testing and Maintenance Services
- 12Market Segmentation by Data Center Type
- 12.1Hyperscale Data Centers
- 12.2Colocation Data Centers
- 12.3Enterprise Data Centers
- 12.4Edge Data Centers
- 13DC Exclusive: Fire Protection Content per MW Model
- 13.1System × Data Center Type Matrix, 2025
- 14North America
- 14.1United States
- 14.2Canada
- 15Asia Pacific
- 15.1China
- 15.2Japan
- 15.3Australia
- 15.4India
- 15.5Singapore
- 16Europe
- 16.1Germany
- 16.2United Kingdom
- 16.3France
- 16.4Netherlands
- 17Middle East and Africa
- 17.1Saudi Arabia
- 17.2United Arab Emirates
- 18Latin America
- 18.1Brazil
- 18.2Mexico
- 19Country Analysis
- 19.1Top 12 Countries, 2025 and 2035
- 20Forecast Scenarios
- 20.1Low, Base and High Cases
- 21Competitive Landscape
- 21.1Market Concentration
- 21.2Company Profiles
- 22Recent Developments
- 22.12025-2026 Product Launches, Rules and Deals
- 23Research Methodology
- 23.1Bottom-Up Model
- 23.2Bound Checks
- 23.3Sources
- Fig. 1Data Center Fire Detection and Suppression Market Size, 2020-2035 (USD Billion)
- Table 1Report Attributes
- Table 2Scope Comparison
- Table 3Fire Protection Content per MW, 2020-2035
- Table 4Market by System Type, 2025 and 2035
- Table 5Market by Offering, 2025 and 2035
- Table 6Market by Data Center Type, 2025 and 2035
- Table 7System × Data Center Type Matrix, 2025
- Table 8Top 12 Countries, 2025 and 2035
- Table 9Forecast Scenarios, 2035
About this report
Written by Amit Jain and reviewed by Deepti Agrawal, Senior Editor, Research. Figures are built top-down and bottom-up and reconciled before publication, with 2025 as the base year.
Read our methodologyHow we built this
- Historical period2020-2024
- Base year2025
- Forecast period2026-2035
- Sizing approachTop-down + bottom-up
Need more than the report?
Advisory on this market
Due diligence, site selection and market entry work, by the analysts who wrote this report.
See consulting servicesFrequently asked questions
USD 5.25 billion in 2026, up 17.2% from USD 4.47 billion in 2025, according to DC Market Insights estimates. The market is projected to reach USD 10.35 billion by 2035.
8.75% a year from 2025 to 2035, after 15.74% a year between 2020 and 2025, when annual data center completions rose to 12.0 GW.
USD 4.47 billion of 2025 spending covers fire alarm panels, aspirating smoke detection, pre-action and wet-pipe sprinklers, clean agent and inert gas systems, water mist, lithium-ion off-gas detection and their inspection, testing and maintenance. Passive fire protection and fire pumps are excluded.
34.0% of 2025 value, or USD 1.52 billion, goes to fire detection and alarm systems. Lithium-ion battery off-gas detection and protection grows fastest at 12.70% a year, to USD 1.04 billion by 2035.
About USD 265,000 per MW in a conventional hall and USD 210,000 per MW in an AI hall in 2025, according to DC Market Insights estimates, or roughly 1.2% to 1.5% of a USD 17.6 million per MW build.
40.0% of 2025 value, or USD 1.79 billion, is spent in North America. The Middle East and Africa grows fastest at 12.98% a year, and India is the fastest large country at 14.64%.
About 35% of the market is held by Johnson Controls, Honeywell and Siemens Smart Infrastructure together (DC Market Insights estimate). Minimax Viking Group, Halma, Hochiki, Fike, Victaulic, Wagner Group, Securiton, Firetrace International and APi Group also compete.
Yes: clean agent suppression is worth USD 1.07 billion in 2025 and USD 1.86 billion in 2035, but its share falls from 24.0% to 18.0% as PFAS and HFC rules push buyers toward inert gas and water mist.
USD 5.25 billion in 2026 is the DC Market Insights figure for active detection, suppression and their service only. Estimates that add passive fire protection, fire pumps, extinguishers or physical security come out two or more times larger.
USD 812.00 million in 2025, rising to USD 2.66 billion by 2035 at 12.61% a year, as inspection, testing and maintenance of about USD 7,000 per installed MW per year covers an installed base growing from 116 GW to 313 GW.
Licences, delivery and payment
Which licence should I choose?
Single User is a view-only PDF for one person. Multi User adds a printable PDF and the Excel data for unlimited users at one location. Enterprise covers your whole company and includes 100 free analyst hours.
How and when will I receive the report?
By email, within 24–48 business hours of payment, in the formats of your licence.
How can I pay?
Securely through PayPal: with a PayPal account, a debit or credit card, or PayPal Pay Later where available. Prices are in US dollars.
Can I see a sample first?
Yes. Request a free sample and we will email it to you.
Can the report be tailored to my needs?
Yes. We can add countries, segments or data cuts. Talk to an analyst about the scope you need.
Can I get an invoice or pay against a purchase order?
Write to sales@dcmarketinsights.com and our team will help.