
Data Center Access Control Market Size, Share & Forecast to 2035
Market at a glance
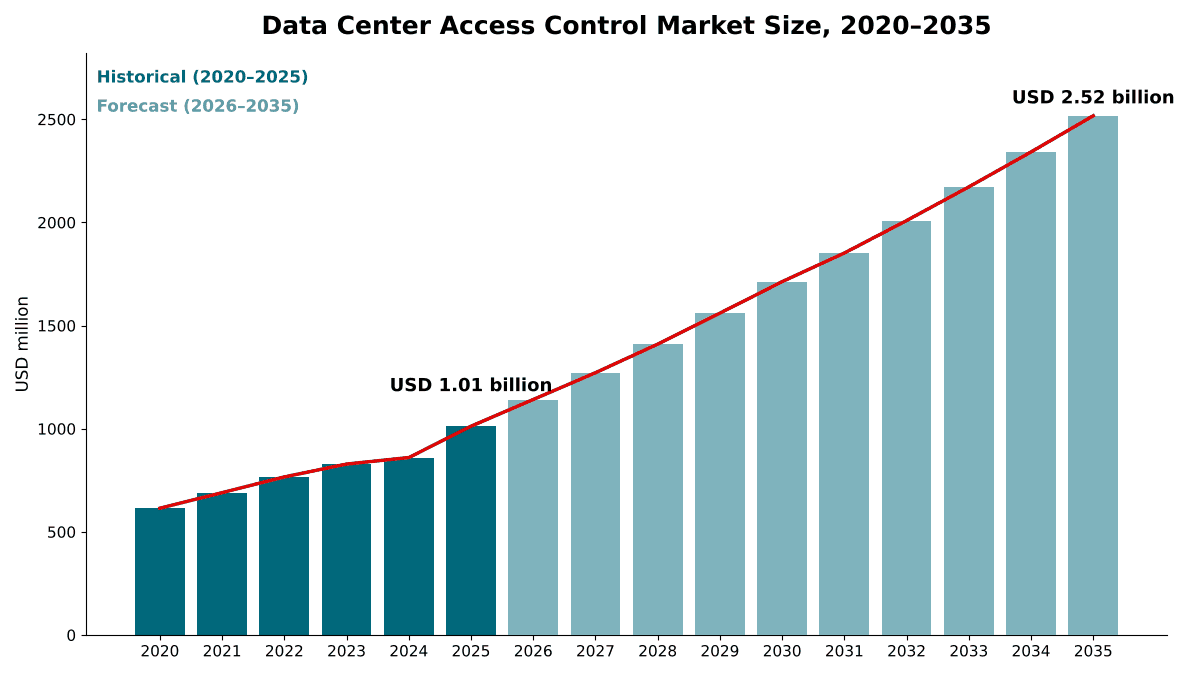
The Data Center Access Control market was worth USD 1,010.0 million in 2025 and is forecast to reach USD 2,520.0 million by 2035, growing at a 9.54% CAGR. North America accounts for 41.1% of the market.
 By Amit Jain, Senior Consultant, ICT & Emerging Technologies
 Reviewed by Deepti Agrawal
Last updated 10 Oct 2026
Base year 2025 PDF + Excel
Reviewed by Deepti Agrawal
Last updated 10 Oct 2026
Base year 2025 PDF + Excel
Source: DC Market Insights analysis
Key findings
New Capacity of 12.0 GW a Year Adds USD 524.76 Million of New-Build Spend
Rack-Level Control Reaches USD 203.74 Million
Physical Security Often Gets 5% or Less of the Build Budget
Services Grow to USD 501.03 Million by 2035
What is inside the report
- 01Introduction
- 02Research Methodology
- 03Executive Summary
- 04Market Dynamics
- 05Pricing Analysis
- 06Standards and Regulation
- 07Supply Chain and Value Chain Analysis
- 08Market Size and Forecast, 2020-2035
- 09Market by Component
- 10Market by Authentication Technology
- 23chapters
- 2020-2024Historical period
- 2026-2035Forecast period
- 17Companies profiled
Regional insights
- North America41.1%
- Asia Pacific25.1%
- Europe24.4%
- Middle East and Africa4.8%
- Latin America4.6%
Segmentation
Companies profiled
- Honeywell
- HID Global
- Johnson Controls
- ASSA ABLOY
- Allegion
- dormakaba
- Boon Edam
- Genetec
- Verkada
- Keenfinity
- Gallagher
- Suprema
- IDEMIA
- Alcatraz AI
- Southco
- Schneider Electric
- Securitas
Recent developments
Honeywell completed its USD 4.95 billion acquisition of Carrier's Global Access Solutions business, adding LenelS2, Onity and Supra (Source: Honeywell press release).
Bosch completed the sale of its security products business, including access and intrusion, to Triton, and the business now operates as Keenfinity Group (Source: Security Systems News and SecurityWorldMarket news articles).
Securitas partnered with Rohde & Schwarz to integrate millimeter-wave screening into its data center security offering (Source: everything RF news article).
ASSA ABLOY announced the acquisition of Kentix, a German maker of monitoring and access control products for data centers (Source: SecurityInfoWatch press release).
Alcatraz AI raised USD 50 million in Series B funding for its AI-enabled access control platform, whose customer base includes AI data centers (Source: SecurityInfoWatch news article).
NTT's Frankfurt 4 data center campus installed mantrap security entrances from Boon Edam (Source: IT Brief news article).
Full analysis
The Data Center Access Control Market covers the card and biometric readers, door controllers, electronic locks, security entrances and mantraps, rack and cabinet locks, access control software and the installation and managed services that decide who can enter a data center building, a data hall, a cage or a single rack. DC Market Insights values the global Data Center Access Control Market at USD 1.01 billion in 2025 and forecasts USD 2.52 billion by 2035, a CAGR of 9.54%. The build receipt: about 12.0 GW of new IT capacity at roughly USD 54,600 of access control content per MW in conventional halls and USD 23,500 per MW in AI halls gives USD 524.76 million of new-build spend, and software licenses, managed services and reader refresh on an installed base of about 116 GW add USD 487.35 million. Cloud-based access control is the fastest-growing segment at 16.40% a year because multi-site operators want one credential database and per-door subscription pricing, and the Middle East and Africa is the fastest-growing region at 13.25% a year as sovereign AI campuses such as Stargate UAE start from a small base.
Executive Summary
The Global Data Center Access Control Market size was valued at USD 614.72 million in 2020, reached USD 1.01 billion in 2025, and is anticipated to reach USD 2.52 billion by 2035, at a CAGR of 9.54% during the forecast period.
| Report attribute | Details |
|---|---|
| Historical Period | 2020-2024 |
| Base Year | 2025 |
| Forecast Period | 2026-2035 |
| Data Center Access Control Market Size 2025 | USD 1.01 Billion |
| Data Center Access Control Market, CAGR | 9.54% |
| Data Center Access Control Market Size 2035 | USD 2.52 Billion |
The market grew at 10.49% a year between 2020 and 2025, and 2025 alone added 17.7% over the USD 860.22 million of 2024 as completions jumped from 8.8 GW to 12.0 GW. Growth slows only slightly, to 9.54% a year from 2025 to 2035, because two forces pull in opposite directions. AI halls pack more compute behind each door, so access control content per new MW falls from about USD 43,700 in 2025 to about USD 40,200 in 2035 on a blended basis. At the same time the installed base grows from about 116 GW to about 311 GW, and the recurring layer of software, services and refresh rises from 48.2% of the market in 2025 to 56.8% in 2035.
Market Scope: What Does the Data Center Access Control Market Cover?
The Data Center Access Control Market covers every system that identifies a person and grants or denies physical entry on a data center property, from the site entrance to the rack door, valued at installed price in current US dollars. DC Market Insights sizes it at USD 1.01 billion in 2025.
Included. Card, mobile and biometric readers, keypads, door controllers, electric strikes and magnetic locks on controlled doors, mantraps, interlocking portals and turnstiles, electronic rack and cabinet locks, access control and visitor management software (on-premises and cloud), and the installation, integration and managed services sold with them.
The scope runs from facility entry control at the gate to critical room security at the data hall and cage.
Excluded. Video surveillance, perimeter fencing, vehicle barriers and intrusion detection, guarding, logical access management for IT systems, and mechanical keys.
How the segments fit together. The component split adds hardware, entrances, rack-level control, software and services to the USD 1.01 billion total. The authentication, deployment and data center type splits re-cut the same total by credential, by where the software runs and by buyer. Refresh of older readers and locks sits inside the hardware segments.
Market Drivers: What Drives the Data Center Access Control Market?
Three drivers explain most of the growth in the Data Center Access Control Market: a capacity build that more than doubles annual completions from 12.0 GW to 27.0 GW, compliance regimes that make physical entry an audited control, and the move from single-factor badges to biometric and multi-factor entry.
New Capacity of 12.0 GW a Year Adds USD 524.76 Million of New-Build Spend
The Data Center Access Control Market is still a build market: 51.8% of 2025 spending went into new halls. BloombergNEF counted 23.1 GW of capacity under construction globally across 831 sites at the end of September 2025, and the United States alone hosts 15.9 GW of it. DC Market Insights models annual completions rising from 12.0 GW in 2025 to 22.0 GW in 2030 and 27.0 GW in 2035, which lifts new-build access control spend from USD 524.76 million to USD 1.09 billion. Google, Amazon, Microsoft and Meta plan USD 725 billion of capital expenditure in 2026, up 77% from USD 410 billion in 2025.
Compliance Turns Physical Entry into an Audited Control
The PCI Security Standards Council treats any data center or server room that houses cardholder data systems as a sensitive area, and PCI DSS Requirement 9.1.1 addresses the need for video cameras and/or access control mechanisms. In the European Union, the Critical Entities Resilience (CER) Directive names access controls among the example physical protection measures critical entities should consider, and the Network and Information Security Directive (NIS2) requires security measures that address physical and environmental security and access control policies. Audits need logs, and logs need electronic readers rather than keys.
Biometric and Multi-Factor Entry Lift Spend per Door
DC Market Insights sees the badge-only door giving way to layered entry. Biometric systems account for USD 297.56 million (29.4%) of the Data Center Access Control Market in 2025 and grow at 12.45% a year, and multi-factor combined systems grow at 16.15% a year. Hyperscale operators publish their layers: Microsoft states that anyone who enters its datacenter buildings must pass two-factor authentication with biometrics to continue, and Google lists biometric identification among its controls. Reader makers are building for this: HID Global previewed its Amico facial recognition readers with five authentication methods, face, card, PIN, QR code and HID Mobile Access. DC Market Insights estimates the installed cost of a controlled door in a new data center at about USD 4,200 in 2025, rising 1.5% a year as biometric readers replace card-only units.
Market Trends: How Is Data Center Access Control Changing?
The Data Center Access Control Market is shifting control down to the rack, entry screening up to the building edge, and software from local servers to the cloud.
Rack-Level Control Reaches USD 203.74 Million
Multi-tenant halls need to know who opened which cabinet, not only who entered the room. Rack and cabinet access control, electronic swing handles with card or biometric readers on the front and rear doors, is worth USD 203.74 million (20.1%) in 2025. For Data Centre World London on 4–5 March 2026, dormakaba announced it would showcase electromechanical IT rack locks with radio-frequency identification (RFID) and IP readers for cabinet-level control. DC Market Insights estimates that 15% of conventional racks installed in 2025 carried electronic locks, rising to 29% by 2035. DC Market Insights assumes about 10 racks per MW in AI halls against about 100 in conventional halls, so rack-level spend grows at 7.62% a year, below the market. The RFID tags that track the equipment inside those racks are covered in the Data Center RFID Market report.
Mantraps and Screening Move to the Building Edge
Security entrances and mantraps are worth USD 234.43 million (23.2%) in 2025 and grow at 9.12% a year. In July 2026, NTT’s Frankfurt 4 data center campus installed mantrap security entrances from Boon Edam, and Equinix describes mantrap entries at its IBX sites that control ingress and egress with lockdown capability.
Cloud Access Control Takes a Third of the Market by 2035
Cloud-based access control, also sold as access control as a service (ACaaS), is worth USD 185.22 million (18.3%) in 2025 and is forecast to reach USD 845.78 million (33.6%) by 2035. Operators with dozens of sites want one credential database, remote revocation and per-door pricing; vendors such as Verkada sell door controllers together with a software license.
Market Challenges: What Holds the Data Center Access Control Market Back?
Thin security budgets and biometric privacy law are the two constraints that DC Market Insights expects to slow the market to 2030.
Physical Security Often Gets 5% or Less of the Build Budget
The Security Industry Association (SIA) reports that physical protections at many data centers remain constrained to just 5% or less of overall build budgets, and sometimes even less than 1% for major data center companies when building at scale. DC Market Insights models access control content in AI halls rising only from USD 23,500 per MW in 2025 to USD 26,700 per MW by 2035, slower than door prices, because large operators standardize designs and buy at scale.
Biometric Privacy Law Raises the Cost of Getting Biometrics Wrong
Biometric entry carries legal risk that card entry does not. The EU General Data Protection Regulation lists biometric data for the purpose of uniquely identifying a natural person as special-category data. The Illinois Biometric Information Privacy Act (BIPA) sets liquidated damages of USD 1,000 per negligent violation and USD 5,000 per intentional or reckless violation, although a 2024 amendment treats repeated collection from the same person by the same method as a single violation. Consent and retention policies add integration cost and slow some enterprise roll-outs.
Market Opportunities: Where Are the New Revenue Pools?
The two largest new revenue pools in the Data Center Access Control Market are managed services on a tripling installed base, growing at 13.66% a year, and edge data centers, growing at 13.11% a year.
Services Grow to USD 501.03 Million by 2035
Installation, integration and managed services are worth USD 139.20 million in 2025 and USD 501.03 million in 2035, the fastest-growing component. DC Market Insights models service spend at about USD 1,200 per installed MW per year in 2025, rising 3% a year, on an installed base that grows from about 116 GW to about 311 GW.
Edge Data Centers Add USD 181.85 Million of Annual Spend by 2035
Edge data centers spend USD 74.90 million on access control in 2025, and DC Market Insights expects USD 256.75 million by 2035. Unstaffed sites need remote unlock and cloud audit trails, so software and services take a larger share of each edge dollar.
Pricing: How Much Does Access Control Cost per MW?
A conventional data center hall carries about USD 54,600 of access control content per MW of IT load in 2025, and an AI hall about USD 23,500 per MW. These are DC Market Insights estimates covering readers, controllers, locks, entrances, rack locks and commissioning software at installed price.
| Access control content per MW (USD thousand) | 2020 | 2025 | 2030 | 2035 |
|---|---|---|---|---|
| Conventional hall | 49.3 | 54.6 | 61.3 | 66.5 |
| AI hall | 22.2 | 23.5 | 25.2 | 26.7 |
| AI share of new capacity | 3% | 35% | 60% | 66% |
Public prices anchor the model. An HID iCLASS SE RK40 card reader with keypad lists at USD 601 at a US reseller. Verkada lists its one-door AC12 controller at USD 899 with a license required, and its four-door AC43 at USD 1,999 including a one-year license. An electronic rack handle of the Raritan SmartLock type is on sale at USD 478 (regular USD 516) at a US reseller, so a front-and-rear pair costs about USD 956 at the sale price. Prefabricated security vestibules are quoted at USD 25,000 to USD 80,000 depending on rating, and Verkada’s annual software licenses generally range from USD 100 to USD 300 per door, according to procurement platform Vendr. DC Market Insights uses USD 48,000 per installed mantrap and USD 110 per door per year for software.
Standards and Regulation: Which Rules Shape Data Center Access Control?
Five sets of rules decide how a data center controls entry: data center design standards from the Telecommunications Industry Association (TIA) and CENELEC, information security frameworks, product safety listings, EU critical infrastructure law and biometric privacy law.
ANSI/TIA-942. The TIA data center standard covers physical security alongside monitoring and system redundancy, so design briefs that follow it specify entry control from the first drawing.
EN 50600-2-5. The European data center standard for security systems addresses protection against unauthorized access through organizational and technological solutions and assigns Protection Classes to data center spaces, against which operators specify entry control zone by zone.
ISO/IEC 27001 and SOC 2. ISO/IEC 27001:2022 control 7.2 states that secure areas should be protected by appropriate entry controls and access points, and SOC 2 criterion CC6.4 requires restricting physical access to facilities and protected information assets.
UL 294 and FIPS 201. UL 294, Access Control System Units, reached its eighth edition in May 2023, and FIPS 201-3 credentials authenticate individuals who require access to federally controlled facilities in the United States.
EU NIS2 and CER directives. Member States had until 17 October 2024 to transpose both NIS2 and the Critical Entities Resilience Directive (EU) 2022/2557, whose Article 13 names fencing, barriers, detection equipment and access controls among the physical protection measures.
Market Segmentation: Which Segment Leads the Data Center Access Control Market?
Readers, controllers and door locks lead the Data Center Access Control Market with 29.7% of 2025 value, colocation data centers lead buyers with 38.6%, and card and keypad systems still hold 55.6% of value by credential. The fastest-growing segment is cloud-based access control at 16.40% a year, ahead of multi-factor combined systems at 16.15%, because operators with many sites want central credential management and subscription pricing rather than one server per building.
By Component: Readers, Controllers and Door Locks Lead with 29.7%
| Component | 2025 (USD million) | Share 2025 | 2035 (USD million) | CAGR 2025-2035 |
|---|---|---|---|---|
| Readers, Controllers and Door Locks | 300.44 | 29.7% | 662.81 | 8.23% |
| Security Entrances and Mantraps | 234.43 | 23.2% | 561.13 | 9.12% |
| Rack and Cabinet Access Control | 203.74 | 20.1% | 424.49 | 7.62% |
| Access Control Software | 134.30 | 13.3% | 367.73 | 10.60% |
| Installation, Integration and Managed Services | 139.20 | 13.8% | 501.03 | 13.66% |
Services gain 6.1 points of share by 2035 as the installed base grows faster than new builds, while rack-level control loses share because AI halls hold far fewer racks per MW.
By Authentication Technology: Card and Keypad Systems Lead with 55.6%
| Authentication technology | 2025 (USD million) | Share 2025 | 2035 (USD million) | CAGR 2025-2035 |
|---|---|---|---|---|
| Card and Keypad | 562.73 | 55.6% | 886.05 | 4.64% |
| Biometric | 297.56 | 29.4% | 961.57 | 12.45% |
| Mobile Credentials | 71.86 | 7.1% | 312.13 | 15.82% |
| Multi-Factor Combined Systems | 79.96 | 7.9% | 357.44 | 16.15% |
Biometric systems overtake keypad-based and card credential access control by 2035, reaching 38.2% of value against 35.2%. Mobile credential access control grows at 15.82% a year from a small base as operators issue phone-based credentials to contractors and visitors.
By Deployment: On-Premises Systems Lead with 81.7%
On-premises access control servers account for USD 826.89 million (81.7%) of 2025 value and grow at 7.29% a year to USD 1.67 billion by 2035. Cloud-based systems account for USD 185.22 million (18.3%) and grow at 16.40% a year to USD 845.78 million. Colocation groups and edge operators lead the shift to the cloud.
By Data Center Type: Colocation Data Centers Lead with 38.6%
| Data center type | 2025 (USD million) | Share 2025 | 2035 (USD million) | CAGR 2025-2035 |
|---|---|---|---|---|
| Colocation Data Centers | 390.67 | 38.6% | 984.23 | 9.68% |
| Hyperscale Data Centers | 300.60 | 29.7% | 901.15 | 11.60% |
| Enterprise Data Centers | 245.94 | 24.3% | 375.06 | 4.31% |
| Edge Data Centers | 74.90 | 7.4% | 256.75 | 13.11% |
Colocation leads because every tenant cage, suite and rack needs its own access rights and audit trail. Hyperscale data centers grow fastest among the large buyer groups at 11.60% a year, and enterprise data centers grow slowest at 4.31% as workloads move to cloud and colocation.
DC Exclusive: The Access Control Content per MW Model and Component × Data Center Type Matrix
At USD 110.89 million in 2025, rack and cabinet access control in colocation data centers is the single largest cell of the matrix and 11.0% of all data center access control spending. The matrix below cross-tabulates what is bought against who buys it. It is a DC Market Insights model, not a shipment count: it is built from 50 inputs: 32 capacity cohorts (16 years of conventional and AI halls), 8 door, portal, rack density and adoption inputs, 3 price curves, 5 software and service rates and 2 lifecycle rates, and then tested against 3 bound checks.
| 2025, USD million | Colocation | Hyperscale | Enterprise | Edge |
|---|---|---|---|---|
| Readers, Controllers and Door Locks | 101.32 | 92.91 | 80.43 | 25.78 |
| Security Entrances and Mantraps | 87.92 | 95.28 | 46.15 | 5.08 |
| Rack and Cabinet Access Control | 110.89 | 38.13 | 40.01 | 14.71 |
| Access Control Software | 46.87 | 38.68 | 33.83 | 14.92 |
| Installation, Integration and Managed Services | 43.67 | 35.60 | 45.52 | 14.41 |
| Total | 390.67 | 300.60 | 245.94 | 74.90 |
Colocation operators spend 28.4% of their access control budget at the rack, while hyperscale operators spend 31.7% of theirs on security entrances and mantraps, because a single-tenant campus controls people at the building and hall edge rather than at each cabinet. Enterprise data centers spend 18.5% of their budget on installation, integration and managed services, the highest share of any buyer, because few run a dedicated security team.
The content per MW model has two inputs any reader can check: new capacity delivered each year (12.0 GW in 2025) and the share built for AI (35% in 2025). Multiplying each by its content per MW gives new-build spend; adding software, services and refresh on the installed base gives the market. The model and its assumptions are explained on our research methodology page.
Regional Insights: Which Region Leads the Data Center Access Control Market?
North America leads the Data Center Access Control Market with 41.1% of 2025 value, and the Middle East and Africa is the fastest-growing region at 13.25% a year, because sovereign AI campuses such as Stargate UAE add large, high-security sites to a small base.
North America Leads with 41.1% Share
North American operators spent USD 416.28 million on data center access control in 2025, and the region is forecast to reach USD 933.89 million in 2035, a CAGR of 8.42%. The United States has more than 3,000 operational data centers and more than 1,500 in various stages of development, and it hosted 15.9 GW of the 23.1 GW under construction worldwide in late 2025.
Asia Pacific Holds 25.1% Share
Asia Pacific is worth USD 254.04 million in 2025 and USD 722.43 million by 2035, a CAGR of 11.02%. India’s data center capacity reached almost 1.5 GW in 2025, up from 375 MW in 2020, and Johor in Malaysia had 422 MW under construction according to an October 2025 Cushman & Wakefield update and is on track to become a 1 GW market by the end of 2026.
Europe Holds 24.4% Share
Europe is worth USD 246.65 million in 2025 and USD 551.26 million by 2035, a CAGR of 8.37%. Europe’s share of spend is well above its 15% share of 2024 data center electricity use reported by the International Energy Agency (IEA), which DC Market Insights attributes to EN 50600 protection classes, NIS2 and the CER Directive pushing operators toward more layers of control per MW.
Middle East and Africa Holds 4.8% Share
The Middle East and Africa is worth USD 48.58 million in 2025 and USD 168.65 million by 2035, the fastest regional CAGR at 13.25%. Stargate UAE is planned as a 1 GW cluster, with a first 200 MW data center scheduled for 2026; DC Market Insights expects such government-backed AI sites to specify high protection levels from day one.
Latin America Holds 4.6% Share
Latin America is worth USD 46.56 million in 2025 and USD 140.96 million by 2035, a CAGR of 11.71%. Brazil had 706 MW of data center inventory by August 2026 and 660 MW under construction.
Country Analysis: Which Countries Spend the Most on Data Center Access Control?
The United States is the largest country market for data center access control at USD 371.74 million in 2025, 36.7% of global value, followed by China at USD 92.47 million (9.1%) and Germany at USD 52.29 million (5.2%). The 12 largest countries account for 77.9% of 2025 spending.
| Rank | Country | Region | 2025 (USD million) | Share 2025 | 2035 (USD million) | CAGR 2025-2035 |
|---|---|---|---|---|---|---|
| 1 | United States | North America | 371.74 | 36.7% | 821.82 | 8.26% |
| 2 | China | Asia Pacific | 92.47 | 9.1% | 229.73 | 9.53% |
| 3 | Germany | Europe | 52.29 | 5.2% | 113.01 | 8.01% |
| 4 | United Kingdom | Europe | 50.56 | 5.0% | 105.84 | 7.67% |
| 5 | Canada | North America | 44.54 | 4.4% | 112.07 | 9.67% |
| 6 | Japan | Asia Pacific | 40.90 | 4.0% | 106.92 | 10.09% |
| 7 | France | Europe | 29.10 | 2.9% | 66.70 | 8.65% |
| 8 | Netherlands | Europe | 22.94 | 2.3% | 47.96 | 7.65% |
| 9 | Australia | Asia Pacific | 22.61 | 2.2% | 65.74 | 11.26% |
| 10 | India | Asia Pacific | 22.10 | 2.2% | 94.64 | 15.66% |
| 11 | Brazil | Latin America | 21.05 | 2.1% | 65.26 | 11.98% |
| 12 | Singapore | Asia Pacific | 18.29 | 1.8% | 44.07 | 9.19% |
India is the fastest-growing large country market at 15.66% a year, ahead of Brazil at 11.98% and Australia at 11.26%, as hyperscale and colocation operators add capacity outside the established hubs. Outside the top 12, South Korea is worth USD 16.51 million in 2025 and USD 41.90 million by 2035 (9.76% a year), Saudi Arabia USD 10.40 million and USD 44.19 million (15.57%), and Mexico USD 9.54 million and USD 30.17 million (12.20%). The country figures are a DC Market Insights allocation of the regional totals, weighted by each country’s estimated share of installed and new data center capacity, and the North American rows sum to the regional total.
Forecast Scenarios: How Could the 2035 Forecast Change?
The Data Center Access Control Market reaches USD 2.52 billion by 2035 in the base case, with a range of USD 2.14 billion to USD 2.92 billion across the low and high scenarios.
| Scenario | Assumption from 2026 | 2035 (USD billion) | CAGR 2025-2035 |
|---|---|---|---|
| Low | Capacity additions 15% below base; rack lock adoption 15% lower; software rates 10% lower | 2.14 | 7.76% |
| Base | Additions rise to 27.0 GW a year; AI share of new capacity reaches 66% | 2.52 | 9.54% |
| High | Additions 15% above base; rack lock adoption 15% higher; software rates 10% higher | 2.92 | 11.17% |
The low case reflects a pause in AI capital spending and value engineering of security budgets. The high case assumes that NIS2, CER and tenant requirements push rack-level control into most new multi-tenant halls.
Competitive Insights: Who Leads the Data Center Access Control Market?
- Honeywell
- HID Global
- Johnson Controls
- ASSA ABLOY
- Allegion
- dormakaba
- Boon Edam
- Genetec
- Verkada
- Keenfinity
- Gallagher
- Suprema
- IDEMIA
- Alcatraz AI
- Southco
- Schneider Electric
- Securitas
The Data Center Access Control Market is fragmented: DC Market Insights estimates that the three largest suppliers of readers, controllers and software, Honeywell, HID Global and Johnson Controls, together hold about 27% of the market. The estimate sets the disclosed scale of the large access control groups against the USD 1.01 billion market, assuming data centers take a low single-digit share of their sales. Honeywell completed its USD 4.95 billion acquisition of Carrier’s Global Access Solutions business, which brought LenelS2, with forecast annual sales above USD 1 billion when combined with Honeywell’s existing security portfolio (Source: Honeywell press release). Allegion reported 2025 net revenues of USD 4.07 billion, ASSA ABLOY reports sales of SEK 152 billion with 64,000 employees, and dormakaba reported total sales of CHF 2.87 billion for its 2024/25 financial year, so data centers are a small vertical for each of them. Boon Edam supplies the mantrap entrances at NTT’s Frankfurt 4 campus, dormakaba markets rack locks with RFID and IP readers, Alcatraz AI counts AI data centers among its customers, and Keenfinity is the former Bosch security products business.
Recent Developments
- In June 2024, Honeywell completed its USD 4.95 billion acquisition of Carrier’s Global Access Solutions business, adding LenelS2, Onity and Supra (Source: Honeywell press release).
- In July 2025, Bosch completed the sale of its security products business, including access and intrusion, to Triton, and the business now operates as Keenfinity Group (Source: Security Systems News and SecurityWorldMarket news articles).
- In September 2025, Securitas partnered with Rohde & Schwarz to integrate millimeter-wave screening into its data center security offering (Source: everything RF news article).
- In October 2025, ASSA ABLOY announced the acquisition of Kentix, a German maker of monitoring and access control products for data centers (Source: SecurityInfoWatch press release).
- In April 2026, Alcatraz AI raised USD 50 million in Series B funding for its AI-enabled access control platform, whose customer base includes AI data centers (Source: SecurityInfoWatch news article).
- In July 2026, NTT’s Frankfurt 4 data center campus installed mantrap security entrances from Boon Edam (Source: IT Brief news article).
We follow these deals, launches and deployments as they happen in our data center industry updates. Buyers planning a full security program can compare access control with video, perimeter and intrusion spending in the Data Center Physical Security Market report.
Methodology: How We Built the Data Center Access Control Market Model
DC Market Insights built this market bottom-up from 16 annual capacity cohorts (2020 to 2035), each split into conventional and AI halls. New-build spend multiplies each cohort by its access control content per MW: 4.5 controlled doors per MW in conventional halls and 2.0 in AI halls at USD 4,200 per door in 2025, 0.30 and 0.15 security entrances per MW at USD 48,000 each, rack locks on 15% of about 100 racks per MW in conventional halls and 30% of about 10 racks per MW in AI halls at USD 956 per rack, and USD 7,000 and USD 5,000 of commissioning software per MW. Installed-base spend adds software at 4.6 doors per installed MW and USD 110 per door per year in 2025, services at USD 1,200 per installed MW per year, and hardware refresh on a 12-year cycle. The installed base of about 116 GW in 2025 retires at 1.05% a year. The total was split by 5 components, 4 authentication technologies, 2 deployment models, 4 data center types and 5 regions, and every split sums to the market total.
Because no supplier discloses data center access control sales, the result was tested against three bounds. Ceiling one: at the low end of the older 1% to 1.5% rule of thumb reported by SIA, physical security on the IEA’s USD 0.5 trillion of 2024 data center investment would be about USD 5.00 billion; modeled new-build access control of USD 524.76 million is about a tenth of that. Ceiling two: Allegion alone reported USD 4.07 billion of 2025 revenue, about four times the whole market. Floor: one prefabricated vestibule at the USD 25,000 low end for each of the 831 sites under construction gives USD 20.78 million, well below the modeled USD 234.43 million entrance segment. The analyst named on this page built the model, and the reviewer checked the arithmetic, the sources and the dates before publication.
Table of contents
- 01Introduction
- 1.1Market Definition and Scope
- 1.2Included and Excluded Systems
- 1.3Currency, Pricing Basis and Years Considered
- 02Research Methodology
- 2.1Bottom-Up Access Control Content per MW Model
- 2.2Capacity Cohorts: Conventional and AI Halls
- 2.3Bound Checks and Data Sources
- 2.4Assumptions and Limitations
- 03Executive Summary
- 3.1Market Size, 2020, 2025 and 2035
- 3.2Key Findings
- 3.3Analyst Viewpoint
- 04Market Dynamics
- 4.1Drivers
- 4.2Trends
- 4.3Challenges
- 4.4Opportunities
- 05Pricing Analysis
- 5.1Access Control Content per MW, Conventional and AI Halls
- 5.2Reader, Controller, Rack Lock and Mantrap Price Points
- 5.3Software License Pricing per Door
- 06Standards and Regulation
- 6.1ANSI/TIA-942 and EN 50600-2-5
- 6.2ISO/IEC 27001, SOC 2 and PCI DSS
- 6.3UL 294 and FIPS 201
- 6.4EU NIS2 and CER Directives
- 6.5Biometric Privacy Law: GDPR and Illinois BIPA
- 07Supply Chain and Value Chain Analysis
- 7.1Reader and Controller Manufacturers
- 7.2Security Entrance and Rack Lock Suppliers
- 7.3Software Platforms
- 7.4Systems Integrators and Service Providers
- 08Market Size and Forecast, 2020-2035
- 8.1Historical Market Size, 2020-2024
- 8.2Forecast, 2026-2035
- 8.3New-Build and Installed-Base Spend
- 09Market by Component
- 9.1Readers, Controllers and Door Locks
- 9.2Security Entrances and Mantraps
- 9.3Rack and Cabinet Access Control
- 9.4Access Control Software
- 9.5Installation, Integration and Managed Services
- 10Market by Authentication Technology
- 10.1Card and Keypad
- 10.2Biometric
- 10.3Mobile Credentials
- 10.4Multi-Factor Combined Systems
- 11Market by Deployment
- 11.1On-Premises
- 11.2Cloud-Based (ACaaS)
- 12Market by Data Center Type
- 12.1Colocation Data Centers
- 12.2Hyperscale Data Centers
- 12.3Enterprise Data Centers
- 12.4Edge Data Centers
- 13DC Exclusive: Component × Data Center Type Matrix
- 13.1Results by Cell, 2025
- 13.2Model Inputs and Bound Checks
- 14North America Market
- 14.1United States
- 14.2Canada
- 15Europe Market
- 15.1Germany
- 15.2United Kingdom
- 15.3France
- 15.4Netherlands
- 15.5Rest of Europe
- 16Asia Pacific Market
- 16.1China
- 16.2Japan
- 16.3Australia
- 16.4India
- 16.5Singapore
- 16.6Rest of Asia Pacific
- 17Latin America Market
- 17.1Brazil
- 17.2Rest of Latin America
- 18Middle East and Africa Market
- 18.1Size, 2025 and 2035
- 18.2Growth Outlook to 2035
- 19Regional Cross-Sections
- 19.1Regional Shares, 2025 and 2035
- 19.2Regional Growth Rates, 2025-2035
- 19.3Top 12 Countries, 2025 and 2035
- 20Forecast Scenarios
- 20.1Low, Base and High Scenarios, 2035
- 20.2Key Swing Factors
- 21Competitive Landscape
- 21.1Market Structure and Concentration
- 21.2Mergers, Acquisitions and Partnerships
- 21.3Product Launches and Deployments
- 22Company Profiles
- 22.1Honeywell
- 22.2HID Global
- 22.3Johnson Controls
- 22.4ASSA ABLOY
- 22.5Allegion
- 22.6dormakaba
- 22.7Boon Edam
- 22.8Genetec
- 22.9Verkada
- 22.10Keenfinity
- 22.11Gallagher
- 22.12Suprema
- 22.13IDEMIA
- 22.14Alcatraz AI
- 22.15Southco
- 22.16Schneider Electric
- 22.17Securitas
- 23Analyst Recommendations
- 23.1For Access Control Vendors
- 23.2For Data Center Operators
- 23.3For Investors
- Fig. 1Data Center Access Control Market Size, 2020–2035 (USD million)
- Fig. 2Data Center Access Control Market by Component, 2025 and 2035
- Fig. 3Data Center Access Control Market by Data Center Type, 2025 and 2035
- Fig. 4Data Center Access Control Market by Region, 2025 and 2035
- Fig. 5Component × Data Center Type Matrix, 2025
- Fig. 6Access Control Content per MW, Conventional and AI Halls, 2020–2035
- Fig. 7Forecast Scenarios, 2035
- Table 1Report Attributes
- Table 2Access Control Content per MW, 2020, 2025, 2030 and 2035
- Table 3Market by Component, 2025 and 2035
- Table 4Market by Authentication Technology, 2025 and 2035
- Table 5Market by Deployment, 2025 and 2035
- Table 6Market by Data Center Type, 2025 and 2035
- Table 7Component × Data Center Type Matrix, 2025
- Table 8Market by Region, 2025 and 2035
- Table 9Top 12 Countries, 2025 and 2035
- Table 10Forecast Scenarios, 2035
- Table 11Recent Developments, 2024–2026
About this report
Written by Amit Jain and reviewed by Deepti Agrawal, Senior Editor, Research. Figures are built top-down and bottom-up and reconciled before publication, with 2025 as the base year.
Read our methodologyHow we built this
- Historical period2020-2024
- Base year2025
- Forecast period2026-2035
- Sizing approachTop-down + bottom-up
Need more than the report?
Advisory on this market
Due diligence, site selection and market entry work, by the analysts who wrote this report.
See consulting servicesFrequently asked questions
USD 1.01 billion in 2025, rising to USD 2.52 billion by 2035. DC Market Insights estimates the market at USD 614.72 million in 2020.
9.54% a year from 2025 to 2035, after 10.49% a year between 2020 and 2025, when annual completions rose to 12.0 GW.
29.7% of 2025 value, or USD 300.44 million, goes to readers, controllers and door locks. Installation, integration and managed services grow fastest at 13.66% a year.
About USD 54,600 per MW in a conventional hall and USD 23,500 per MW in an AI hall in 2025, according to DC Market Insights estimates covering readers, controllers, locks, entrances, rack locks and commissioning software.
41.1% of 2025 value, or USD 416.28 million, is spent in North America. The Middle East and Africa grows fastest at 13.25% a year.
About 27% of the market is held by Honeywell, HID Global and Johnson Controls together (DC Market Insights estimate). ASSA ABLOY, Allegion, dormakaba, Boon Edam, Genetec, Verkada, Keenfinity, Suprema, IDEMIA, Alcatraz AI, Southco and Gallagher also compete.
USD 390.67 million, or 38.6% of 2025 spending, comes from colocation data centers. Edge data centers grow fastest at 13.11% a year.
12.45% a year, from USD 297.56 million in 2025 to USD 961.57 million by 2035, when biometric systems overtake card and keypad systems with 38.2% of value.
Licences, delivery and payment
Which licence should I choose?
Single User is a view-only PDF for one person. Multi User adds a printable PDF and the Excel data for unlimited users at one location. Enterprise covers your whole company and includes 100 free analyst hours.
How and when will I receive the report?
By email, within 24–48 business hours of payment, in the formats of your licence.
How can I pay?
Securely through PayPal: with a PayPal account, a debit or credit card, or PayPal Pay Later where available. Prices are in US dollars.
Can I see a sample first?
Yes. Request a free sample and we will email it to you.
Can the report be tailored to my needs?
Yes. We can add countries, segments or data cuts. Talk to an analyst about the scope you need.
Can I get an invoice or pay against a purchase order?
Write to sales@dcmarketinsights.com and our team will help.