
Multi-Access Edge Computing Market Size, Share & Forecast to 2035
Market at a glance
The Multi-Access Edge Computing market was worth USD 6,300.0 million in 2025 and is forecast to reach USD 30.62 billion by 2035, growing at a 17.13% CAGR. Asia Pacific accounts for 44.6% of the market.
 By Amit Jain, Senior Consultant, ICT & Emerging Technologies
 Reviewed by Deepti Agrawal
Last updated 7 Oct 2026
Base year 2025 PDF + Excel
Reviewed by Deepti Agrawal
Last updated 7 Oct 2026
Base year 2025 PDF + Excel
Source: DC Market Insights analysis
Key findings
5G Standalone MEC Spending Grows 26.24% a Year to USD 21.99 Billion by 2035
Hyperscaler Edge Zones Spread to New Cities
Edge Revenue Builds Slower Than Tower Owners Planned
Services Reach USD 16.08 Billion by 2035
What is inside the report
- 01Introduction
- 02Research Methodology
- 03Executive Summary
- 04Market Dynamics
- 05Pricing Analysis
- 06Standards and Regulation
- 07Supply Chain and Ecosystem
- 08Market Size and Forecast
- 09Multi-Access Edge Computing Market, By Component
- 10Multi-Access Edge Computing Market, By Deployment
- 21chapters
- 2020-2024Historical period
- 2026-2035Forecast period
- 17Companies profiled
Regional insights
- Asia Pacific44.6%
- North America28.3%
- Europe18.4%
- Middle East and Africa4.6%
- Latin America4.1%
Segmentation
Companies profiled
- Nokia
- Ericsson
- Samsung
- NVIDIA
- Amazon Web Services (AWS)
- Google Cloud
- Microsoft
- Verizon
- T-Mobile
- SK Telecom
- NTT DOCOMO
- SoftBank
- Deutsche Telekom
- Vodafone
- Crown Castle
- American Tower
- SBA Communications
Recent developments
AWS opened a Wavelength Zone with Sonatel, an affiliate of Orange, in Dakar, Senegal (Source: AWS product announcement).
T-Mobile unveiled Edge Control, which breaks cellular traffic out locally into an enterprise's MEC environment (Source: Mobile World Live news report).
NVIDIA agreed to invest USD 1.00 billion in Nokia for AI-RAN work, with trials expected to begin in 2026 (Source: Data Center Dynamics news report).
ETSI released its first MEC Phase 4 specifications and a white paper on ETSI MEC and CAMARA APIs (Source: ETSI press release).
Deutsche Telekom, Orange, Telefonica, TIM and Vodafone announced the first live demonstration of the federated European Edge Continuum, shown at MWC 2026 (Source: Vodafone press release).
Ericsson made Ericsson Private 5G available through Verizon Business private wireless deployments beyond US borders (Source: Ericsson press release).
Full analysis
The Multi-Access Edge Computing Market covers the compute, platform software and services deployed at the edge of mobile, fixed and Wi-Fi access networks: multi-access edge computing (MEC) nodes at operator sites, on-premise MEC sold with private 5G networks, and edge cloud and network application programming interface (API) services sold from those sites, built on European Telecommunications Standards Institute (ETSI) and 3rd Generation Partnership Project (3GPP) specifications. DC Market Insights values the global Multi-Access Edge Computing Market at USD 6.30 billion in 2025 and forecasts USD 30.62 billion by 2035, a CAGR of 17.13%. The 2025 value is built from four layers: about 6,400 new operator MEC nodes at an average of USD 0.29 million each give USD 1.86 billion; about 2,430 new enterprise MEC sites at USD 0.33 million each add USD 801.90 million; recurring platform software and services on the installed base of about 22,770 operator nodes and 6,990 enterprise sites add USD 2.37 billion; and edge cloud and API service revenue adds USD 1.27 billion. AI inference and generative AI is the fastest-growing application at 28.41% a year because cell sites and mobile switching offices are being prepared to host AI inference servers close to users, and the Middle East and Africa is the fastest-growing region at 21.42% a year as 5G standalone networks and the first hyperscaler edge zones arrive from a small base.
Executive Summary
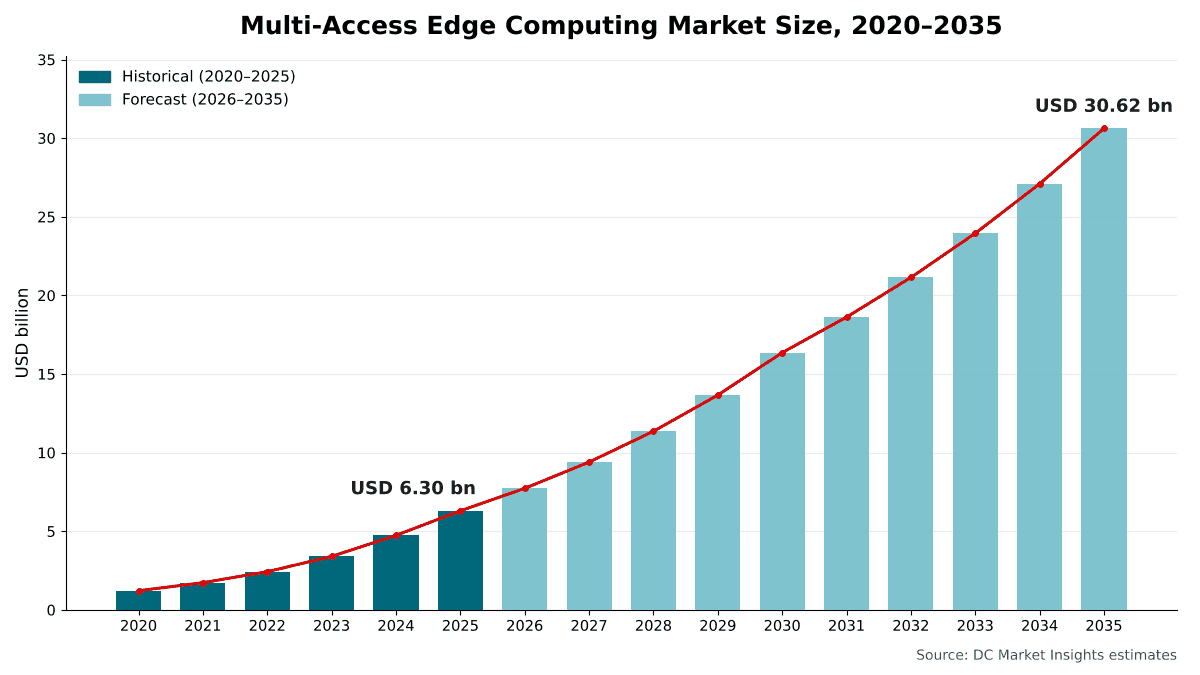
The Global Multi-Access Edge Computing Market size was valued at USD 1.22 billion in 2020, reached USD 6.30 billion in 2025, and is anticipated to reach USD 30.62 billion by 2035, at a CAGR of 17.13% during the forecast period.
| Report attribute | Details |
|---|---|
| Historical Period | 2020-2024 |
| Base Year | 2025 |
| Forecast Period | 2026-2035 |
| Multi-Access Edge Computing Market Size 2025 | USD 6.30 Billion |
| Multi-Access Edge Computing Market, CAGR | 17.13% |
| Multi-Access Edge Computing Market Size 2035 | USD 30.62 Billion |
Spending on multi-access edge computing grew at 38.87% a year between 2020 and 2025 from a small base, and 2025 added 32.9% over the USD 4.74 billion of 2024 as operators moved from trial MEC sites to production nodes. DC Market Insights estimates that new operator MEC node deployments rose from about 1,900 in 2020 to 6,400 in 2025. Growth slows to 17.13% a year from 2025 to 2035 because the installed base is larger and edge revenue is building more slowly than tower owners first planned, but the market still grows almost fivefold as 5G standalone becomes the main access network and AI inference moves into the network edge.
Market Scope: What Does the Multi-Access Edge Computing Market Cover?
The Multi-Access Edge Computing Market covers spending on compute that sits inside or directly attached to an access network and is exposed to applications through MEC platforms, valued at first sale in current US dollars, with 2025 as the base year and forecasts to 2035. DC Market Insights sizes it at USD 6.30 billion in 2025. ETSI describes multi-access edge computing as offering “application developers and content providers cloud-computing capabilities and an IT service environment at the edge of the network”, and notes that MEC is not only focused on mobile networks but also covers fixed and WLAN access (Source: ETSI Industry Specification Group MEC).
Included. Servers, accelerators and storage installed as MEC nodes in operator central offices, aggregation sites, switching offices and cell sites; on-premise MEC sold with private 5G or Long Term Evolution (LTE) networks; MEC platform, orchestration and network exposure software; integration and managed services; and edge cloud and network API services sold from MEC sites, including hyperscaler zones inside operator networks.
Excluded. Radio access network (RAN) baseband and radio units, operator core network functions, content delivery networks outside access networks, enterprise edge servers not attached to a mobile network, devices, connectivity charges, spectrum, land and power connections.
How the segments fit together. The component, deployment, network access, application and end-use splits each re-cut the same USD 6.30 billion total. The deployment split follows the four layers of the model. Multi-access edge computing is a focused cut of the network and telco edge tier in our Edge Computing Market report, which also counts content delivery and edge platforms outside access networks.
Market Drivers: What Drives the Multi-Access Edge Computing Market?
Three drivers add USD 24.32 billion to the Multi-Access Edge Computing Market between 2025 and 2035. They are the shift to 5G standalone networks that can route traffic to local edge sites, AI inference moving into cell sites and switching offices, and private networks that bring MEC onto factory and campus sites.
5G Standalone MEC Spending Grows 26.24% a Year to USD 21.99 Billion by 2035
DC Market Insights values the 5G standalone (SA) access segment at USD 2.14 billion for 2025 and USD 21.99 billion for 2035, rising from 34.0% to 71.8% of the market. The Ericsson Mobility Report of June 2026 counted 3.1 billion 5G subscriptions after 162 million were added in the first quarter of 2026, forecast 6.4 billion by the end of 2031, and said that some 390 service providers have launched commercial 5G services, more than 90 of which have launched 5G Standalone (Source: Ericsson press release). The Global mobile Suppliers Association (GSA) counted 184 operators in 76 countries that had invested in 5G standalone as of March 2026, and 95 operators in 53 countries that had launched a 5G standalone service.
AI Inference Turns Cell Sites into Edge Compute Sites
AI inference and generative AI applications account for USD 620.00 million of MEC spending in 2025 and USD 7.56 billion by 2035, rising from 9.8% to 24.7% of the market. Vendors and operators are building the hardware path: NVIDIA agreed to invest USD 1.00 billion in Nokia for AI radio access network (AI-RAN) work, T-Mobile will test the AI-RAN technologies with the two companies, and trials are expected to begin in 2026. Describing T-Mobile’s AI-RAN work, NVIDIA said that cell sites and mobile switching offices can support distributed edge AI workloads while continuing to deliver 5G connectivity.
Private Networks Bring MEC onto Enterprise Sites
Enterprise on-premise MEC grows 19.72% a year, from USD 1.24 billion in 2025 to USD 7.50 billion in 2035, as private mobile networks become routine. GSA counted 2,003 organizations in 88 countries that had deployed one or more private mobile networks at the end of the first quarter of 2026. Operators now sell the edge breakout as a product: T-Mobile’s Edge Control lets cellular data traffic be broken out locally at a hospital, a manufacturing plant or a military base and flow directly into that enterprise’s MEC environment, and Ericsson Private 5G is now available through Verizon Business private wireless deployments beyond US borders.
Market Trends: How Is Multi-Access Edge Computing Supply Changing?
Multi-access edge computing supply is shifting from single-operator edge sites toward hyperscaler edge zones, federated operator edges and AI-ready tower sites, with hyperscaler-operator edge zones the fastest-growing deployment model at 23.11% a year.
Hyperscaler Edge Zones Spread to New Cities
AWS Wavelength is available in 31 cities across the globe through carrier partners. AWS opened a Wavelength Zone with Sonatel, an affiliate of Orange, in Dakar, Senegal, in April 2025, its first in Sub-Saharan Africa, and added a zone with Verizon in Lenexa, Kansas, in May 2025. Not every cloud provider is expanding: Microsoft retired its Azure Private 5G Core service on September 30, 2025. DC Market Insights values the hyperscaler-operator edge zone segment at USD 510.00 million for 2025, rising to USD 4.08 billion for 2035.
Operators Federate Their Edges and Expose Network APIs
Deutsche Telekom, Orange, Telefonica, TIM and Vodafone announced the first live demonstration of the European Edge Continuum, a federated edge spanning the five largest operators in Europe, shown at MWC 2026. The GSM Association (GSMA) Open Gateway memorandum of understanding has been signed by 69 network operators representing 78% of global mobile connections, and ETSI has published a white paper on how ETSI MEC service APIs complement open-source implementations such as the CAMARA Service APIs. Network APIs, location and other applications account for USD 760.00 million of MEC spending in 2025 and USD 2.66 billion by 2035.
Tower Owners Test AI Edge Sites Without Heavy Capex
Crown Castle is working with Available Infrastructure on Project Qestral, an edge AI initiative that plans 1,000 AI Edge locations in 100 US cities by the end of 2026 and that Crown Castle describes as a trial, and Crown Castle is testing neocloud deployments using existing sites, power and fiber while avoiding significant capex. Graphics processing unit (GPU) capacity at such sites links MEC to the GPU as a Service Market report. DC Market Insights expects the average operator MEC node to cost USD 0.36 million by 2035, up from USD 0.29 million in 2025, as more nodes carry GPUs.
Market Challenges: What Holds the Multi-Access Edge Computing Market Back?
Slow monetization of operator edge sites and modest growth in enterprise network sales are the two main constraints on the Multi-Access Edge Computing Market, and they hold 5G non-standalone and LTE MEC to 4.44% a year, the slowest segment.
Edge Revenue Builds Slower Than Tower Owners Planned
American Tower chief executive Steven Vondran said in July 2025 of edge computing that “our initial timing on that was a little bit off” and that “it’s developing slower than we thought it was going to”. SBA Communications, which owns tower-based data centers, warned in its annual report for 2025 that its investments in ancillary services and emerging technologies, including its mobile edge computing initiative and private networks, “may not prove to be profitable” (Source: SBA Communications annual report filed with the SEC). DC Market Insights therefore models operator node additions growing 11.84% a year from 2025 to 2030 and 7.12% a year from 2030 to 2035, well below the pace of the past five years.
Private Network Vendor Sales Grow Only Modestly
Ericsson’s Enterprise segment reported net sales down 19% year on year to SEK 4.5 billion in the second quarter of 2026, mainly because of the divestment of iconectiv and currency effects; on a comparable basis sales rose 3%, and Enterprise Wireless Solutions benefited from growth in WWAN solutions. With vendor revenue growing only modestly, DC Market Insights assumes the average enterprise MEC site price falls from USD 0.33 million in 2025 to USD 0.30 million by 2035 as suppliers compete on smaller nodes.
Market Opportunities: Where Are the New Revenue Pools?
The largest new revenue pools in the Multi-Access Edge Computing Market are services, which add USD 13.50 billion of annual spend by 2035, and healthcare, the fastest-growing end use at 19.24% a year.
Services Reach USD 16.08 Billion by 2035
Services, which cover edge cloud compute, network APIs, integration and managed operations, rise from USD 2.58 billion in 2025 to USD 16.08 billion in 2035, a CAGR of 20.08%, and from 41.0% to 52.5% of the market.
Healthcare and Automotive Grow Fastest
Healthcare MEC spending grows from USD 470.00 million in 2025 to USD 2.73 billion by 2035, and automotive grows from USD 510.00 million to USD 2.94 billion at 19.15% a year, as imaging, patient monitoring and connected vehicle services need local processing. Connected vehicles and vehicle-to-everything (V2X) applications grow 18.76% a year to USD 2.79 billion.
Emerging Markets Get Their First Edge Zones
The Middle East and Africa grows from USD 290.00 million in 2025 to USD 2.02 billion by 2035, and Latin America grows at 18.91% a year to USD 1.47 billion.
Pricing: How Much Does a MEC Node Cost?
An operator MEC node costs about USD 0.29 million on average in 2025, and an enterprise on-premise MEC site about USD 0.33 million, including servers, accelerators and the platform software license at installation. These are DC Market Insights estimates; they exclude radio equipment, site works and power.
| MEC pricing indicator (USD million) | 2020 | 2025 | 2030 | 2035 |
|---|---|---|---|---|
| Average capex per new operator MEC node | 0.26 | 0.29 | 0.33 | 0.36 |
| Average capex per new enterprise MEC site | 0.36 | 0.33 | 0.31 | 0.30 |
| Recurring spend per installed operator node per year | 0.080 | 0.085 | 0.088 | 0.090 |
| Recurring spend per installed enterprise site per year | 0.058 | 0.062 | 0.060 | 0.058 |
Operator node prices rise about 2.2% a year from 2025 to 2035 in the model as GPU servers enter edge sites. Edge cloud capacity carries its own price list: AWS states that EC2 instances and other resources in Wavelength Zones have different prices than in the parent region.
Standards and Regulation: Which Rules Shape Multi-Access Edge Computing?
Four sets of rules shape how multi-access edge computing is built and sold: the ETSI MEC specifications, the 3GPP edge application architecture, the GSMA Open Gateway and CAMARA API work, and the European Union’s proposed Digital Networks Act.
ETSI MEC. ETSI’s MEC group completed Phase 3 with an updated MEC architecture (MEC 003), terminology (MEC 001) and use cases (MEC 002), and its Phase 4 work for 2024 to 2026 includes a study on distributed edge networks (MEC 047).
3GPP TS 23.558. The 3GPP specification “Architecture for enabling Edge Applications” (TS 23.558) is maintained by working group SA6 and was first introduced in Release 17; DC Market Insights treats it as the application-layer counterpart of the ETSI MEC platform specifications.
GSMA Open Gateway. The memorandum of understanding behind GSMA Open Gateway has been signed by 69 of the world’s largest network operators, representing 78% of global mobile connections.
EU Digital Networks Act. The European Commission unveiled the Digital Networks Act on January 21, 2026, as a proposal to replace the European Electronic Communications Code with a regulation; DC Market Insights expects its rules on network sharing and cross-border services to shape federated operator edges.
Market Segmentation: Which Segment Leads the Multi-Access Edge Computing Market?
Services lead the Multi-Access Edge Computing Market with 41.0% of 2025 value. Operator network MEC leads deployment models with 72.2%, 5G non-standalone and LTE leads network access with 51.6%, video analytics and computer vision leads applications with 24.4%, and manufacturing leads end uses with 23.8%. AI inference and generative AI is the fastest-growing segment at 28.41% a year, because GPU servers at cell sites and switching offices let operators sell inference capacity close to users.
By Component: Services Lead with 41.0%
| Component | 2025 (USD billion) | Share 2025 | 2035 (USD billion) | CAGR 2025-2035 |
|---|---|---|---|---|
| Hardware | 1.80 | 28.6% | 6.67 | 13.99% |
| Software | 1.92 | 30.5% | 7.87 | 15.15% |
| Services | 2.58 | 41.0% | 16.08 | 20.08% |
By Deployment: Operator Network MEC Leads with 72.2%
| Deployment model | 2025 (USD billion) | Share 2025 | 2035 (USD billion) | CAGR 2025-2035 |
|---|---|---|---|---|
| Operator Network MEC | 4.55 | 72.2% | 19.04 | 15.39% |
| Enterprise On-Premise MEC | 1.24 | 19.7% | 7.50 | 19.72% |
| Hyperscaler-Operator Edge Zones | 0.51 | 8.1% | 4.08 | 23.11% |
By Network Access: 5G Non-Standalone and LTE Leads with 51.6%
| Network access | 2025 (USD billion) | Share 2025 | 2035 (USD billion) | CAGR 2025-2035 |
|---|---|---|---|---|
| 5G Standalone | 2.14 | 34.0% | 21.99 | 26.24% |
| 5G Non-Standalone and LTE | 3.25 | 51.6% | 5.02 | 4.44% |
| Fixed and Wi-Fi Access | 0.91 | 14.4% | 3.61 | 14.77% |
5G standalone rises from 34.0% of the market in 2025 to 71.8% by 2035, while 5G non-standalone and LTE falls from 51.6% to 16.4% as operators move MEC traffic onto standalone cores.
By Application: Video Analytics and Computer Vision Leads with 24.4%
| Application | 2025 (USD billion) | Share 2025 | 2035 (USD billion) | CAGR 2025-2035 |
|---|---|---|---|---|
| Video Analytics and Computer Vision | 1.54 | 24.4% | 7.01 | 16.36% |
| Industrial Automation and Robotics | 1.10 | 17.5% | 4.84 | 15.97% |
| Content Caching and Media Delivery | 0.99 | 15.7% | 2.51 | 9.75% |
| Cloud Gaming, AR and VR | 0.79 | 12.5% | 3.25 | 15.19% |
| Network APIs, Location and Other | 0.76 | 12.1% | 2.66 | 13.35% |
| AI Inference and Generative AI | 0.62 | 9.8% | 7.56 | 28.41% |
| Connected Vehicles and V2X | 0.50 | 7.9% | 2.79 | 18.76% |
AI inference and generative AI moves from the sixth-largest application in 2025 to the largest by 2035. Cloud gaming, augmented reality (AR) and virtual reality (VR) grow 15.19% a year, and industrial automation and robotics, which covers industrial Internet of Things (IIoT) control loops, grows 15.97% a year.
By End Use: Manufacturing Leads with 23.8%
| End use | 2025 (USD billion) | Share 2025 | 2035 (USD billion) | CAGR 2025-2035 |
|---|---|---|---|---|
| Manufacturing | 1.50 | 23.8% | 7.52 | 17.49% |
| Media, Gaming and Entertainment | 1.23 | 19.5% | 4.62 | 14.15% |
| Government, Energy and Others | 1.07 | 17.0% | 5.70 | 18.21% |
| Transportation and Logistics | 0.83 | 13.2% | 4.29 | 17.85% |
| Retail and Venues | 0.69 | 11.0% | 2.82 | 15.12% |
| Automotive | 0.51 | 8.1% | 2.94 | 19.15% |
| Healthcare | 0.47 | 7.5% | 2.73 | 19.24% |
Manufacturing gains share to 24.6% by 2035 as factories pair private 5G with on-premise MEC. Government, energy and others, which includes smart cities, public safety and utilities, grows 18.21% a year.
DC Exclusive: The Four-Layer MEC Build Model and Deployment × End Use Matrix
At USD 0.98 billion in 2025, operator network MEC bought for manufacturing is the single largest cell of the matrix and 15.6% of all multi-access edge computing spending. The matrix below cross-tabulates who uses MEC and where the compute sits. It is a DC Market Insights model, not a shipment count: it is built from 140 inputs: 16 annual cohorts (2020 to 2035) for each of 7 drivers (new operator nodes, operator node capex, new enterprise sites, enterprise site capex, recurring spend per operator node, recurring spend per enterprise site and edge cloud and API revenue), 21 matrix seed weights (3 deployment models for each of 7 end uses), 3 installed-base parameters and 4 component and deployment split ratios.
| 2025, USD billion | Operator Network MEC | Enterprise On-Premise MEC | Hyperscaler-Operator Edge Zones | Total |
|---|---|---|---|---|
| Manufacturing | 0.98 | 0.49 | 0.03 | 1.50 |
| Media, Gaming and Entertainment | 0.96 | 0.04 | 0.23 | 1.23 |
| Government, Energy and Others | 0.74 | 0.27 | 0.06 | 1.07 |
| Transportation and Logistics | 0.54 | 0.24 | 0.05 | 0.83 |
| Retail and Venues | 0.56 | 0.07 | 0.06 | 0.69 |
| Automotive | 0.44 | 0.02 | 0.05 | 0.51 |
| Healthcare | 0.33 | 0.11 | 0.03 | 0.47 |
| Total | 4.55 | 1.24 | 0.51 | 6.30 |
Manufacturing buyers put 32.7% of their MEC budgets on-premise, the highest of any end use, while media, gaming and entertainment buyers spend 18.7% in hyperscaler-operator edge zones because cloud gaming and streaming workloads already run on public cloud platforms. Automotive spending is 86.3% operator network MEC because vehicles reach the edge through public networks.
The model and its assumptions are explained on our research methodology page.
Regional Insights: Which Region Leads the Multi-Access Edge Computing Market?
Asia Pacific leads the Multi-Access Edge Computing Market with 44.6% of 2025 value. The Middle East and Africa is the fastest-growing region at 21.42% a year, because operators there are launching 5G standalone networks and edge zones from a small base.
Asia Pacific Leads with 44.6% Share
Asia Pacific spent USD 2.81 billion on multi-access edge computing in 2025 and is forecast to reach USD 14.05 billion in 2035, a CAGR of 17.46%. China drives the region’s lead: RCR Wireless reported, citing the Ministry of Industry and Information Technology, that Chinese operators had deployed a total of 4.25 million 5G base stations by the end of 2024. SK Telecom’s AI data center revenue reached KRW 519.9 billion in 2025, a 34.9% increase, and SoftBank is working toward the commercialization of AI-RAN from 2026 onwards.
North America Holds 28.3% Share
North America is worth USD 1.78 billion in 2025 and USD 7.69 billion by 2035, a CAGR of 15.76%, the slowest of the five regions. The region hosts the AWS Wavelength Zone with Verizon in Lenexa, Kansas, T-Mobile’s Edge Control service and the tower-site edge plans of Crown Castle and SBA Communications. North America loses 3.2 points of share by 2035.
Europe Holds 18.4% Share
Europe is worth USD 1.16 billion in 2025 and USD 5.39 billion by 2035, a CAGR of 16.60%. The federated European Edge Continuum and the proposed Digital Networks Act shape how operators share edge capacity across borders. Germany is the largest European country market at USD 270.00 million in 2025.
Middle East and Africa Holds 4.6% Share
The Middle East and Africa is worth USD 290.00 million in 2025 and USD 2.02 billion by 2035, the fastest growth of any region at 21.42% a year. Saudi Arabia, worth USD 90.00 million in 2025, is the only country from the region in the top 12, and the Dakar zone is the first AWS Wavelength Zone in Sub-Saharan Africa.
Latin America Holds 4.1% Share
Latin America is worth USD 260.00 million in 2025 and USD 1.47 billion by 2035, a CAGR of 18.91%, led by Brazil at USD 110.00 million in 2025 and USD 640.00 million by 2035.
Country Analysis: Which Countries Spend the Most on Multi-Access Edge Computing?
The United States is the largest country market for multi-access edge computing at USD 1.60 billion in 2025, 25.4% of global value, followed closely by China at USD 1.52 billion (24.1%) and Japan at USD 400.00 million (6.3%). The 12 largest countries account for 81.9% of 2025 spending.
| Rank | Country | Region | 2025 (USD billion) | Share 2025 | 2035 (USD billion) | CAGR 2025-2035 |
|---|---|---|---|---|---|---|
| 1 | United States | North America | 1.60 | 25.4% | 6.89 | 15.72% |
| 2 | China | Asia Pacific | 1.52 | 24.1% | 6.98 | 16.47% |
| 3 | Japan | Asia Pacific | 0.40 | 6.3% | 1.81 | 16.30% |
| 4 | South Korea | Asia Pacific | 0.33 | 5.2% | 1.41 | 15.63% |
| 5 | Germany | Europe | 0.27 | 4.3% | 1.22 | 16.28% |
| 6 | United Kingdom | Europe | 0.23 | 3.7% | 1.01 | 15.95% |
| 7 | Canada | North America | 0.18 | 2.9% | 0.80 | 16.09% |
| 8 | India | Asia Pacific | 0.17 | 2.7% | 1.71 | 25.97% |
| 9 | France | Europe | 0.16 | 2.5% | 0.73 | 16.39% |
| 10 | Brazil | Latin America | 0.11 | 1.7% | 0.64 | 19.26% |
| 11 | Australia | Asia Pacific | 0.10 | 1.6% | 0.46 | 16.49% |
| 12 | Saudi Arabia | Middle East and Africa | 0.09 | 1.4% | 0.70 | 22.77% |
India is the fastest-growing large country market at 25.97% a year, ahead of Saudi Arabia at 22.77% and Brazil at 19.26%, and China overtakes the United States as the largest country market by 2035. The country figures are a DC Market Insights allocation of the regional totals, weighted by each country’s estimated 5G standalone coverage, operator edge site count and private network base; North America here covers the United States and Canada. Outside the top 12, the same allocation gives Italy USD 110.00 million in 2025 and USD 500.00 million by 2035 (16.35% a year), Spain USD 80.00 million and USD 370.00 million (16.55%), the United Arab Emirates USD 70.00 million and USD 490.00 million (21.48%), and Mexico USD 70.00 million and USD 390.00 million (18.74%).
Forecast Scenarios: How Could the 2035 Forecast Change?
The Multi-Access Edge Computing Market reaches USD 30.62 billion by 2035 in the base case, with a range of USD 25.11 billion to USD 35.83 billion across the low and high scenarios.
| Scenario | Assumption from 2026 | 2035 (USD billion) | CAGR 2025-2035 |
|---|---|---|---|
| Low | Node and site additions, recurring spend and edge cloud revenue 18.0% below base by 2035 | 25.11 | 14.83% |
| Base | 15,800 new operator nodes and 13,500 new enterprise sites in 2035; edge cloud and API revenue of USD 10.20 billion | 30.62 | 17.13% |
| High | Node and site additions, recurring spend and edge cloud revenue 17.0% above base by 2035 | 35.83 | 18.98% |
The low case keeps AI inference in centralized cloud regions; the high case assumes AI-RAN servers at cell sites are sold as edge compute across federated operator edges.
Competitive Insights: Who Leads the Multi-Access Edge Computing Market?
- Nokia
- Ericsson
- Samsung
- NVIDIA
- Amazon Web Services (AWS)
- Google Cloud
- Microsoft
- Verizon
- T-Mobile
- SK Telecom
- NTT DOCOMO
- SoftBank
- Deutsche Telekom
- Vodafone
- Crown Castle
- American Tower
- SBA Communications
The Multi-Access Edge Computing Market is fragmented: DC Market Insights estimates that no single supplier holds more than about 8% of 2025 value and that the five largest together hold about 30%. The basis is supplier positions across hardware, platform software and edge cloud set against the USD 6.30 billion market. Nokia, Ericsson and Samsung sell MEC platforms and private network products; Nokia said in July 2024 that it had more than 730 private wireless customers worldwide. Operators own most edge sites and sell the services; AWS and Google Cloud supply edge cloud platforms. Tower owners supply sites, power and fiber.
Recent Developments
- In April 2025, AWS opened a Wavelength Zone with Sonatel, an affiliate of Orange, in Dakar, Senegal (Source: AWS product announcement).
- In October 2025, T-Mobile unveiled Edge Control, which breaks cellular traffic out locally into an enterprise’s MEC environment (Source: Mobile World Live news report).
- In October 2025, NVIDIA agreed to invest USD 1.00 billion in Nokia for AI-RAN work, with trials expected to begin in 2026 (Source: Data Center Dynamics news report).
- In October 2025, ETSI released its first MEC Phase 4 specifications and a white paper on ETSI MEC and CAMARA APIs (Source: ETSI press release).
- In February 2026, Deutsche Telekom, Orange, Telefonica, TIM and Vodafone announced the first live demonstration of the federated European Edge Continuum, shown at MWC 2026 (Source: Vodafone press release).
- In June 2026, Ericsson made Ericsson Private 5G available through Verizon Business private wireless deployments beyond US borders (Source: Ericsson press release).
We follow these Multi-Access Edge Computing Market launches, partnerships and edge site announcements as they happen in our data center industry updates.
Methodology: How We Built the Multi-Access Edge Computing Market Model
DC Market Insights built the Multi-Access Edge Computing Market model bottom-up from four layers and 16 annual cohorts (2020 to 2035). For operator network MEC, new node deployments (1,900 in 2020, 6,400 in 2025 and 15,800 in 2035) were multiplied by average capex per node (USD 0.26 million, USD 0.29 million and USD 0.36 million). For enterprise on-premise MEC, new sites (380, 2,430 and 13,500) were multiplied by capex per site (USD 0.36 million, USD 0.33 million and USD 0.30 million). Recurring platform software and services were modeled on an installed base of nodes and sites deployed in the previous six years, at USD 0.085 million per operator node and USD 0.062 million per enterprise site a year in 2025, giving USD 2.37 billion in 2025 and USD 10.68 billion in 2035. Edge cloud and API service revenue was modeled directly, rising from USD 120.00 million in 2020 to USD 1.27 billion in 2025 and USD 10.20 billion in 2035, and split 60:40 between operators and hyperscale cloud providers. The total was split by 3 components, 3 deployment models, 3 network access types, 7 applications, 7 end uses, 5 regions and 12 countries, and every split sums to the market total. The result was checked top-down against Ericsson and GSA 5G standalone and private network counts, AWS Wavelength city coverage, Ericsson’s Enterprise segment sales, SK Telecom’s AI data center revenue and the network and telco edge tier of our Edge Computing Market model.
Table of contents
- 01Introduction
- 1.1Market Definition and Scope
- 1.2Deployment Models Covered
- 1.3Currency, Base Year and Forecast Period
- 1.4Key Stakeholders
- 02Research Methodology
- 2.1Four-Layer Bottom-Up Build
- 2.2Top-Down Cross-Checks
- 2.3Primary and Secondary Sources
- 2.4Assumptions and Limitations
- 03Executive Summary
- 3.1Market Size, 2020, 2025 and 2035
- 3.2Key Findings
- 3.3Analyst Viewpoint
- 04Market Dynamics
- 4.1Drivers
- 4.2Trends
- 4.3Challenges
- 4.4Opportunities
- 05Pricing Analysis
- 5.1Capex per Operator MEC Node, 2020-2035
- 5.2Capex per Enterprise MEC Site, 2020-2035
- 5.3Recurring Spend per Installed Node and Site
- 06Standards and Regulation
- 6.1ETSI Multi-access Edge Computing
- 6.23GPP TS 23.558 Edge Application Architecture
- 6.3GSMA Open Gateway
- 6.4EU Digital Networks Act
- 07Supply Chain and Ecosystem
- 7.1Silicon and Accelerator Suppliers
- 7.2Network Equipment and MEC Platform Vendors
- 7.3Hyperscale Cloud Providers
- 7.4Operators and Tower Owners
- 08Market Size and Forecast
- 8.1Market Size, 2020-2035
- 8.2Operator MEC Nodes and Capex
- 8.3Enterprise MEC Sites and Capex
- 8.4Recurring Services and Edge Cloud Revenue
- 09Multi-Access Edge Computing Market, By Component
- 9.1Hardware
- 9.2Software
- 9.3Services
- 10Multi-Access Edge Computing Market, By Deployment
- 10.1Operator Network MEC
- 10.2Enterprise On-Premise MEC
- 10.3Hyperscaler-Operator Edge Zones
- 11Multi-Access Edge Computing Market, By Network Access
- 11.15G Standalone
- 11.25G Non-Standalone and LTE
- 11.3Fixed and Wi-Fi Access
- 12Multi-Access Edge Computing Market, By Application
- 12.1Video Analytics and Computer Vision
- 12.2Industrial Automation and Robotics
- 12.3Content Caching and Media Delivery
- 12.4Cloud Gaming, AR and VR
- 12.5Network APIs, Location and Other
- 12.6AI Inference and Generative AI
- 12.7Connected Vehicles and V2X
- 13Multi-Access Edge Computing Market, By End Use
- 13.1Manufacturing
- 13.2Media, Gaming and Entertainment
- 13.3Government, Energy and Others
- 13.4Transportation and Logistics
- 13.5Retail and Venues
- 13.6Automotive
- 13.7Healthcare
- 14DC Exclusive: Four-Layer MEC Build Model
- 14.1Deployment × End Use Matrix, 2025
- 14.2Model Inputs
- 15Multi-Access Edge Computing Market, By Region
- 15.1Asia Pacific: China, Japan, South Korea, India, Australia
- 15.2North America: United States, Canada
- 15.3Europe: Germany, United Kingdom, France
- 15.4Middle East and Africa: Saudi Arabia
- 15.5Latin America: Brazil
- 16Country Analysis
- 16.1Top 12 Countries, 2025 and 2035
- 16.2Fastest-Growing Countries
- 17Regional Cross-Sections
- 17.1Regional Shares, 2025 and 2035
- 17.2Share Shift by Region, 2025-2035
- 18Forecast Scenarios
- 18.1Low Scenario
- 18.2Base Scenario
- 18.3High Scenario
- 19Competitive Landscape
- 19.1Market Structure
- 19.2Supplier Positioning by Deployment Model
- 19.3Recent Developments
- 20Company Profiles
- 20.1Nokia
- 20.2Ericsson
- 20.3Samsung
- 20.4NVIDIA
- 20.5Amazon Web Services (AWS)
- 20.6Google Cloud
- 20.7Microsoft
- 20.8Verizon
- 20.9T-Mobile
- 20.10SK Telecom
- 20.11NTT DOCOMO
- 20.12SoftBank
- 20.13Deutsche Telekom
- 20.14Vodafone
- 20.15Crown Castle
- 20.16American Tower
- 20.17SBA Communications
- 21Analyst Recommendations
- 21.1For MEC Platform and Hardware Suppliers
- 21.2For Operators and Tower Owners
- 21.3For Enterprise Buyers
- Fig. 1Multi-Access Edge Computing Market Size, 2020-2035
- Fig. 2Market Share by Component, 2025 and 2035
- Fig. 3Market Share by Deployment, 2025 and 2035
- Fig. 4Market by Network Access, 2025 and 2035
- Fig. 5Market by Application, 2025 and 2035
- Fig. 6Market by End Use, 2025
- Fig. 7Market by Region, 2025 and 2035
- Fig. 8Top 12 Countries, 2025
- Fig. 9Forecast Scenarios, 2035
- Table 1Report Attributes
- Table 2MEC Pricing Indicators, 2020, 2025, 2030 and 2035
- Table 3Market by Component, 2025 and 2035
- Table 4Market by Deployment, 2025 and 2035
- Table 5Market by Network Access, 2025 and 2035
- Table 6Market by Application, 2025 and 2035
- Table 7Market by End Use, 2025 and 2035
- Table 8Deployment × End Use Matrix, 2025
- Table 9Market by Region, 2025 and 2035
- Table 10Top 12 Countries, 2025 and 2035
- Table 11Forecast Scenarios, 2035
- Table 12Recent Developments
About this report
Written by Amit Jain and reviewed by Deepti Agrawal, Senior Editor, Research. Figures are built top-down and bottom-up and reconciled before publication, with 2025 as the base year.
Read our methodologyHow we built this
- Historical period2020-2024
- Base year2025
- Forecast period2026-2035
- Sizing approachTop-down + bottom-up
Need more than the report?
Advisory on this market
Due diligence, site selection and market entry work, by the analysts who wrote this report.
See consulting servicesFrequently asked questions
USD 6.30 billion in 2025, rising to USD 30.62 billion by 2035. DC Market Insights estimates the market at USD 1.22 billion in 2020.
17.13% a year from 2025 to 2035. Growth was faster, at 38.87% a year, between 2020 and 2025 as operators moved MEC from trial sites to production nodes.
Operator network MEC, with USD 4.55 billion or 72.2% of 2025 value. Hyperscaler-operator edge zones grow fastest at 23.11% a year.
About USD 0.29 million for an operator MEC node and USD 0.33 million for an enterprise on-premise MEC site in 2025, according to DC Market Insights estimates that exclude radio equipment, site works and power.
Asia Pacific, with USD 2.81 billion or 44.6% of 2025 value. The Middle East and Africa grows fastest at 21.42% a year.
AI inference and generative AI, at 28.41% a year, from USD 620.00 million in 2025 to USD 7.56 billion by 2035, moving from the sixth-largest application to the largest.
About 8% of 2025 value at most for any single supplier, and about 30% for the five largest (DC Market Insights estimate). Nokia, Ericsson, Samsung, NVIDIA, AWS, Google Cloud, Microsoft, Verizon, T-Mobile, SK Telecom, NTT DOCOMO, SoftBank, Deutsche Telekom, Vodafone and the tower owners compete.
USD 1.60 billion in the United States, or 25.4% of 2025 spending, followed by China at USD 1.52 billion. India grows fastest among large country markets at 25.97% a year (DC Market Insights estimate).
Licences, delivery and payment
Which licence should I choose?
Single User is a view-only PDF for one person. Multi User adds a printable PDF and the Excel data for unlimited users at one location. Enterprise covers your whole company and includes 100 free analyst hours.
How and when will I receive the report?
By email, within 24–48 business hours of payment, in the formats of your licence.
How can I pay?
Securely through PayPal: with a PayPal account, a debit or credit card, or PayPal Pay Later where available. Prices are in US dollars.
Can I see a sample first?
Yes. Request a free sample and we will email it to you.
Can the report be tailored to my needs?
Yes. We can add countries, segments or data cuts. Talk to an analyst about the scope you need.
Can I get an invoice or pay against a purchase order?
Write to sales@dcmarketinsights.com and our team will help.