
Data Center Cooling Fan Market Size, Share & Forecast to 2035
Market at a glance
The Data Center Cooling Fan market was worth USD 2,730.0 million in 2025 and is forecast to reach USD 5,120.0 million by 2035, growing at a 17.37% CAGR.
 By Amit Jain, Senior Consultant, ICT & Emerging Technologies
 Reviewed by Deepti Agrawal
Last updated 21 Oct 2026
Base year 2025 PDF + Excel
What is inside the report
- 01Introduction
- 02Executive Summary
- 03Market Scope
- 04Why Market Estimates Differ
- 05Market Drivers
- 06Market Trends
- 07Market Challenges
- 08Market Opportunities
- 09Pricing Analysis
- 10Standards and Regulation
- 19chapters
- 2020-2024Historical period
- 2026-2035Forecast period
- —Companies profiled
Segmentation
Full analysis
The Data Center Cooling Fan Market is valued at USD 2.97 billion in 2026 and is projected to reach USD 5.12 billion by 2035, up from USD 2.73 billion in 2025, a CAGR of 6.50% from 2025 to 2035 (DC Market Insights estimate). What sets the pace here is a tug-of-war inside the AI rack: an air-cooled graphics processing unit (GPU) server carries about USD 90 of fans per kilowatt (kW), but a liquid-cooled rack such as NVIDIA’s GB200 NVL72 keeps only about USD 20 per kW of residual fans in its switch, power and compute trays. The fan makers’ own filings show how strong the first wave was: Asia Vital Components (AVC), a leading server fan and thermal supplier in Taiwan, reported 2025 revenue of NT$139.64 billion, up 94.58%, and the San Ace fan business of Sanyo Denki grew orders 29.6% in the year to March 2026 on generative AI equipment. DC Market Insights builds the 2025 figure from 31.4 gigawatts (GW) of server power shipped (new capacity plus refresh) times fan content per kW, giving USD 1,878.94 million of server and node fans, plus USD 850.20 million of facility fans in air handlers, heat rejection and racks. Heat rejection fans grow fastest of the applications at 11.04% a year as liquid loops move heat to dry coolers on the roof, and Asia Pacific is the fastest region at 7.80% a year, led by India.
Key Market Statistics: How Big Is the Data Center Cooling Fan Market in 2026?
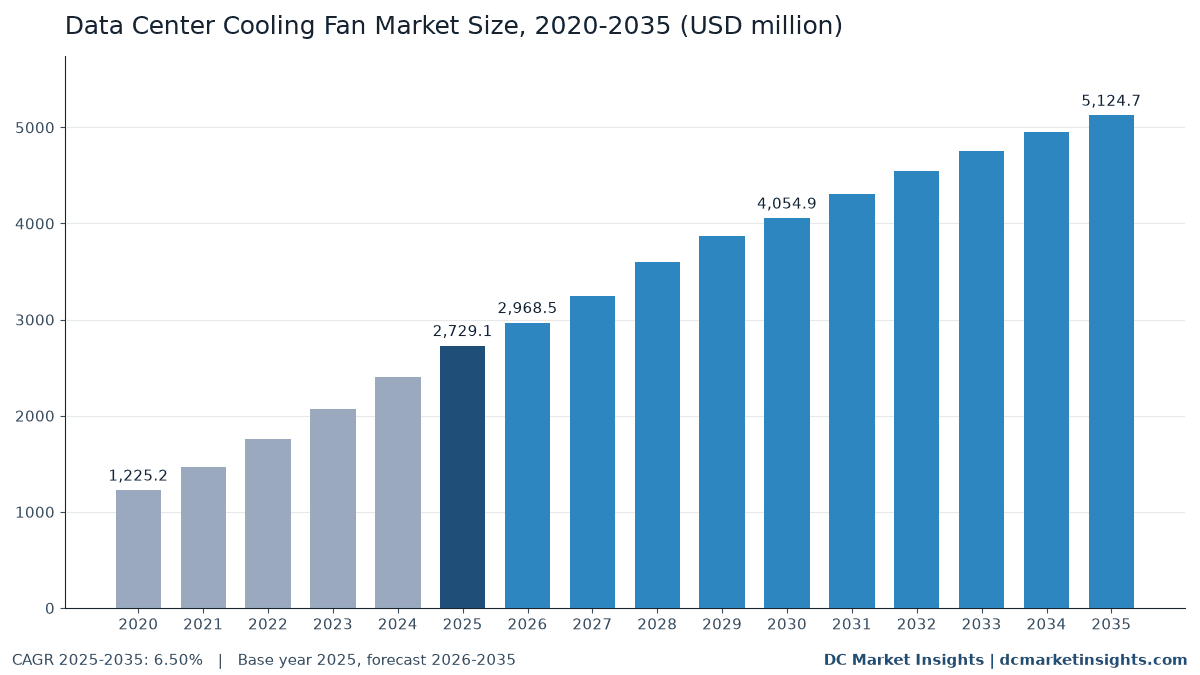
DC Market Insights values the Data Center Cooling Fan Market at USD 2.97 billion in 2026, 8.77% above the USD 2.73 billion of 2025.
- Market size 2025: USD 2.73 billion; 2026: USD 2.97 billion; 2030: USD 4.05 billion; 2035: USD 5.12 billion.
- CAGR 2025-2035: 6.50% in the base case; the 2035 range runs from USD 4.24 billion (low, 4.50%) to USD 6.17 billion (high, 8.50%).
- Fan content per kW of server power in 2025: about USD 55 for central processing unit (CPU) servers, USD 90 for air-cooled GPU servers and USD 20 for liquid-cooled AI racks (DC Market Insights estimate).
- Largest application: server and node fans, USD 1.88 billion or 68.8% of 2025 spend.
- Fastest application: heat rejection fans, from USD 274.00 million in 2025 to USD 780.60 million in 2035, 11.04% a year.
- Electronically commutated (EC) fans took USD 633.51 million in 2025 and grow 10.71% a year; AC induction fans shrink 0.62% a year.
- Leading region: North America, USD 1.09 billion (40.0%) in 2025; fastest region: Asia Pacific, 7.80% a year.
- Largest country: United States, USD 982.49 million in 2025; fastest large country: India, 12.27% a year.
- Market leaders: AVC, Delta Electronics, Nidec, Sunon and Sanyo Denki hold about 52% of 2025 spend (DC Market Insights estimate).
How Has Data Center Fan Spending Changed Since 2020?
The Global Data Center Cooling Fan Market size was valued at USD 1.23 billion in 2020, reached USD 2.73 billion in 2025, and is anticipated to reach USD 5.12 billion by 2035, at a CAGR of 6.50% during the forecast period.
| Attribute | Details |
|---|---|
| Historical period | 2020-2024 |
| Base year | 2025 |
| Forecast period | 2026-2035 |
| Market size 2025 | USD 2.73 billion |
| Market size 2026 | USD 2.97 billion |
| CAGR 2025-2035 | 6.50% |
| Market size 2035 | USD 5.12 billion |
| CAGR 2020-2025 | 17.37% |
Spending rose 2.23 times between 2020 and 2025, 17.37% a year, because server power shipped into data centers nearly doubled from 16.9 GW to 31.4 GW and the first wave of AI servers was air-cooled, with banks of high static-pressure fans in each 8-GPU chassis. The next ten years grow more slowly, 6.50% a year, because most new AI capacity is liquid-cooled: the liquid-cooled share of AI server power shipped rises from about 30% in 2025 to 85% in 2035 in the DC Market Insights model, so fan content per kW falls even as server power shipped climbs to 79.3 GW. Part of the money that leaves the server reappears in facility fans, which rise from USD 850.20 million to USD 2,078.05 million.
Which Fans Count in the Data Center Cooling Fan Market?
The market covers USD 2.73 billion of fans bought for data centers in 2025, from 40 mm server fans to large heat rejection fans, valued at the price paid by the server maker, cooling equipment maker or operator.
Included
- Server and node fans: DC brushless fans and fan modules in CPU servers, GPU and AI servers, storage and network switches, and residual fans in liquid-cooled trays.
- Air handling unit fans: EC plug fans and fan walls in computer room air handlers (CRAH), computer room air conditioners (CRAC) and air handling units.
- Heat rejection fans: axial fans in dry coolers, air-cooled condensers, adiabatic coolers and cooling towers serving data halls.
- Rack and rear-door fans: rear-door heat exchanger fans, in-row cooler fans and rack-mounted fan trays.
- Replacement fans and fan retrofits in the installed base.
Excluded
- Heat sinks, vapour chambers and cold plates, pumps and coolant distribution units (CDU), and the cooling unit itself beyond its fans.
- Fans sold inside power supply units, PC and consumer cooling fans, and general building ventilation outside the data hall.
How Do the Fan Segments Add Up?
Server and node fans (USD 1,878.94 million) plus air handling unit fans (USD 469.40 million), heat rejection fans (USD 274.00 million) and rack and rear-door fans (USD 106.80 million) equal the USD 2,729.14 million total for 2025, and every other split adds to the same total.
Why Do Data Center Cooling Fan Market Estimates Differ?
The USD 2.97 billion for 2026 is the DC Market Insights value of fans alone; estimates that count whole thermal modules, cooling units or all industrial fans sold to buildings come out several times larger.
Broader definitions add thermal modules (heat sinks and vapour chambers sold together with the fan), cold plates and CDUs for liquid cooling, the full price of CRAH and dry cooler units, PC cooling fans and industrial ventilation fans used outside the data hall. DC Market Insights keeps those out because the fan makers report them separately and because liquid cooling hardware is a different buyer decision. The in-scope buyer groups are hyperscale and AI campuses, colocation operators, enterprises, small and mid-sized edge operators and telecom sites.
| Element | In this estimate | Why |
|---|---|---|
| Server and node fans | Yes, USD 1,878.94 million in 2025 | Largest fan load in the data hall |
| Facility fans (air handling, heat rejection, rack) | Yes, USD 850.20 million in 2025 | Fan value inside cooling equipment |
| Thermal modules, heat sinks and cold plates | No | Separate component, reported apart by makers |
| CDUs and pumps | No | Liquid cooling hardware |
| PC, consumer and general ventilation fans | No | Not bought for data centers |
What Is Driving Data Center Fan Demand?
Three forces lifted data center fan spending from USD 1.23 billion in 2020 to USD 2.73 billion in 2025 and shape it to 2035: AI server builds, new European fan efficiency rules and tighter power usage effectiveness (PUE) limits.
Air-Cooled GPU Servers Nearly Doubled AVC’s Sales in 2025
Air-cooled GPU servers carry about USD 90 of fans per kW of server power against USD 55 in a CPU server, and about 7.7 GW of air-cooled AI server power shipped in 2025, worth USD 691.66 million in fans. The suppliers’ filings show the surge: AVC reported 2025 revenue of NT$139.64 billion, up 94.58% from NT$71.76 billion, which it attributed to higher customer demand, in its December 2025 monthly revenue filing on the Taiwan Stock Exchange Market Observation Post System. Sunon reported NT$18.68 billion, up 27.72%, in the same filing. Even a liquid-cooled rack keeps fans: Sunon said in December 2024 that one NVL72 AI rack needs more than 250 high-performance fans besides its cold plates.
EU Fan Ecodesign Rules Apply from 24 July 2026
The European Commission’s Regulation (EU) 2024/1834 replaced the 2011 fan rules for fans of 125 watts (W) to 500 kW and started to apply on 24 July 2026, with revised efficiency thresholds, part-load performance information and spare-part rules (European Commission, July 2026). The Commission expects 8 terawatt-hours (TWh) a year of savings by 2030 against the 2011 rules. For data centers this retires the last AC induction blower decks in Europe: DC Market Insights puts AC induction fans at USD 152.61 million in 2025, falling to USD 143.38 million by 2035, while EC fans grow 10.71% a year.
Germany Demands PUE 1.2 from New Data Centers from 1 July 2026
Section 11 of Germany’s Energy Efficiency Act (EnEfG) requires data centers that start operation from 1 July 2026 to reach a PUE of 1.2 or lower, and existing sites 1.5 from 1 July 2027 and 1.3 from 1 July 2030 (EnEfG Section 11). Fans are one of the largest adjustable loads inside that ratio: ZIEHL-ABEGG puts ventilation at about 15% of a data center’s energy use on average, and its EC fan wall retrofit case cut the fan rating from 165 kW to 140.4 kW and saved 29.8%. DC Market Insights counts USD 133.40 million of air handling fan replacement in 2025, rising to USD 373.20 million by 2035.
How Are Data Center Cooling Fans Changing?
Fan value is moving out of the server and onto the roof: heat rejection fans rise from 10.0% of spend in 2025 to 15.2% in 2035.
Liquid Loops Shift Fan Value to Dry Coolers
Liquid cooling still needs fans, only in a different place: the heat leaves through dry coolers and adiabatic coolers whose fans push outdoor air. The Lawrence Berkeley National Laboratory (LBNL) found that infrastructure fell from 36% of United States data center electricity in 2018 to 31% in 2024 as average PUE improved from 1.55 to 1.45, mainly because load moved to sites that liquid-cool AI servers (LBNL 2025 Update, June 2026). DC Market Insights puts heat rejection fan content at USD 18,000 per new MW in 2025, rising to USD 22,000 by 2035, so heat rejection fans grow from USD 274.00 million to USD 780.60 million.
Fan Walls Replace CRAC Blower Decks
Arrays of EC plug fans in a wall beside the data hall replace the single blowers of older CRAC units, because each fan can be throttled and swapped while the rest run. ebm-papst, with fiscal 2024/25 sales of EUR 2.098 billion, said demand rose sharply for cooling systems used in data centers, and ZIEHL-ABEGG reported 2025 turnover above EUR 1 billion with demand from AI data centers rising particularly fast. DC Market Insights values air handling unit fans at USD 469.40 million in 2025 and USD 994.20 million in 2035.
Fan Makers Become Liquid Cooling Suppliers
The largest fan makers now sell the hardware that reduces fan content in the server. Nidec trialled an in-row CDU at MC Digital Realty’s NRT12 site in Inzai, Japan from August 2025 and is focusing its small precision motor segment, with JPY 498.70 billion of sales in the year to March 2026, on product groups for AI data centers including water-cooling modules (Nidec, September 2026). Sunon showed five liquid cooling products at the OCP Global Summit in October 2026, and Auras Technology grew 2025 revenue 47.56% to NT$23.28 billion on AI server liquid cooling. Fans stay in their product lines as the residual-air part of each rack: DC Market Insights puts residual fans in liquid-cooled racks at USD 65.87 million in 2025 and USD 712.19 million in 2035.
What Holds Back Data Center Fan Spending?
Liquid cooling and import duties hold growth to 6.50% a year, below the 8.4% a year at which new IT capacity grows from 12.0 GW in 2025 to 27.0 GW in 2035.
Liquid-Cooled Racks Cut Server Fan Content from USD 90 to USD 20 per kW
Every GW of AI server power that moves from air to liquid removes about USD 70 million of server fan spend. NVIDIA’s GB200 NVL72 connects 36 Grace CPUs and 72 Blackwell GPUs in a liquid-cooled rack-scale design, and its successors keep the same layout. In the DC Market Insights model, air-cooled GPU server fans grow only from USD 691.66 million in 2025 to USD 769.80 million in 2035, 1.08% a year, while AI server power shipped grows almost fivefold.
A 25% United States Duty on Chinese Fans Since 2019
The Office of the United States Trade Representative (USTR) placed fans under tariff codes 8414.59.10, 8414.59.15 and 8414.59.65 on Section 301 List 3, with a 10% duty from 24 September 2018 rising to 25% on 1 January 2019. Fan makers answered with plants outside China: ZIEHL-ABEGG started a plant in Vietnam in early 2025, and ebm-papst committed EUR 36 million to a plant in India. The duty raises landed costs for operators that buy replacement fans directly, part of the USD 226.20 million replacement channel in 2025.
Where Is the New Fan Revenue to 2035?
The two largest new pools are heat rejection fans for liquid-cooled campuses and replacement fans for the installed base, worth USD 1,449.25 million together in 2035.
Heat Rejection Fans for AI Campuses: USD 274.00 million to USD 780.60 million
A 100 MW liquid-cooled AI hall needs about USD 3.20 million of heat rejection fans against USD 1.60 million in a CPU hall, because the dry coolers carry the whole load (DC Market Insights). Sanyo Denki designed its San Ace 200 9GA fan for heat exchangers cooling generative AI GPU servers, with about 36% lower power and a plan for 10,000 units a month (March 2025).
Replacement and Retrofit Fans: USD 226.20 million to USD 668.65 million
The installed base grows from 116 GW in 2025 to 311 GW in 2035, and EC fans in air handlers, dry coolers and rear doors wear out on a 10 to 15 year cycle. DC Market Insights puts replacement spend at about USD 1,950 per installed MW a year in 2025, which grows the channel 11.45% a year, the fastest of the sales channels. Retrofits that cut fan power by about 30%, as in ZIEHL-ABEGG’s case, pay back in about 2.5 years, short enough for operators facing Germany’s 2027 PUE limit.
What Do Data Center Fans Cost per kW and per MW?
In 2025 a data center buys about USD 55 of server fans per kW of CPU server power, USD 90 per kW of air-cooled GPU server power and USD 52,000 of facility fans per new MW (DC Market Insights estimates).
| Fan content | 2020 | 2025 | 2030 | 2035 |
|---|---|---|---|---|
| CPU server fans, USD per kW | 50 | 55 | 57 | 58 |
| Air-cooled GPU server fans, USD per kW | 72 | 90 | 96 | 98 |
| Liquid-cooled AI rack residual fans, USD per kW | 22 | 20 | 17 | 16 |
| Facility fans, USD per new MW | 44,000 | 52,000 | 53,000 | 52,200 |
| Facility replacement fans, USD per installed MW a year | 1,700 | 1,950 | 2,090 | 2,150 |
Server fan prices are set in contracts with server original design manufacturers (ODM), mostly in Taiwan, and rise with fan speed and static pressure, which is why GPU server fans cost more per kW. Facility fan prices track EC motor and copper costs. Public price anchors are scarce, so DC Market Insights checks these values against the makers’ revenue: Sanyo Denki’s San Ace cooling fan business reported JPY 40.83 billion of revenue in the year to March 2026, up 7.3%, with segment profit up 19.5%.
Which Standards and Rules Apply to Data Center Fans?
Five rules shape data center fan demand in 2026: the EU fan ecodesign regulation, EU data center reporting, Germany’s PUE limits, the ASHRAE energy standard and the United States Section 301 duty on fans.
- Regulation (EU) 2024/1834: ecodesign for fans of 125 W to 500 kW, replacing Regulation 327/2011, applying from 24 July 2026 (European Commission).
- Delegated Regulation (EU) 2024/1364: data centers of 500 kW of IT power or more report key performance indicators including PUE; 770 data centers, 36% of the EU total, reported in the first round (European Commission, July 2025).
- EnEfG Section 11: PUE of 1.2 or lower for German data centers starting operation from 1 July 2026; 1.5 from 1 July 2027 and 1.3 from 1 July 2030 for existing sites.
- ANSI/ASHRAE Standard 90.4-2025, Energy Standard for Data Centers, from the American Society of Heating, Refrigerating and Air-Conditioning Engineers (ASHRAE), which sets mechanical load limits that include fans.
- USTR Section 301 List 3: 25% additional duty since 1 January 2019 on fans under tariff codes 8414.59.10, 8414.59.15 and 8414.59.65 imported from China.
Which Data Center Fan Segment Is Largest?
Server and node fans are the largest application at USD 1,878.94 million in 2025, while heat rejection fans grow fastest at 11.04% a year.
By Application
Server and node fans keep the largest share to 2035 but fall from 68.8% to 59.5% of spend, while heat rejection and rack and rear-door fans each grow about 11% a year.
| Application | 2025 (USD million) | Share 2025 | 2035 (USD million) | CAGR 2025-2035 |
|---|---|---|---|---|
| Server and Node Fans | USD 1,878.94 million | 68.8% | USD 3,046.65 million | 4.95% |
| Air Handling Unit Fans | USD 469.40 million | 17.2% | USD 994.20 million | 7.79% |
| Heat Rejection Fans | USD 274.00 million | 10.0% | USD 780.60 million | 11.04% |
| Rack and Rear-Door Fans | USD 106.80 million | 3.9% | USD 303.25 million | 11.00% |
By Motor Technology
DC brushless fans, used in servers and racks, take 71.2% of 2025 spend; EC fans grow 10.71% a year as the EU rules and PUE limits retire AC induction fans.
| Motor technology | 2025 (USD million) | Share 2025 | 2035 (USD million) | CAGR 2025-2035 |
|---|---|---|---|---|
| DC Brushless Fans | USD 1,943.02 million | 71.2% | USD 3,228.60 million | 5.21% |
| EC Fans | USD 633.51 million | 23.2% | USD 1,752.72 million | 10.71% |
| AC Induction Fans | USD 152.61 million | 5.6% | USD 143.38 million | -0.62% |
By Sales Channel
Server OEMs and ODMs buy 68.8% of fans; replacement and aftermarket sales grow fastest at 11.45% a year.
| Sales channel | 2025 (USD million) | Share 2025 | 2035 (USD million) | CAGR 2025-2035 |
|---|---|---|---|---|
| Server OEM and ODM | USD 1,878.94 million | 68.8% | USD 3,046.65 million | 4.95% |
| Cooling Equipment OEM | USD 624.00 million | 22.9% | USD 1,409.40 million | 8.49% |
| Replacement and Aftermarket | USD 226.20 million | 8.3% | USD 668.65 million | 11.45% |
By Data Center Type
Hyperscale and AI campuses buy USD 1,228.11 million of fans in 2025 and USD 2,818.59 million in 2035, 8.66% a year, the fastest data center type.
| Data center type | 2025 (USD million) | Share 2025 | 2035 (USD million) | CAGR 2025-2035 |
|---|---|---|---|---|
| Hyperscale and AI Campuses | USD 1,228.11 million | 45.0% | USD 2,818.59 million | 8.66% |
| Colocation | USD 818.74 million | 30.0% | USD 1,486.16 million | 6.14% |
| Enterprise | USD 518.54 million | 19.0% | USD 614.96 million | 1.72% |
| Edge and Telecom | USD 163.75 million | 6.0% | USD 204.99 million | 2.27% |
Fan Bill Teardown: Three 100 MW Halls from USD 6.60 Million to USD 14.80 Million
This DC Market Insights model prices the fans in three 100 MW halls at 2025 prices from 12 inputs: an air-cooled GPU hall carries USD 14.80 million of fans, more than twice the USD 6.60 million of a liquid-cooled AI hall.
| Fan line, 100 MW of IT | CPU hall, air-cooled (USD million) | GPU hall, air-cooled (USD million) | AI hall, liquid-cooled (USD million) |
|---|---|---|---|
| Server and node fans | 5.50 | 9.00 | 2.00 |
| Air handling unit fans | 3.00 | 3.40 | 0.80 |
| Heat rejection fans | 1.60 | 1.70 | 3.20 |
| Rack and rear-door fans | 0.55 | 0.70 | 0.60 |
| Total fan bill | 10.65 | 14.80 | 6.60 |
The inputs are fan content per kW for the three server types (USD 55, 90 and 20) and nine facility fan values per MW for air handling, heat rejection and rack fans in each hall. Two results matter for buyers. First, the liquid-cooled AI hall moves 48% of its fan bill to heat rejection, so roof space, noise limits and dry cooler fan efficiency decide its cost. Second, server fans are bought again at every server refresh, about every five to six years, while facility fans last 10 to 15 years, so over a 15-year life the air-cooled GPU hall buys about USD 27 million of server fans against USD 6 million in the liquid-cooled hall.
Which Region Buys the Most Data Center Cooling Fans?
North America buys the most at USD 1,091.65 million (40.0%) in 2025, and Asia Pacific grows fastest at 7.80% a year to USD 1,793.65 million by 2035.
North America
North America grows from USD 1,091.65 million to USD 1,896.13 million, 5.68% a year. LBNL puts United States data center electricity at 192 TWh in 2024, 4.7% of the national total, and its reference case reaches 649 TWh in 2030; most of the new AI load is liquid-cooled, which holds fan growth below capacity growth.
Europe
Europe grows from USD 518.54 million to USD 871.20 million, 5.33% a year, with the highest share of EC fans because of Regulation 2024/1834 and Germany’s PUE limits; Germany is the largest European buyer at USD 103.71 million in 2025.
Asia Pacific
Asia Pacific grows from USD 846.03 million to USD 1,793.65 million, 7.80% a year, the fastest region. India is the fastest large country at 12.27% a year, and the region also hosts most fan production: Delta Electronics Thailand reported 2025 sales of THB 198.51 billion, up 20.3% on data center energy management, and added factories in India and Thailand.
Latin America
Latin America grows from USD 109.17 million to USD 230.61 million, 7.76% a year, led by Brazil and Mexico, where air-cooled colocation halls keep server fan content high.
Middle East and Africa
The Middle East and Africa grow from USD 163.75 million to USD 333.11 million, 7.36% a year; Saudi Arabia grows 9.33% a year, and hot climates raise heat rejection fan content per MW.
Which Countries Spend the Most on Data Center Cooling Fans?
The United States leads with USD 982.49 million in 2025, and India is the fastest large country at 12.27% a year.
| Rank | Country | Region | 2025 (USD million) | 2035 (USD million) | CAGR 2025-2035 |
|---|---|---|---|---|---|
| 1 | United States | North America | USD 982.49 million | USD 1,687.56 million | 5.56% |
| 2 | China | Asia Pacific | USD 338.41 million | USD 627.78 million | 6.37% |
| 3 | Japan | Asia Pacific | USD 118.44 million | USD 215.24 million | 6.16% |
| 4 | Canada | North America | USD 109.17 million | USD 208.57 million | 6.69% |
| 5 | Germany | Europe | USD 103.71 million | USD 174.24 million | 5.33% |
| 6 | United Kingdom | Europe | USD 93.34 million | USD 148.10 million | 4.72% |
| 7 | India | Asia Pacific | USD 84.60 million | USD 269.05 million | 12.27% |
| 8 | Australia | Asia Pacific | USD 76.14 million | USD 161.43 million | 7.80% |
| 9 | South Korea | Asia Pacific | USD 59.22 million | USD 125.56 million | 7.80% |
| 10 | France | Europe | USD 57.04 million | USD 95.83 million | 5.33% |
| 11 | Ireland | Europe | USD 51.85 million | USD 78.41 million | 4.22% |
| 12 | Saudi Arabia | Middle East and Africa | USD 40.94 million | USD 99.93 million | 9.33% |
What Could the Data Center Cooling Fan Market Reach by 2035?
The base case reaches USD 5.12 billion by 2035; the low case gives USD 4.24 billion and the high case USD 6.17 billion.
| Scenario | 2035 (USD million) | CAGR 2025-2035 | Assumption |
|---|---|---|---|
| Low | USD 4,238.27 million | 4.50% | Liquid cooling reaches 95% of AI server power by 2030 and capacity growth slows |
| Base | USD 5,124.70 million | 6.50% | Liquid share of AI server power 78% in 2030 and 85% in 2035 |
| High | USD 6,170.54 million | 8.50% | Air-cooled inference servers stay at half of AI power and EC retrofits speed up |
Who Are the Leading Data Center Fan Makers?
AVC, Delta Electronics, Nidec, Sunon and Sanyo Denki hold about 52% of 2025 spend (DC Market Insights estimate, based on their server fan positions and reported revenue), while ebm-papst and ZIEHL-ABEGG lead facility fans.
- Asia Vital Components (AVC)
- Delta Electronics
- Nidec
- Sunon
- Sanyo Denki (San Ace)
- ebm-papst
- ZIEHL-ABEGG
- MinebeaMitsumi
- Auras Technology
- Rosenberg Ventilatoren
- Multi-Wing
- Vertiv (fan walls and cooling units)
AVC reported 2025 revenue of NT$139.64 billion and Sunon NT$18.68 billion in their monthly filings. Delta Electronics reported 2025 revenue of NT$554.89 billion, up 31.8%, without a separate fan figure. Sanyo Denki’s San Ace business reported JPY 40.83 billion for the year to March 2026 and JPY 11.64 billion in the April to June 2026 quarter, saying demand for generative AI and network equipment was robust. Among facility fan makers, ebm-papst reported EUR 2.098 billion in fiscal 2024/25, and ZIEHL-ABEGG EUR 893 million in 2024 and more than EUR 1 billion in 2025.
What Changed for Data Center Fans Since 2025?
Six dated moves since March 2025 show fan makers adding capacity and liquid cooling products.
- In March 2025, Sanyo Denki launched the San Ace 200 9GA fan for heat exchangers cooling generative AI GPU servers (Source: Sanyo Denki).
- In July 2025, ebm-papst announced EUR 36 million for a plant in India and EUR 30 million each for China and Romania (Source: ebm-papst).
- In August 2025, Nidec began an in-row CDU trial at MC Digital Realty’s NRT12 data center in Inzai, Japan (Source: Nidec).
- In January 2026, AVC reported 2025 revenue up 94.58% to NT$139.64 billion (Source: Taiwan Stock Exchange filing).
- In June 2026, ZIEHL-ABEGG added EUR 90 million for machinery and capacity in Europe, the United States and Asia (Source: ZIEHL-ABEGG).
- In July 2026, the EU fan ecodesign rules of Regulation 2024/1834 started to apply (Source: European Commission).
Analyst Takeaways: What Should Data Center Buyers Plan For?
Plan about USD 52,000 of facility fans per new MW in 2025, and expect the server fan bill to fall by about USD 70,000 per MW when an AI hall moves from air to liquid.
- USD 14.80 million versus USD 6.60 million: the fan bill of a 100 MW air-cooled GPU hall against a liquid-cooled AI hall.
- 15.2% of spend by 2035: heat rejection fans, so specify dry cooler fan efficiency and noise early.
- 2.5 years: the payback of an EC fan wall retrofit that cut fan power by about 30%.
- USD 668.65 million by 2035: replacement fans, the fastest channel at 11.45% a year.
Methodology: How Did DC Market Insights Size the Data Center Cooling Fan Market?
DC Market Insights built the Data Center Cooling Fan Market bottom-up from server power shipped and data center capacity, giving USD 2.73 billion for 2025 from 14 model inputs.
Server power shipped equals new IT capacity (12.0 GW in 2025, 22.0 GW in 2030, 27.0 GW in 2035) plus 18% of the prior year’s installed IT capacity for server refresh: 31.4 GW in 2025. The AI share (35%, 60%, 66%) is split into air-cooled and liquid-cooled power (liquid 30% in 2025, 78% in 2030, 85% in 2035), and each part is multiplied by its fan content per kW: USD 1,878.94 million of server and node fans. Facility fans equal new IT capacity times USD 52,000 per MW plus installed IT capacity (116 GW in 2025, 311 GW in 2035) times USD 1,950 per MW a year for replacement: USD 850.20 million. Segment, region and country shares are applied to the components and the total, and every split sums to it.
Three bound checks hold. Ceiling one: AVC, Sunon and Auras Technology alone reported NT$181.60 billion of 2025 revenue, about USD 5.7 billion at roughly NT$32 per US dollar, more than twice the USD 2.73 billion base, and most of their sales are thermal modules and liquid cooling rather than fans. Ceiling two: facility fans of USD 850.20 million equal about 13.5% of the USD 6.29 billion that DC Market Insights puts on precision air conditioning, dry coolers and rear-door heat exchangers in 2025, inside a 10% to 25% fan share of such units. Floor: USD 40 per kW of server power shipped plus USD 30,000 per new MW of facility fans gives about USD 1.61 billion, below the base. Related values sit in the Data Center Thermal Management Market, the Data Center Precision Air Conditioning Market, the Data Center Dry Cooler Market and the Data Center Rear Door Heat Exchanger Market. The full method is described on the DC Market Insights research methodology page.
Table of contents
- 01Introduction
- 1.1Report Description
- 1.2Key Market Statistics, 2025, 2026, 2030 and 2035
- 02Executive Summary
- 2.1Market Snapshot, 2025, 2026 and 2035
- 2.2Market Size Chart, 2020-2035
- 03Market Scope
- 3.1Included
- 3.2Excluded
- 3.3How Do the Fan Segments Add Up?
- 04Why Market Estimates Differ
- 4.1Scope Table: In and Out of This Estimate
- 05Market Drivers
- 5.1Air-Cooled GPU Servers Nearly Doubled AVC's Sales in 2025
- 5.2EU Fan Ecodesign Rules Apply from 24 July 2026
- 5.3Germany Demands PUE 1.2 from New Data Centers from 1 July 2026
- 06Market Trends
- 6.1Liquid Loops Shift Fan Value to Dry Coolers
- 6.2Fan Walls Replace CRAC Blower Decks
- 6.3Fan Makers Become Liquid Cooling Suppliers
- 07Market Challenges
- 7.1Liquid-Cooled Racks Cut Server Fan Content from USD 90 to USD 20 per kW
- 7.2A 25% United States Duty on Chinese Fans Since 2019
- 08Market Opportunities
- 8.1Heat Rejection Fans for AI Campuses: USD 274.00 million to USD 780.60 million
- 8.2Replacement and Retrofit Fans: USD 226.20 million to USD 668.65 million
- 09Pricing Analysis
- 9.1Fan Content per kW and per MW, 2020-2035
- 9.2Server ODM Contract Pricing
- 10Standards and Regulation
- 10.1Regulation (EU) 2024/1834 on Fans
- 10.2Delegated Regulation (EU) 2024/1364
- 10.3EnEfG Section 11 PUE Limits
- 10.4ANSI/ASHRAE Standard 90.4-2025
- 10.5USTR Section 301 List 3 Duty on Fans
- 11Market Segmentation
- 11.1By Application
- 11.2Server and Node Fans
- 11.3Air Handling Unit Fans
- 11.4Heat Rejection Fans
- 11.5Rack and Rear-Door Fans
- 11.6By Motor Technology
- 11.7DC Brushless Fans
- 11.8EC Fans
- 11.9AC Induction Fans
- 11.10By Sales Channel
- 11.11Server OEM and ODM
- 11.12Cooling Equipment OEM
- 11.13Replacement and Aftermarket
- 11.14By Data Center Type
- 11.15Hyperscale and AI Campuses
- 11.16Colocation
- 11.17Enterprise
- 11.18Edge and Telecom
- 12DC Exclusive: Fan Bill Teardown of Three 100 MW Halls
- 12.1CPU Hall, Air-Cooled: USD 10.65 Million
- 12.2GPU Hall, Air-Cooled: USD 14.80 Million
- 12.3AI Hall, Liquid-Cooled: USD 6.60 Million
- 12.4Server Fan Refresh over a 15-Year Life
- 13Regional Insights
- 13.1North America
- 13.2Europe
- 13.3Asia Pacific
- 13.4Latin America
- 13.5Middle East and Africa
- 14Country Analysis
- 14.1United States
- 14.2China
- 14.3Japan
- 14.4Canada
- 14.5Germany
- 14.6United Kingdom
- 14.7India
- 14.8Australia
- 14.9South Korea
- 14.10France
- 14.11Ireland
- 14.12Saudi Arabia
- 15Forecast Scenarios, 2035
- 15.1Low Scenario
- 15.2Base Scenario
- 15.3High Scenario
- 16Competitive Insights
- 16.1Asia Vital Components (AVC)
- 16.2Delta Electronics
- 16.3Nidec
- 16.4Sunon
- 16.5Sanyo Denki (San Ace)
- 16.6ebm-papst
- 16.7ZIEHL-ABEGG
- 16.8MinebeaMitsumi
- 16.9Auras Technology
- 16.10Rosenberg Ventilatoren
- 16.11Multi-Wing
- 16.12Vertiv (fan walls and cooling units)
- 17Recent Developments
- 17.1Sanyo Denki San Ace 200 9GA, March 2025
- 17.2ebm-papst Plant Investments, July 2025
- 17.3Nidec In-Row CDU Trial, August 2025
- 17.4AVC 2025 Revenue, January 2026
- 17.5ZIEHL-ABEGG Capacity Investment, June 2026
- 17.6EU Fan Rules Apply, July 2026
- 18Analyst Takeaways
- 18.1Fan Bill per 100 MW Hall
- 18.2Heat Rejection Share by 2035
- 18.3EC Fan Wall Retrofit Payback
- 18.4Replacement Fans to 2035
- 19Research Methodology
- 19.1Model Inputs
- 19.2Bound Checks
- Fig. 1Data Center Cooling Fan Market Size, 2020-2035 (USD million)
- Table 1Market Snapshot, 2025, 2026 and 2035
- Table 2Scope Table: In and Out of This Estimate
- Table 3Fan Content per kW and per MW, 2020-2035
- Table 4Market by Application, 2025 and 2035
- Table 5Market by Motor Technology, 2025 and 2035
- Table 6Market by Sales Channel, 2025 and 2035
- Table 7Market by Data Center Type, 2025 and 2035
- Table 8Fan Bill Teardown of Three 100 MW Halls
- Table 9Top 12 Countries, 2025 and 2035
- Table 102035 Forecast Scenarios
About this report
Written by Amit Jain and reviewed by Deepti Agrawal, Senior Editor, Research. Figures are built top-down and bottom-up and reconciled before publication, with 2025 as the base year.
Read our methodologyHow we built this
- Historical period2020-2024
- Base year2025
- Forecast period2026-2035
- Sizing approachTop-down + bottom-up
Need more than the report?
Advisory on this market
Due diligence, site selection and market entry work, by the analysts who wrote this report.
See consulting servicesFrequently asked questions
USD 2.97 billion in 2026, up 8.77% from USD 2.73 billion in 2025, according to DC Market Insights estimates. The market is projected to reach USD 5.12 billion by 2035, a CAGR of 6.50% from 2025.
6.50% a year from 2025 to 2035, after 17.37% a year from 2020 to 2025, because liquid-cooled AI racks carry about USD 20 of fans per kW against USD 90 in an air-cooled GPU server.
Even a liquid-cooled NVL72 rack needs more than 250 high-performance fans besides its cold plates, according to Sunon. DC Market Insights puts residual fan content at about USD 20 per kW, against USD 90 per kW in an air-cooled GPU server.
Yes inside the server, by about USD 70,000 per MW, but heat rejection fans on dry coolers grow from USD 274.00 million in 2025 to USD 780.60 million in 2035, 11.04% a year (DC Market Insights).
Server and node fans, with USD 1,878.94 million or 68.8% of 2025 spend. Air handling unit fans follow with USD 469.40 million.
Regulation (EU) 2024/1834 applies from 24 July 2026 to fans of 125 W to 500 kW, with revised efficiency thresholds and spare-part rules. It speeds the switch to EC fans, which grow 10.71% a year to 2035.
About USD 52,000 of facility fans per new MW in 2025, plus server fans of USD 55 per kW in CPU servers and USD 90 per kW in air-cooled GPU servers (DC Market Insights estimates).
North America, with USD 1,091.65 million or 40.0% of 2025 spend. Asia Pacific grows fastest at 7.80% a year, and India is the fastest large country at 12.27% a year.
AVC, Delta Electronics, Nidec, Sunon and Sanyo Denki hold about 52% of 2025 spend (DC Market Insights estimate). AVC reported 2025 revenue of NT$139.64 billion, up 94.58%.
USD 2.97 billion in 2026 is the DC Market Insights value of fans alone. Estimates that add thermal modules, cold plates, CDUs, whole cooling units or PC fans come out several times larger.
Licences, delivery and payment
Which licence should I choose?
Single User is a view-only PDF for one person. Multi User adds a printable PDF and the Excel data for unlimited users at one location. Enterprise covers your whole company and includes 100 free analyst hours.
How and when will I receive the report?
By email, within 24–48 business hours of payment, in the formats of your licence.
How can I pay?
Securely through PayPal: with a PayPal account, a debit or credit card, or PayPal Pay Later where available. Prices are in US dollars.
Can I see a sample first?
Yes. Request a free sample and we will email it to you.
Can the report be tailored to my needs?
Yes. We can add countries, segments or data cuts. Talk to an analyst about the scope you need.
Can I get an invoice or pay against a purchase order?
Write to sales@dcmarketinsights.com and our team will help.