
Data Center Microgrid Market Size, Share & Forecast to 2035
Market at a glance
The Data Center Microgrid market was worth USD 648.1 million in 2025 and is forecast to reach USD 3,120.0 million by 2035, growing at a 17.01% CAGR.
 By Amit Jain, Senior Consultant, ICT & Emerging Technologies
 Reviewed by Deepti Agrawal
Last updated 18 Oct 2026
Base year 2025 PDF + Excel
Key findings
Air Permits for the Generators Set the Microgrid Timeline
What is inside the report
- 01Introduction
- 02Research Methodology
- 03Executive Summary
- 04What Is a Data Center Microgrid?
- 05Why Do Data Center Microgrid Market Estimates Differ?
- 06Market Drivers
- 07Market Trends
- 08Market Restraints
- 09Market Opportunities
- 10Pricing Analysis: Data Center Microgrid Cost per kW
- 21chapters
- 2020-2024Historical period
- 2026-2035Forecast period
- —Companies profiled
Segmentation
Recent developments
Schneider Electric opened a microgrid testing lab at its Andover, Massachusetts, research centre (Source: Schneider Electric).
Caterpillar agreed to supply 4 GW of generation and 1.1 GWh of batteries for Joule Capital Partners' Utah campus (Source: Caterpillar).
VoltaGrid agreed to deploy 2.3 GW of modular gas generation for Oracle data centers in Texas (Source: VoltaGrid).
the CRU published its final connection policy requiring onsite or proximate dispatchable capacity for large data centres (Source: CRU).
Pure DC and AVK started a 110 MW islanded microgrid at a Dublin data centre campus (Source: Pure DC).
Oracle and Bloom Energy announced up to 2.45 GW of fuel cells for a New Mexico campus (Source: Oracle and Bloom Energy).
Veolia was selected to operate a 350 MW grid-independent microgrid for an AI data center campus in Ohio (Source: Veolia).
Full analysis
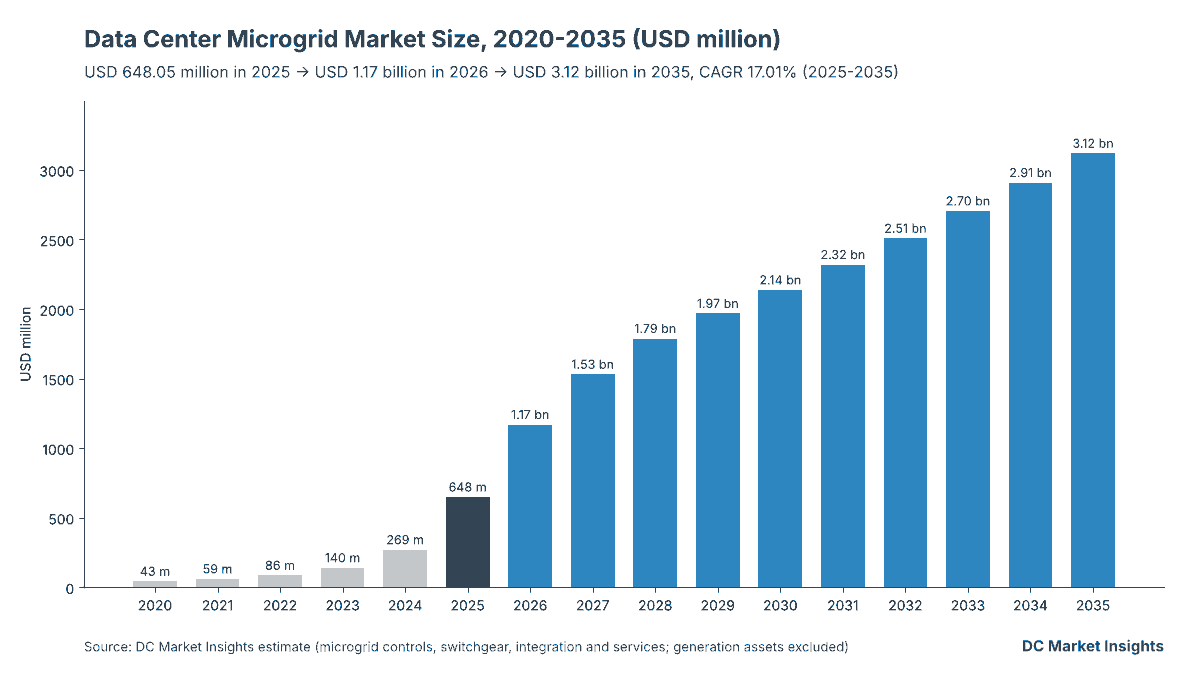
The Data Center Microgrid Market is valued at USD 1.17 billion in 2026 and is projected to reach USD 3.12 billion by 2035, up from USD 648.05 million in 2025, a compound annual growth rate (CAGR) of 17.01% from 2025 to 2035 (DC Market Insights estimate). What a buyer pays for here is not the generator but the layer that lets a campus run without the utility: the microgrid controller, the islanding switchgear and protection, and the engineering that ties engines, turbines, fuel cells and batteries into one plant. That layer became a purchase decision of its own in 2025 and 2026, when sites such as the 350 megawatt (MW) grid-independent campus in New Albany, Ohio, that Veolia was hired to operate in July 2026 and the 110 MW Pure DC campus in Dublin, which started as a fully islanded microgrid in March 2026, were designed from day one to run with no grid connection. DC Market Insights counts 2,000 MW of islanded and bridge-to-grid microgrid capacity commissioned at data centers in 2025 at USD 260 per kilowatt (kW) for the microgrid layer, rising to 3,600 MW in 2026. Operations and optimisation services are the fastest-growing component at 34.84% a year, and Asia Pacific is the fastest-growing region at 26.18% a year.
Key Market Statistics: How Big Is the Data Center Microgrid Market in 2026?
DC Market Insights values the Data Center Microgrid Market at USD 1.17 billion in 2026, 80.4% above 2025, as islanded campuses ordered in 2025 reach commissioning.
- Market size 2025: USD 648.05 million
- Market size 2026: USD 1.17 billion
- Market size 2030: USD 2.14 billion
- Market size 2035: USD 3.12 billion
- CAGR 2025-2035: 17.01% in the base case, 13.70% in the low case and 19.52% in the high case
- Islanded and bridge-to-grid microgrid capacity commissioned at data centers: 2,000 MW in 2025, 5,300 MW in 2030 and 6,300 MW in 2035
- Largest component: switchgear, protection and islanding equipment, 41.6% of 2025 value (USD 269.64 million)
- Fastest-growing component: operations and optimisation services, 34.84% a year
- Leading region: North America, 74.0% of 2025 value (USD 479.56 million)
- Fastest-growing region: Asia Pacific, 26.18% a year
- Largest country: the United States, USD 453.63 million in 2025 (70.0% of global value)
- Market leader: Schneider Electric, about 12% of 2025 value (DC Market Insights assessment)
Executive Summary
The Global Data Center Microgrid Market size was valued at USD 42.75 million in 2020, reached USD 648.05 million in 2025, and is anticipated to reach USD 3.12 billion by 2035, at a CAGR of 17.01% during the forecast period.
| Report attribute | Details |
|---|---|
| Historical Period | 2020-2024 |
| Base Year | 2025 |
| Forecast Period | 2026-2035 |
| Data Center Microgrid Market Size 2025 | USD 648.05 Million |
| Data Center Microgrid Market Size 2026 | USD 1.17 Billion |
| Data Center Microgrid Market, CAGR | 17.01% |
| Data Center Microgrid Market Size 2035 | USD 3.12 Billion |
Data center microgrid spending grew 72.24% a year from 2020 to 2025, because the work moved from a few resilience projects of 10 to 100 MW, such as the 100 MW renewable natural gas microgrid planned for a Microsoft data center in San Jose in 2022, to multi-gigawatt campuses that must island from the first day. Growth of 17.01% a year to 2035 rests on three model inputs: islanded and bridge-to-grid capacity commissioned each year rises from 2,000 MW to 6,300 MW; grid-parallel resilience microgrids grow from 6% to 20% of new data center IT capacity, or from 720 MW to 5,400 MW a year; and the installed microgrid base grows from 6,709 MW at the end of 2025 to 84,844 MW in 2035, which lifts operations and optimisation services from 7.5% to 31.1% of the market.
Key Takeaways
- The market almost quintuples, to USD 3.12 billion by 2035, because grid waits of three to ten years turn the controller and the islanding switchgear into the first package an AI campus buys.
- Switchgear, protection and islanding equipment stays the largest component at 41.6% of 2025 value, because every islanded plant needs medium-voltage breakers that can separate and resynchronise the campus.
- Operations and optimisation services grow 34.84% a year, because each grid-independent campus needs a round-the-clock crew, such as the 35 to 40 staff Veolia plans in Ohio.
- Grid-parallel resilience microgrids rise from 16.1% to 30.8% of value, because rules in Ireland and Texas now ask large data centers to bring dispatchable onsite capacity even when they are grid-connected.
What Is a Data Center Microgrid, and Which Spending Does This Market Count?
A data center microgrid is a set of onsite generators, batteries and loads that one controller can run as a single system, with or without the utility grid, and DC Market Insights values its control, protection, integration and operating layer at USD 648.05 million in 2025.
Included. Microgrid controllers and energy management software (dispatch, load sharing, black start and grid-services logic); switchgear, protection and islanding equipment (point-of-common-coupling breakers, paralleling and generator switchgear, protective relays and synchronising equipment); engineering, integration and commissioning of the microgrid as one plant; and operations and optimisation services for the microgrid, including microgrid-as-a-service operating fees net of the generation assets. Both islanded and bridge-to-grid microgrids for off-grid AI campuses and grid-parallel resilience microgrids that can island during an outage are covered, at hyperscale, colocation, enterprise and edge data centers.
Excluded. The generation assets themselves (covered in the Data Center Gas Turbine Market, the Data Center Fuel Cell Market and the Data Center Generator Market), battery cells and their power conversion systems (covered in the Data Center Energy Storage Market), uninterruptible power supply (UPS) systems inside the data hall, fuel, electricity sold under power purchase agreements, and utility grid works outside the campus fence.
How the segments fit together. Every segment table splits the same USD 648.05 million of 2025 value: by component, by grid mode, by primary power source and by data center type, plus five regions and 12 countries. Each split sums to the total in every year from 2020 to 2035.
Why Do Data Center Microgrid Market Estimates Differ?
Data center microgrid estimates differ mainly because some count the generators and batteries inside the microgrid, while DC Market Insights counts USD 1.17 billion of 2026 spending on the microgrid layer that ties those assets together.
Broader definitions add three things. First, the full installed cost of gas engines, gas turbines, fuel cells, solar and batteries, which a National Renewable Energy Laboratory (NREL) cost study puts at a mean of USD 3.34 million per MW for campus microgrids and USD 4.08 million per MW for commercial and industrial microgrids; adding these assets would multiply the figure about eight to fifteen times and count the same equipment twice across the sibling reports. Second, standby diesel generators and UPS systems that never run in island mode with a controller. Third, the value of electricity and fuel over the life of a microgrid-as-a-service contract. DC Market Insights keeps these out so that the figure measures what a data center operator spends to turn separate power assets into a controllable microgrid.
| Element | In this market? | Why |
|---|---|---|
| Microgrid controllers and energy management software | Yes (USD 119.84 million in 2025) | Runs the assets as one plant |
| Switchgear, protection and islanding equipment | Yes (USD 269.64 million in 2025) | Separates and reconnects the campus |
| Engineering, integration and commissioning | Yes (USD 209.72 million in 2025) | Builds the microgrid as a system |
| Operations and optimisation services | Yes (USD 48.85 million in 2025) | Operates the microgrid |
| Gas engines, turbines, fuel cells and batteries | No | Sized in sibling reports |
| Fuel and electricity sales | No | Operating cost, not microgrid equipment |
Buyers inside the scope include hyperscale cloud operators, AI cloud developers, colocation providers, enterprise and edge operators, and independent power producers that build and operate a microgrid for one campus under a microgrid-as-a-service contract. Generation hardware, battery cells, standby diesel generators, fuel supply and power purchase agreements stay outside the scope in every table.
What Is Pushing Data Centers to Build Their Own Microgrids?
Grid connection limits push data centers toward microgrids, and DC Market Insights expects 25,600 MW of islanded and bridge-to-grid data center microgrid capacity to be commissioned from 2025 to 2030 as a result.
Ireland Ties New Grid Connections to Onsite Dispatchable Capacity
The Commission for Regulation of Utilities (CRU) published its final large energy users connection policy in December 2025, according to a William Fry summary of the decision: data centres above 10 megavolt-amperes (MVA) must bring new onsite or proximate dispatchable generation or storage, separately connected and metered, and must take part in the wholesale Single Electricity Market, while 80% of annual demand must be met by additional Irish renewable electricity within six years of energisation. Pure DC started its 110 MW Dublin campus as a fully islanded microgrid in March 2026, with three combined heat and power energy centres of up to 30 MW each and 20 MW of battery capacity, according to its announcement with AVK. DC Market Insights ranks Ireland second among countries, at USD 25.92 million in 2025, because of these rules.
Texas and Federal Rules Make Islanding Part of Large-Load Planning
Texas Senate Bill 6 set a 75 MW threshold for large loads and lets the Electric Reliability Council of Texas (ERCOT) direct them to run onsite backup generation or curtail during emergencies, according to the official Senate bill analysis of August 2025. The US Environmental Protection Agency (EPA) issued permitting guidance for islanded power generation facilities at data centers in July 2026, and the Federal Energy Regulatory Commission (FERC) found the co-location tariff of PJM Interconnection unjust and unreasonable in December 2025 and proposed two new transmission services for co-located loads. DC Market Insights links grid-parallel resilience microgrids, 16.1% of 2025 value or USD 104.28 million, to these rules.
Multi-Gigawatt Campuses Are Designed Around One Controller
Onsite plants for AI campuses are now ordered as integrated systems rather than as separate generators. Caterpillar said in August 2025 that it would supply 4 gigawatts (GW) of generation and 1.1 gigawatt-hours (GWh) of grid-forming batteries, with controls and switchgear, for Joule Capital Partners’ campus in central Utah. VoltaGrid agreed in October 2025 to deploy 2.3 GW of modular natural gas generation for Oracle Cloud Infrastructure in Texas, using INNIO Jenbacher engines with ABB automation, according to POWER magazine. DC Market Insights counts 9,310 MW of such named microgrid projects in its DC Exclusive teardown below.
How Are Data Center Microgrid Designs Changing?
Data center microgrids are moving from backup schemes to primary power plants, and DC Market Insights expects islanded and bridge-to-grid designs to hold 69.2% of value in 2035, down from 83.9% in 2025 as grid-parallel designs catch up.
Fully Grid-Independent Campuses Move from Pilot to Contract
Veolia said on 30 July 2026 that it would operate and maintain a 350 MW microgrid with 430 megawatt-hours (MWh) of batteries that provides 100% of the power for an AI data center campus in New Albany, Ohio, without relying on the grid, with a 99.9% availability target. Oracle and Bloom Energy said in April 2026 that they would install up to 2.45 GW of solid oxide fuel cells for a New Mexico campus, targeting 99.999% uptime. DC Market Insights models islanded and bridge-to-grid capacity at 3,600 MW in 2026, up from 2,000 MW in 2025.
Bridge-to-Grid Plants Become Flexible Grid Resources Later
Enchanted Rock described its bridge-to-grid model in May 2024: the microgrid supplies prime power while the grid connection is delayed, and once the connection arrives it provides flexible capacity at peak times, according to POWER Engineering. The International Energy Agency (IEA) said in April 2026 that onsite generation is typically overbuilt by 30% to 70% relative to demand, which leaves headroom for grid services. DC Market Insights therefore keeps operations and optimisation services rising after the islanded build peaks, from USD 48.85 million in 2025 to USD 970.27 million in 2035.
Microgrid Controllers Are Tested in Vendor Labs Before Site Work
Schneider Electric opened a microgrid testing lab at its research centre in Andover, Massachusetts, in February 2025, with four 90 kW grid simulators and three 45 kW solar simulators to test fully functioning microgrids, according to its company release. Factory and lab testing shortens commissioning, which is why DC Market Insights holds engineering, integration and commissioning at 35% of the hardware-and-integration layer rather than the higher soft-cost shares seen in small microgrids.
Market Restraints: What Slows Data Center Microgrid Spending?
Two restraints slow the market: fuel and emissions permits for the generators behind the microgrid, and the falling cost per kW of control at gigawatt scale, which keeps the layer at about USD 245 per kW in 2035.
Air Permits for the Generators Set the Microgrid Timeline
A microgrid controller cannot be commissioned before the engines, turbines or fuel cells it runs hold their permits. In the United States, state and local agencies issue most air permits for data center generation, and new combustion turbines have faced tighter nitrogen oxide limits since January 2026. DC Market Insights reflects this in the low case, which cuts islanded capacity by 25% from 2027 and gives USD 2.34 billion in 2035.
Controller Cost per kW Falls as Plants Grow
NREL found that microgrid controller costs range from USD 6,200 to USD 470,000 per MW, with a mean of USD 155,000 per MW, and a median of 7% of total project cost, in a study of mostly small microgrids. At campus scale the same controller covers hundreds of MW, so DC Market Insights uses USD 52 per kW for controls and energy management software in 2025, one third of the NREL mean, and lets the full microgrid layer slip from USD 270 per kW in 2027 to USD 245 per kW in 2035.
Where Are the Openings for Data Center Microgrid Suppliers?
The two largest openings are operating contracts on a growing installed base and retrofits that turn standby generator plants into grid-parallel microgrids, together worth USD 1.58 billion in 2035.
Operating Contracts on a Base of Almost 85 GW
Operations and optimisation services rise from USD 48.85 million in 2025 to USD 970.27 million in 2035, because the installed data center microgrid base grows from 6,709 MW to 84,844 MW at USD 12 to USD 13 per kW-year. Veolia’s Ohio contract, with 35 to 40 full-time staff for 350 MW, shows that operators of grid-independent campuses buy the operating crew and the performance guarantee together.
Grid-Parallel Microgrids for Colocation and Enterprise Sites
Grid-parallel microgrid hardware and integration grows 22.54% a year, from USD 79.20 million in 2025 to USD 604.80 million in 2035 (DC Market Insights estimate). The share of new data center IT capacity built with these microgrids rises from 6% in 2025 to 14% in 2030 and 20% in 2035, as colocation and enterprise operators add microgrid controllers to standby plants so that they can earn grid-services revenue and meet connection rules.
How Much Does a Data Center Microgrid Cost per kW?
The microgrid layer of an islanded data center campus costs about USD 260 per kW in 2025, and the layer of a grid-parallel resilience microgrid about USD 110 per kW (DC Market Insights estimates, generation assets excluded).
| Price | 2020 | 2025 | 2030 | 2035 |
|---|---|---|---|---|
| Islanded and bridge-to-grid layer (USD per kW) | 240 | 260 | 260 | 245 |
| Grid-parallel resilience layer (USD per kW) | 95 | 110 | 115 | 112 |
| Operations and optimisation (USD per kW-year) | 10 | 12 | 13 | 13 |
Public anchors come from the NREL Phase I Microgrid Cost Study of October 2018: mean total costs of USD 3.34 million per MW for campus and institutional microgrids, USD 4.08 million per MW for commercial and industrial microgrids and USD 2.55 million per MW for utility microgrids, with additional electrical infrastructure at 1% to 38% of cost. The islanded layer of USD 260 per kW equals 13.7% of the USD 1,900 per kW installed price that DC Market Insights uses for data center gas turbines in 2025.
Which Standards and Rules Apply to Data Center Microgrids?
Five sets of rules shape the USD 648.05 million spent in 2025: controller standards, interconnection standards, electrical codes, connection policies and air permits.
- IEEE 2030.7 and IEEE 2030.8. The Institute of Electrical and Electronics Engineers (IEEE) standards that specify microgrid controller functions and how to test them, used in controller tenders.
- IEEE 1547. The interconnection standard for distributed energy resources that decides how a grid-parallel microgrid separates from and reconnects to the utility.
- NFPA 70, National Electrical Code (NEC). The National Fire Protection Association code whose Article 705 covers interconnected power production sources and microgrid systems in the United States.
- Ireland CRU large energy users connection policy. The December 2025 decision that ties new data centre connections to onsite or proximate dispatchable generation or storage.
- Texas Senate Bill 6 and EPA islanded guidance. The 2025 Texas large-load rules and the EPA permitting guidance of July 2026 for islanded power generation facilities.
Which Microgrid Components and Designs Lead Data Center Spending?
Switchgear, protection and islanding equipment leads components with 41.6% of 2025 value, and islanded and bridge-to-grid microgrids lead grid modes with 83.9%, according to DC Market Insights.
By Component: Switchgear, Protection and Islanding Equipment Leads with 41.6%
| Component | 2025 (USD million) | Share 2025 | 2035 (USD million) | CAGR 2025-2035 |
|---|---|---|---|---|
| Controls and Energy Management Software | 119.84 | 18.5% | 429.66 | 13.62% |
| Switchgear, Protection and Islanding Equipment | 269.64 | 41.6% | 966.74 | 13.62% |
| Engineering, Integration and Commissioning | 209.72 | 32.4% | 751.90 | 13.62% |
| Operations and Optimisation Services | 48.85 | 7.5% | 970.27 | 34.84% |
| Total | 648.05 | 100.0% | 3,118.57 | 17.01% |
By Grid Mode: Islanded and Bridge-to-Grid Microgrids Lead with 83.9%
| Grid mode | 2025 (USD million) | Share 2025 | 2035 (USD million) | CAGR 2025-2035 |
|---|---|---|---|---|
| Islanded and Bridge-to-Grid Microgrids | 543.77 | 83.9% | 2,156.69 | 14.77% |
| Grid-Parallel Resilience Microgrids | 104.28 | 16.1% | 961.88 | 24.88% |
| Total | 648.05 | 100.0% | 3,118.57 | 17.01% |
By Primary Power Source: Gas Engine-Based Microgrids Lead with 40.0%
| Primary power source | 2025 (USD million) | Share 2025 | 2035 (USD million) | CAGR 2025-2035 |
|---|---|---|---|---|
| Gas Engine-Based | 259.22 | 40.0% | 935.57 | 13.69% |
| Gas Turbine-Based | 213.86 | 33.0% | 1,091.50 | 17.70% |
| Fuel Cell-Based | 77.77 | 12.0% | 530.16 | 21.16% |
| Battery and Renewable Hybrid | 97.20 | 15.0% | 561.34 | 19.17% |
| Total | 648.05 | 100.0% | 3,118.57 | 17.01% |
By Data Center Type: Hyperscale and AI Campuses Lead with 70.0%
| Data center type | 2025 (USD million) | Share 2025 | 2035 (USD million) | CAGR 2025-2035 |
|---|---|---|---|---|
| Hyperscale and AI Campuses | 453.63 | 70.0% | 2,245.37 | 17.34% |
| Colocation Data Centers | 142.57 | 22.0% | 654.90 | 16.47% |
| Enterprise and Edge Data Centers | 51.85 | 8.0% | 218.30 | 15.46% |
| Total | 648.05 | 100.0% | 3,118.57 | 17.01% |
Fuel cell-based microgrids grow fastest among power sources at 21.16% a year, because solid oxide fuel cell orders such as the Oracle and Bloom Energy plan for New Mexico need a controller that shares load across hundreds of small units.
DC Exclusive: 100 MW Islanded Campus Microgrid Cost Teardown — USD 26.0 Million Before Generation
DC Market Insights built this teardown from 14 inputs, the NREL cost study and named project disclosures; it is a modelled estimate of what the microgrid layer of a 100 MW islanded data center campus costs in 2025, before any engine, turbine, fuel cell or battery is bought.
| Microgrid layer item | USD per kW (2025) | USD million for 100 MW | Share of layer |
|---|---|---|---|
| Controls and energy management software | 52 | 5.2 | 20% |
| Switchgear, protection and islanding equipment | 117 | 11.7 | 45% |
| Engineering, integration and commissioning | 91 | 9.1 | 35% |
| Total microgrid layer | 260 | 26.0 | 100% |
Applied to named data center microgrid projects, the same USD 260 per kW gives about USD 2.42 billion of microgrid layer value on 9,310 MW, built in phases over several years:
| Project | Microgrid design | MW | Announced |
|---|---|---|---|
| Joule Capital Partners, central Utah | Caterpillar gas generator sets, 1.1 GWh batteries, combined cooling, heat and power | 4,000 | August 2025 |
| Oracle, New Mexico campus | Bloom Energy solid oxide fuel cells | Up to 2,450 | April 2026 |
| Oracle Cloud Infrastructure, Texas sites | VoltaGrid modular gas plants with ABB automation | 2,300 | October 2025 |
| AI campus, New Albany, Ohio | Gas engines, linear generators, 430 MWh batteries; operated by Veolia | 350 | July 2026 |
| Pure DC, Dublin | Three gas combined heat and power energy centres, 20 MW batteries | 110 | March 2026 |
| Microsoft, San Jose | Enchanted Rock renewable natural gas generators | 100 | June 2022 |
| Total | 9,310 |
The teardown shows why switchgear, not software, is the largest cost line: an islanded campus needs medium-voltage breakers and protection for every generator block and every data hall feeder, while one controller platform covers the whole site. DC Market Insights keeps the generation assets of these projects out of this market and sizes them in the sibling reports.
Which Region Spends the Most on Data Center Microgrids?
North America leads with USD 479.56 million in 2025, 74.0% of global value, and Asia Pacific is the fastest-growing region at 26.18% a year.
| Region | 2025 (USD million) | Share 2025 | 2035 (USD million) | CAGR 2025-2035 |
|---|---|---|---|---|
| North America | 479.56 | 74.0% | 1,746.40 | 13.80% |
| Europe | 58.32 | 9.0% | 374.23 | 20.43% |
| Asia Pacific | 51.84 | 8.0% | 530.16 | 26.18% |
| Middle East and Africa | 38.88 | 6.0% | 311.86 | 23.15% |
| Latin America | 19.45 | 3.0% | 155.92 | 23.14% |
| Total | 648.05 | 100.0% | 3,118.57 | 17.01% |
North America Leads with 74.0% Share
North American data center microgrid spending reaches USD 479.56 million in 2025 because the largest islanded campuses, in Texas, Ohio, Utah and New Mexico, sit in the United States, where large-load rules and the July 2026 EPA guidance favour onsite plants.
Europe Holds 9.0% Share
European spending of USD 58.32 million in 2025 grows 20.43% a year, led by Ireland, where the December 2025 CRU policy ties every new large data centre connection to onsite or proximate dispatchable capacity.
Asia Pacific Is the Fastest-Growing Region at 26.18%
Asia Pacific microgrid spending grows from USD 51.84 million in 2025 to USD 530.16 million in 2035, as Japan, Australia, India and Malaysia add AI campuses in areas where transmission upgrades lag new demand.
Middle East and Africa Holds 6.0% Share
Middle East and Africa spending of USD 38.88 million in 2025 grows 23.15% a year, as gas-rich Saudi Arabia and the United Arab Emirates pair new AI campuses with dedicated onsite plants.
Latin America Holds 3.0% Share
Latin American data center microgrid spending grows from USD 19.45 million in 2025 to USD 155.92 million in 2035, led by Mexico, where campus developers plan onsite generation to cover grid delays.
Which Countries Spend the Most on Data Center Microgrids?
The United States spends USD 453.63 million on data center microgrids in 2025, 70.0% of the global total, and India is the fastest-growing country in the top 12 at 32.63% a year.
| Rank | Country | 2025 (USD million) | 2035 (USD million) | CAGR 2025-2035 | Region |
|---|---|---|---|---|---|
| 1 | United States | 453.63 | 1,559.29 | 13.14% | North America |
| 2 | Ireland | 25.92 | 124.74 | 17.01% | Europe |
| 3 | Canada | 25.92 | 187.11 | 21.86% | North America |
| 4 | Saudi Arabia | 16.20 | 140.34 | 24.10% | Middle East and Africa |
| 5 | United Arab Emirates | 12.96 | 109.15 | 23.75% | Middle East and Africa |
| 6 | Japan | 12.96 | 109.15 | 23.75% | Asia Pacific |
| 7 | Australia | 10.37 | 93.56 | 24.60% | Asia Pacific |
| 8 | United Kingdom | 9.72 | 77.96 | 23.15% | Europe |
| 9 | Germany | 7.78 | 62.37 | 23.14% | Europe |
| 10 | Mexico | 7.78 | 68.61 | 24.32% | Latin America |
| 11 | India | 6.48 | 109.15 | 32.63% | Asia Pacific |
| 12 | Malaysia | 6.48 | 77.96 | 28.24% | Asia Pacific |
The United States stays the largest market through 2035, but its share falls from 70.0% to 50.0% as grid connections catch up and other countries add onsite plants. India, at 32.63% a year, is the fastest-growing country because its AI campus pipeline starts from a microgrid base of only USD 6.48 million in 2025 (DC Market Insights allocation).
How Could the 2035 Data Center Microgrid Forecast Change?
The 2035 market ranges from USD 2.34 billion to USD 3.85 billion around the USD 3.12 billion base case, depending on how much islanded capacity is commissioned after 2026 and at what price.
| Scenario | 2035 (USD million) | CAGR 2025-2035 | Assumption from 2027 |
|---|---|---|---|
| Low | 2,339.42 | 13.70% | Islanded MW 25% lower, grid-parallel MW 15% lower, price 5% lower |
| Base | 3,118.57 | 17.01% | Model as described |
| High | 3,854.68 | 19.52% | Islanded MW 20% higher, grid-parallel MW 15% higher, price 5% higher |
The low case follows faster utility connections under the new FERC and Texas rules; the high case follows wider use of grid-independent campuses such as the Ohio and Dublin sites in other markets.
Who Are the Leading Data Center Microgrid Companies?
Schneider Electric leads with about 12% of 2025 value, and the top five suppliers hold about 42% (DC Market Insights assessment based on named data center microgrid projects and controller and switchgear supply).
- Schneider Electric
- Siemens
- ABB
- Eaton
- Hitachi Energy
- GE Vernova
- Caterpillar
- Enchanted Rock
- Bloom Energy
- VoltaGrid
- PowerSecure (Southern Company)
- Veolia
- AVK
- Vertiv
- INNIO Jenbacher
- Rolls-Royce Power Systems (mtu)
The concentration estimate of about 42% for Schneider Electric (about 12%), Siemens (about 9%), ABB (about 8%), Eaton (about 7%) and Hitachi Energy (about 6%) reflects their share of controllers, medium-voltage switchgear and protection supplied to data center microgrids. Engine and turbine makers such as Caterpillar and GE Vernova increasingly sell the controls and switchgear with their generator blocks, as in Caterpillar’s Utah package, while developers such as Enchanted Rock, VoltaGrid and AVK design, own or integrate the microgrid and service firms such as Veolia operate it.
Recent Developments
Seven dated events from February 2025 to July 2026 show data center microgrids moving from resilience add-ons to the main power plan.
- In February 2025, Schneider Electric opened a microgrid testing lab at its Andover, Massachusetts, research centre (Source: Schneider Electric).
- In August 2025, Caterpillar agreed to supply 4 GW of generation and 1.1 GWh of batteries for Joule Capital Partners’ Utah campus (Source: Caterpillar).
- In October 2025, VoltaGrid agreed to deploy 2.3 GW of modular gas generation for Oracle data centers in Texas (Source: VoltaGrid).
- In December 2025, the CRU published its final connection policy requiring onsite or proximate dispatchable capacity for large data centres (Source: CRU).
- In March 2026, Pure DC and AVK started a 110 MW islanded microgrid at a Dublin data centre campus (Source: Pure DC).
- In April 2026, Oracle and Bloom Energy announced up to 2.45 GW of fuel cells for a New Mexico campus (Source: Oracle and Bloom Energy).
- In July 2026, Veolia was selected to operate a 350 MW grid-independent microgrid for an AI data center campus in Ohio (Source: Veolia).
Methodology: How DC Market Insights Sizes the Data Center Microgrid Market
DC Market Insights sizes the market bottom-up as microgrid MW commissioned at data centers times the value of the microgrid layer per kW, plus operating services per kW-year on the installed microgrid base, which gives USD 648.05 million in 2025.
The model in numbers: islanded and bridge-to-grid capacity of 80 MW (2020), 2,000 MW (2025), 3,600 MW (2026), 5,300 MW (2030) and 6,300 MW (2035) at USD 240, USD 260, USD 268, USD 260 and USD 245 per kW; grid-parallel resilience microgrids at 1.5% (2020), 6% (2025), 14% (2030) and 20% (2035) of new data center IT capacity of 6,000 MW, 12,000 MW, 22,000 MW and 27,000 MW, at USD 95, USD 110, USD 115 and USD 112 per kW; and operations and optimisation at USD 10 to USD 13 per kW-year on the prior-year base, which starts at 1,500 MW at the end of 2019 and retires 2% a year. Segment, regional and country shares are DC Market Insights allocations that sum to the total in every year.
Three bound checks test the result. Ceiling one: controls at USD 52 per kW are one third of the NREL mean controller cost of USD 155,000 per MW, as expected at campus scale. Ceiling two: the islanded capacity of about 27 GW commissioned by 2030, of which about 73% is gas-fired, falls inside the IEA range of 15 to 27 GW of onsite natural gas for data centres by 2030. Floor: the 9,310 MW of named projects in the DC Exclusive teardown equal about USD 2.42 billion of microgrid layer value, 36% of the USD 6.79 billion modelled for islanded microgrids from 2025 to 2030. The full approach is described on the DC Market Insights research methodology page.
Table of contents
- 01Introduction
- 1.1Market Definition
- 1.2Historical Period, Base Year and Forecast Period
- 1.3Report Attributes
- 02Research Methodology
- 2.1The Microgrid Layer Model in Numbers
- 2.2Bound Checks: NREL Controller Ceiling, IEA Onsite Gas Ceiling and Named-Project Floor
- 03Executive Summary
- 3.1Market Snapshot, 2025, 2026 and 2035
- 3.2Key Market Statistics
- 3.3Key Takeaways
- 04What Is a Data Center Microgrid?
- 4.1Included: Controls, Switchgear, Integration and Operations
- 4.2Excluded: Generators, Fuel Cells, Batteries, UPS and Fuel
- 4.3How the Segments Fit Together
- 05Why Do Data Center Microgrid Market Estimates Differ?
- 5.1Generation Assets and Fuel in Broader Definitions
- 5.2Scope Comparison: What Is In and Out
- 5.3Buyers Inside the Scope
- 06Market Drivers
- 6.1Ireland Ties New Grid Connections to Onsite Dispatchable Capacity
- 6.2Texas and Federal Rules Make Islanding Part of Large-Load Planning
- 6.3Multi-Gigawatt Campuses Are Designed Around One Controller
- 07Market Trends
- 7.1Fully Grid-Independent Campuses Move from Pilot to Contract
- 7.2Bridge-to-Grid Plants Become Flexible Grid Resources Later
- 7.3Microgrid Controllers Are Tested in Vendor Labs Before Site Work
- 08Market Restraints
- 8.1Air Permits for the Generators Set the Microgrid Timeline
- 8.2Controller Cost per kW Falls as Plants Grow
- 09Market Opportunities
- 9.1Operating Contracts on a Base of Almost 85 GW
- 9.2Grid-Parallel Microgrids for Colocation and Enterprise Sites
- 10Pricing Analysis: Data Center Microgrid Cost per kW
- 10.1Microgrid Layer and Service Prices, 2020-2035
- 10.2Public Anchors: NREL Phase I Microgrid Cost Study
- 11Standards and Regulation
- 11.1IEEE 2030.7 and IEEE 2030.8
- 11.2IEEE 1547
- 11.3NFPA 70, National Electrical Code
- 11.4Ireland CRU Large Energy Users Connection Policy
- 11.5Texas Senate Bill 6 and EPA Islanded Guidance
- 12Data Center Microgrid Market, By Component
- 12.1Controls and Energy Management Software
- 12.2Switchgear, Protection and Islanding Equipment
- 12.3Engineering, Integration and Commissioning
- 12.4Operations and Optimisation Services
- 13Data Center Microgrid Market, By Grid Mode
- 13.1Islanded and Bridge-to-Grid Microgrids
- 13.2Grid-Parallel Resilience Microgrids
- 14Data Center Microgrid Market, By Primary Power Source
- 14.1Gas Engine-Based
- 14.2Gas Turbine-Based
- 14.3Fuel Cell-Based
- 14.4Battery and Renewable Hybrid
- 15Data Center Microgrid Market, By Data Center Type
- 15.1Hyperscale and AI Campuses
- 15.2Colocation Data Centers
- 15.3Enterprise and Edge Data Centers
- 16DC Exclusive: 100 MW Islanded Campus Microgrid Cost Teardown
- 16.1Microgrid Layer Cost per kW
- 16.2Named Data Center Microgrid Projects, 9,310 MW
- 17Regional Insights
- 17.1North America
- 17.2Europe
- 17.3Asia Pacific
- 17.4Middle East and Africa
- 17.5Latin America
- 18Country Analysis
- 18.1United States
- 18.2Ireland
- 18.3Canada
- 18.4Saudi Arabia
- 18.5United Arab Emirates
- 18.6Japan
- 18.7Australia
- 18.8United Kingdom
- 18.9Germany
- 18.10Mexico
- 18.11India
- 18.12Malaysia
- 19Forecast Scenarios, 2035
- 19.1Low Case
- 19.2Base Case
- 19.3High Case
- 20Competitive Insights
- 20.1Schneider Electric
- 20.2Siemens
- 20.3ABB
- 20.4Eaton
- 20.5Hitachi Energy
- 20.6GE Vernova
- 20.7Caterpillar
- 20.8Enchanted Rock
- 20.9Bloom Energy
- 20.10VoltaGrid
- 20.11PowerSecure (Southern Company)
- 20.12Veolia
- 20.13AVK
- 20.14Vertiv
- 20.15INNIO Jenbacher
- 20.16Rolls-Royce Power Systems (mtu)
- 20.17Market Concentration
- 21Recent Developments
- 21.1Dated Events, February 2025 to July 2026
- Fig. 1Data Center Microgrid Market Size, 2020-2035 (USD Million)
- Table 1Report Attributes
- Table 2Scope Comparison: What Is In and Out
- Table 3Microgrid Layer and Service Prices, 2020-2035
- Table 4Data Center Microgrid Market, By Component, 2025 and 2035
- Table 5Data Center Microgrid Market, By Grid Mode, 2025 and 2035
- Table 6Data Center Microgrid Market, By Primary Power Source, 2025 and 2035
- Table 7Data Center Microgrid Market, By Data Center Type, 2025 and 2035
- Table 8100 MW Islanded Campus Microgrid Cost Teardown
- Table 9Named Data Center Microgrid Projects
- Table 10Data Center Microgrid Market, By Region, 2025 and 2035
- Table 11Top 12 Countries, 2025 and 2035
- Table 12Forecast Scenarios, 2035
About this report
Written by Amit Jain and reviewed by Deepti Agrawal, Senior Editor, Research. Figures are built top-down and bottom-up and reconciled before publication, with 2025 as the base year.
Read our methodologyHow we built this
- Historical period2020-2024
- Base year2025
- Forecast period2026-2035
- Sizing approachTop-down + bottom-up
Need more than the report?
Advisory on this market
Due diligence, site selection and market entry work, by the analysts who wrote this report.
See consulting servicesFrequently asked questions
USD 1.17 billion in 2026, up 80.4% from USD 648.05 million in 2025, according to DC Market Insights estimates. The market is projected to reach USD 3.12 billion by 2035, a CAGR of 17.01% from 2025.
17.01% a year from 2025 to 2035, after 72.24% a year from 2020 to 2025, because islanded and bridge-to-grid microgrid capacity commissioned at data centers rises from 2,000 MW in 2025 to 6,300 MW in 2035.
A data center microgrid is a set of onsite generators, batteries and loads that one controller runs as a single system, with or without the grid. DC Market Insights values its control, switchgear, integration and operating layer at USD 648.05 million in 2025.
About USD 260 per kW for the microgrid layer of an islanded campus in 2025, or USD 26.0 million for 100 MW, before generators and batteries (DC Market Insights estimate). A grid-parallel resilience microgrid layer costs about USD 110 per kW.
41.6% of 2025 value, or USD 269.64 million, goes to switchgear, protection and islanding equipment. Operations and optimisation services grow fastest at 34.84% a year as the installed microgrid base reaches 84,844 MW in 2035.
Grid connections for large campuses can take three to ten years, so 2,000 MW of islanded and bridge-to-grid microgrids were commissioned at data centers in 2025. Rules in Ireland and Texas also ask large loads to bring onsite dispatchable capacity.
74.0% of 2025 value, or USD 479.56 million, is spent in North America. Asia Pacific grows fastest at 26.18% a year, and India is the fastest-growing country in the top 12 at 32.63% a year.
About 12% of 2025 value is held by Schneider Electric, and the top five suppliers hold about 42% (DC Market Insights assessment). Siemens, ABB, Eaton and Hitachi Energy follow, with Caterpillar, Enchanted Rock and VoltaGrid as integrators.
9,310 MW of named projects include 4,000 MW for Joule Capital Partners in Utah, up to 2,450 MW of fuel cells for Oracle in New Mexico and 2,300 MW from VoltaGrid for Oracle in Texas. Their microgrid layer is worth about USD 2.42 billion.
USD 1.17 billion in 2026 is the DC Market Insights figure for the microgrid layer only. Estimates that add the generators, fuel cells and batteries inside the microgrid, or fuel and electricity sales, are several times larger.
Licences, delivery and payment
Which licence should I choose?
Single User is a view-only PDF for one person. Multi User adds a printable PDF and the Excel data for unlimited users at one location. Enterprise covers your whole company and includes 100 free analyst hours.
How and when will I receive the report?
By email, within 24–48 business hours of payment, in the formats of your licence.
How can I pay?
Securely through PayPal: with a PayPal account, a debit or credit card, or PayPal Pay Later where available. Prices are in US dollars.
Can I see a sample first?
Yes. Request a free sample and we will email it to you.
Can the report be tailored to my needs?
Yes. We can add countries, segments or data cuts. Talk to an analyst about the scope you need.
Can I get an invoice or pay against a purchase order?
Write to sales@dcmarketinsights.com and our team will help.