
Data Center Renewable Energy Market Size, Share & Forecast to 2035
Market at a glance
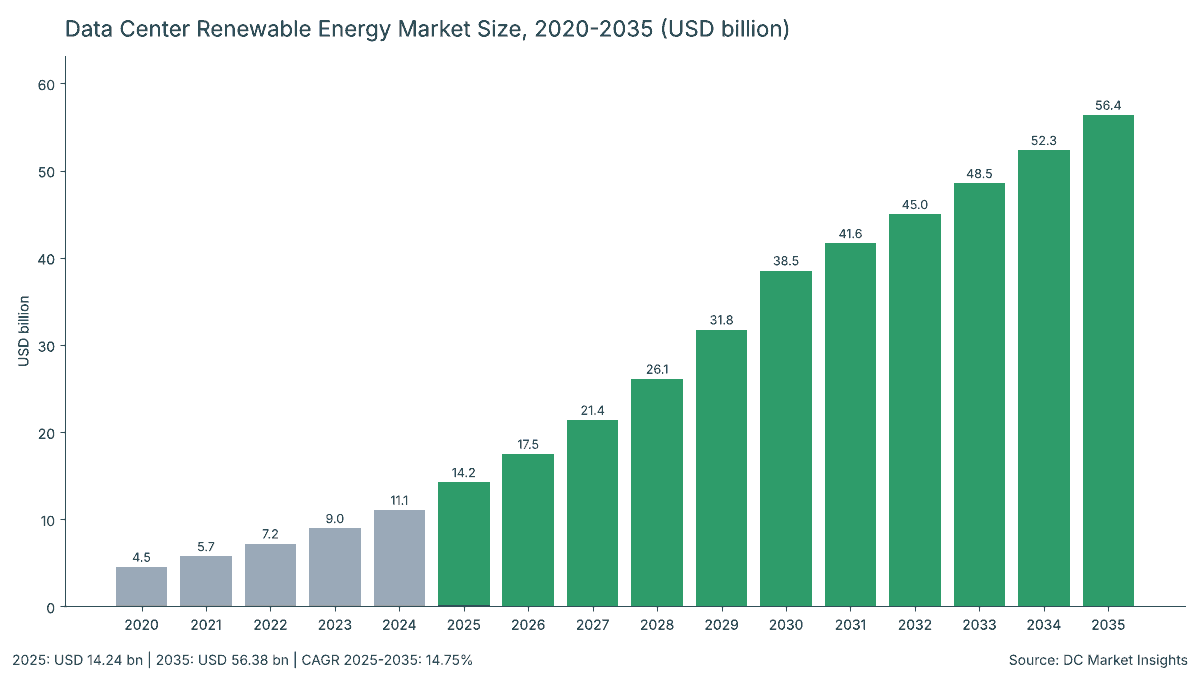
The Data Center Renewable Energy market was worth USD 14.24 billion in 2025 and is forecast to reach USD 56.38 billion by 2035, growing at a 14.75% CAGR.
 By Amit Jain, Senior Consultant, ICT & Emerging Technologies
 Reviewed by Deepti Agrawal
Last updated 19 Oct 2026
Base year 2025 PDF + Excel
What is inside the report
- 01Introduction
- 02Research Methodology
- 03Executive Summary
- 04What Does the Data Center Renewable Energy Market Include?
- 05Why Do Data Center Renewable Energy Market Estimates Differ?
- 06Market Drivers
- 07Market Trends
- 08Market Challenges
- 09Market Opportunities
- 10Pricing
- 20chapters
- 2020-2024Historical period
- 2026-2035Forecast period
- —Companies profiled
Segmentation
Recent developments
Microsoft reported 40 GW of contracted new renewable supply across 26 countries and 100% annual renewable matching (Source: Microsoft).
Meta reserved up to 1 GW of space-based solar from Overview Energy and up to 1 GW of long-duration storage from Noon Energy (Source: Meta).
Amazon agreed to 700 MW of new geothermal and solar capacity in Nevada (Source: Amazon).
Meta and Reliance announced a 168 MW first phase in Jamnagar backed by nearly 1 GW of new clean energy in India (Source: Meta).
Amazon agreed to buy 600 MW from the Gennaker offshore wind farm in Germany (Source: Amazon).
Brazil signed the REDATA data center tax regime into law with a clean or renewable electricity condition (Source: Ministry of Finance of Brazil).
Full analysis
The Data Center Renewable Energy Market is valued at USD 17.48 billion in 2026 and is projected to reach USD 56.38 billion by 2035, up from USD 14.24 billion in 2025, a compound annual growth rate (CAGR) of 14.75% from 2025 to 2035 (DC Market Insights estimate). The money here is the contract value of renewable electricity that data centers buy on purpose: corporate power purchase agreements (PPAs), utility green tariffs, unbundled energy attribute certificates (EACs) and onsite solar or wind. Its size follows two numbers the International Energy Agency (IEA) publishes, data center electricity use of 485 terawatt-hours (TWh) in 2025 rising to 950 TWh in 2030, and one number set by law: Germany’s Energy Efficiency Act (EnEfG) requires data centers to cover 100% of their electricity with renewables from 1 January 2027, up from 50% since 2024. DC Market Insights estimates that dedicated renewable contracts covered 69% of data center electricity in 2025, or 334.6 TWh, at an average contract value of USD 42.55 per megawatt-hour (MWh), and that PPAs carry 75.1% of the spend because buyers are moving from cheap certificates to contracts that add new wind and solar. Onsite Renewable Generation is the fastest channel at 20.95% a year, and Latin America is the fastest region at 18.10% a year after Brazil tied its data center tax regime to clean power in September 2026.
Key Market Statistics: How Big Is the Data Center Renewable Energy Market in 2026?
DC Market Insights values the Data Center Renewable Energy Market at USD 17.48 billion in 2026, 22.8% above 2025, because data center electricity use rose 17% in 2025, according to the IEA, while the largest buyers keep their 100% renewable matching goals.
- Market size 2025: USD 14.24 billion
- Market size 2026: USD 17.48 billion
- Market size 2030: USD 38.53 billion
- Market size 2035: USD 56.38 billion
- CAGR 2025-2035: 14.75% in the base case, 10.67% in the low case and 17.15% in the high case
- Largest procurement channel: corporate PPAs, 75.1% of 2025 value (USD 10.69 billion)
- Fastest-growing channel: onsite renewable generation, 20.95% a year
- Largest source technology: solar photovoltaic (PV), 42.0% of 2025 value; offshore wind grows fastest at 17.34% a year
- Leading region: North America, 46.0% of 2025 value (USD 6.55 billion)
- Fastest-growing region: Latin America, 18.10% a year
- Largest country: the United States, USD 6.05 billion in 2025
- Market leader: Brookfield Renewable, about 6% of 2025 value (DC Market Insights assessment)
Executive Summary
The Global Data Center Renewable Energy Market size was valued at USD 4.53 billion in 2020, reached USD 14.24 billion in 2025, and is anticipated to reach USD 56.38 billion by 2035, at a CAGR of 14.75% during the forecast period.
| Report attribute | Details |
|---|---|
| Historical Period | 2020-2024 |
| Base Year | 2025 |
| Forecast Period | 2026-2035 |
| Data Center Renewable Energy Market Size 2025 | USD 14.24 Billion |
| Data Center Renewable Energy Market Size 2026 | USD 17.48 Billion |
| Data Center Renewable Energy Market, CAGR | 14.75% |
| Data Center Renewable Energy Market Size 2035 | USD 56.38 Billion |
Data center renewable energy spending grew 25.75% a year from 2020 to 2025, faster than the forecast pace, because two things moved at once: data center electricity use rose from 270 TWh to 485 TWh (IEA data and DC Market Insights back-cast), and the share covered by dedicated renewable contracts rose from 60.5% to 69.0%. From 2025 the coverage share rises more slowly, to 79.0% in 2035, so growth of 14.75% a year comes mostly from volume (1,250 TWh of data center use in 2035) and from the shift of value toward PPAs priced at USD 64 per MWh in 2030 rather than certificates at USD 4 per MWh.
Key Takeaways
Four findings explain the Data Center Renewable Energy Market’s USD 14.24 billion base in 2025.
- Corporate PPAs, at USD 10.69 billion, are 75.1% of 2025 value, while certificates cover 22% of data center electricity but earn only USD 320.10 million.
- Hyperscale and AI cloud data centers buy 58.0% of the value; Microsoft, Amazon, Google and Meta report about 145 gigawatts (GW) of contracted clean power between them.
- Germany’s 100% rule from 2027, Ireland’s 80% new-renewables condition (Commission for Regulation of Utilities, December 2025) and Brazil’s REDATA regime turn voluntary buying into a connection or tax condition.
- The United States, at USD 6.05 billion, is 42.5% of the market, but US wind and solar lose federal tax credits if placed in service after 31 December 2027 unless building starts by 4 July 2026 (Internal Revenue Service, Notice 2025-42).
What Does the Data Center Renewable Energy Market Include?
The Data Center Renewable Energy Market covers USD 14.24 billion of 2025 spending on renewable electricity that data center operators contract for, measured at contract value and counted once per MWh.
Included
Four channels are in scope: corporate PPAs, physical and virtual, valued at the contract price times delivered MWh (USD 10.69 billion in 2025); utility green tariffs and sleeved supply, valued at the renewable retail rate (USD 2.79 billion); unbundled EACs, such as US renewable energy certificates (RECs), European guarantees of origin (GOs) and international RECs (I-RECs), valued at the certificate price (USD 320.10 million); and onsite renewable generation, valued at its levelized cost of energy (LCOE) (USD 436.50 million). Buyers are hyperscale and AI cloud operators, colocation providers and enterprise and edge sites, including small and medium-sized enterprises (SMEs) that buy green tariffs through a colocation provider.
Excluded
Grid electricity of the ordinary mix is out of scope even where part of it is renewable; so are nuclear, gas and fuel-cell supply, battery storage hardware, and the equipment for onsite plants, which the Data Center Onsite Power Generation Market and the Data Center Microgrid Market cover. Energy-efficient cooling and power hardware belong to the Green Data Center Market.
How the Segments Fit Together
Every split sums to USD 14.24 billion in 2025 and USD 56.38 billion in 2035: the four procurement channels, four source technologies and three data center types each add up to the total, and so do the five regions. The 12 countries in the country table hold 77.8% of 2025 value; the rest sits in the regional remainders.
Why Do Data Center Renewable Energy Market Estimates Differ?
Estimates differ because the USD 17.48 billion DC Market Insights figure for 2026 counts only the contract value of renewable electricity that data centers buy on purpose, not equipment or the renewable part of the ordinary grid mix.
Broader definitions add the capital cost of solar farms and wind farms built for data center offtake, battery storage and microgrid controls, energy-efficiency hardware sold as ‘green data center’ equipment, or advisory fees for sustainability reporting. Some count every renewable MWh a data center draws from the grid: the IEA estimates that renewables supply about 27% of data center electricity worldwide, a physical share that differs from the 69% that dedicated contracts cover. Nuclear PPAs, geothermal firm power deals sold as carbon-free energy (CFE), gas-backed co-location and capital spent on transmission lines are out of scope here, as are renewable purchases by telecom networks and office buildings.
| Element | In this report | Why |
|---|---|---|
| Corporate PPA contract value | Yes, USD 10.69 billion | Data center buyer pays per MWh |
| Utility green tariffs and sleeved supply | Yes, USD 2.79 billion | Renewable retail rate paid by the data center |
| Unbundled certificates (RECs, GOs, I-RECs) | Yes, USD 320.10 million | Certificate price only |
| Onsite solar and wind output | Yes, USD 436.50 million | Valued at LCOE |
| Renewable share of the ordinary grid mix | No | Not a purchasing decision |
| Solar, wind, storage and microgrid equipment | No | Capital goods, covered in sibling reports |
| Nuclear and gas supply contracts | No | Not renewable |
Inside the scope, the buyer groups are hyperscale and AI cloud operators (USD 8.26 billion), colocation providers (USD 4.27 billion) and enterprise and edge sites, including SMEs (USD 1.71 billion).
Why Are Data Centers Buying More Renewable Energy?
Data centers will buy 712 TWh of renewable electricity under contract in 2030, up from 335 TWh in 2025 (DC Market Insights estimate), driven by laws that set renewable shares, rising AI electricity use and grid connection rules.
Germany Requires 100% Renewable Electricity for Data Centers from January 2027
Section 11 of Germany’s Energy Efficiency Act (EnEfG) requires data center operators to cover 50% of their electricity with renewables from 1 January 2024 and 100% from 1 January 2027 on a balance-sheet basis. DC Market Insights estimates that German data center renewable spending reaches USD 683.50 million in 2025 and USD 2.42 billion by 2035. The European Union’s Delegated Regulation (EU) 2024/1364 adds disclosure: every data center of at least 500 kilowatts (kW) of IT load reports a renewable energy factor that sums guarantees of origin, PPAs and onsite output, with reports due each 15 May since 2025.
AI Pushed Data Center Electricity Use Up 17% in 2025
Data center electricity demand rose 17% in 2025, according to the IEA (April 2026), and technology companies signed about 40% of all corporate renewable PPAs that year. Google alone signed agreements for more than 12 GW of new clean energy in 2025, according to its 2026 environmental report. In the DC Market Insights model each extra TWh of data center use adds about USD 29.4 million of renewable spending in 2025, rising to USD 45.1 million per TWh in 2035 as coverage and PPA shares rise.
Ireland and Brazil Turn Renewable Supply into a Connection Condition
Ireland’s Commission for Regulation of Utilities (CRU) decision of 12 December 2025 requires new data centers to meet at least 80% of annual demand with additional Irish renewable projects, on a six-year glide path, and to bring onsite or nearby generation or storage matched to their import capacity. Brazil’s REDATA special tax regime for data centers, signed into law on 15 September 2026 according to the Ministry of Finance, requires beneficiaries to cover all contracted electricity from clean or renewable sources. DC Market Insights puts Irish spending at USD 455.67 million in 2025 and Brazilian spending at USD 227.83 million, growing 18.46% a year.
How Is Data Center Renewable Energy Buying Changing?
The PPA share of data center electricity rises from 38% in 2025 to 54% in 2035 in the DC Market Insights model, as buyers move from annual certificate matching to co-located and round-the-clock supply.
Alphabet Buys Intersect to Build Data Centers Next to Their Own Power
Alphabet agreed in December 2025 to acquire Intersect for USD 4.75 billion in cash plus assumed debt, building on a December 2024 partnership to co-locate data centers with new generation. In June 2026 Google named the first site, the Meitner Energy Center in Gray and Roberts Counties, Texas. DC Market Insights expects onsite and near-site renewable value to grow from USD 436.50 million in 2025 to USD 2.92 billion by 2035.
Certificates Lose Share to Contracts That Add New Plants
Unbundled certificates covered 30% of data center electricity in 2020 and 22% in 2025, and fall to 10% by 2035 in the DC Market Insights model, because the German, Irish and Brazilian rules and buyer goals favour new, additional plants. The certificate channel grows only 4.56% a year, to USD 500.00 million, even though certificate prices rise from USD 3 to USD 4 per MWh.
Storage-Backed Solar Moves Toward Round-the-Clock Supply
Masdar and Emirates Water and Electricity Company (EWEC) announced in October 2025 a 5.2 GW solar plant with 19 gigawatt-hours (GWh) of batteries to deliver 1 GW around the clock in Abu Dhabi, presented as support for the emirate’s AI hub plans. Meta agreed in April 2026 to reserve up to 1 GW of ultra-long-duration storage with Noon Energy. Firmed supply costs more per MWh, which is why the DC Market Insights PPA price rises from USD 58 in 2025 to USD 64 per MWh in 2030.
What Could Slow Data Center Renewable Energy Purchases?
Two limits could cut the 2035 market to the USD 39.24 billion low case: the US federal tax-credit cut-off and the pace at which new renewable plants can connect to the grid.
US Wind and Solar Tax Credits End for Plants Online After 2027
Under the One Big Beautiful Bill Act, wind and solar facilities placed in service after 31 December 2027 lose the clean electricity production and investment credits (sections 45Y and 48E) unless construction begins by 4 July 2026, as set out in Internal Revenue Service Notice 2025-42. Lawrence Berkeley National Laboratory (LBNL) puts the 2024 LCOE of US utility-scale solar at USD 41 per MWh with tax credits and USD 60 without, and solar plus batteries at USD 59 and USD 87. The United States is 42.5% of the market, so a USD 5 per MWh rise in US PPA prices would add about USD 0.92 billion to the 2030 cost of the same PPA volume, money that buyers may instead cut from contracted volume (DC Market Insights estimate).
New Renewable Supply Cannot Keep Pace with Data Center Demand
The IEA expects renewables to meet nearly 50% of the growth in data center electricity demand to 2030, so the rest comes from gas, nuclear and the existing grid. Dedicated contract coverage therefore rises only from 69% in 2025 to 75% in 2030 in the DC Market Insights model, and 238 TWh of data center use in 2030 stays uncovered by renewable contracts.
Where Are the Openings in the Data Center Renewable Energy Market?
The two largest openings are compliance-led demand in India and Brazil, worth USD 3.50 billion together by 2035, and onsite or near-site supply, worth USD 2.92 billion.
India and Brazil Grow Fastest Among Large Countries
India’s data center renewable spending grows from USD 284.79 million in 2025 to USD 2.25 billion by 2035, 22.99% a year, the fastest of the top 12 countries. India’s Green Energy Open Access Rules (Ministry of Power, June 2022) cut the open-access threshold for green power from 1 megawatt (MW) to 100 kW, and in June 2026 Meta and Reliance tied a 168 MW first phase in Jamnagar to nearly 1 GW of new clean energy, including 837 MW from CleanMax. Brazil grows from USD 227.83 million to USD 1.24 billion under REDATA.
Onsite and Near-Site Renewables Under Connection Rules
Onsite renewable generation grows from USD 436.50 million in 2025 to USD 2.92 billion by 2035, 20.95% a year, the fastest channel, because Ireland’s onsite-or-local generation condition and US co-location projects reward plants built at the campus. Its share of data center electricity rises from 1% to 3% in the DC Market Insights model.
How Much Do Data Centers Pay for Renewable Electricity?
Data centers paid an average of USD 42.55 per MWh of contracted renewable electricity in 2025 across all channels, with PPAs at USD 58 and certificates at USD 3 per MWh (DC Market Insights estimates).
| Channel (USD per MWh) | 2020 | 2025 | 2030 | 2035 |
|---|---|---|---|---|
| Corporate PPAs (Physical and Virtual) | 50 | 58 | 64 | 62 |
| Utility Green Tariffs and Sleeved Supply | 64 | 72 | 76 | 74 |
| Unbundled Energy Attribute Certificates | 2 | 3 | 4 | 4 |
| Onsite Renewable Generation | 95 | 90 | 82 | 78 |
Public anchors support the ladder: LBNL reports an average levelized PPA price of USD 29 per MWh for US solar projects that began operating in 2024, and an LCOE for 2023-2024 wind plants from USD 40 per MWh in the Electric Reliability Council of Texas (ERCOT) to USD 67 per MWh in the New York Independent System Operator (NYISO) area. The DC Market Insights blended PPA price is higher, USD 58 per MWh in 2025, because it includes European contracts, shaped and firmed supply and offshore wind.
Which Laws and Standards Govern Data Center Renewable Energy Claims?
At least seven rules shape how the USD 14.24 billion of 2025 spending is bought and reported, from Germany’s 100% requirement to the EU’s renewable energy factor.
- Germany, Energy Efficiency Act (EnEfG) section 11: 50% renewable electricity from 2024 and 100% from 1 January 2027.
- European Union, Energy Efficiency Directive (EU) 2023/1791 Article 12 and Delegated Regulation (EU) 2024/1364: data centers of at least 500 kW report energy and renewable key performance indicators, including the renewable energy factor.
- Ireland, CRU data centre connection policy decision (12 December 2025): 80% of annual demand from additional Irish renewables.
- United States, One Big Beautiful Bill Act and Notice 2025-42: 45Y and 48E credit deadlines for wind and solar.
- Brazil, REDATA special tax regime (September 2026): all contracted electricity from clean or renewable sources.
- India, Green Energy Open Access Rules 2022: green power open access from 100 kW.
- Singapore, Infocomm Media Development Authority (IMDA) Green Data Centre Roadmap (May 2024): at least 300 MW of new capacity tied to faster use of green energy.
Market-based reporting under the Greenhouse Gas Protocol Scope 2 Guidance decides which certificates and PPAs a data center can count against its electricity emissions.
Which Renewable Energy Channels Do Data Centers Use Most?
Corporate PPAs lead with 75.1% of 2025 value, solar PV leads the source technologies with 42.0%, and hyperscale and AI cloud data centers lead the buyer types with 58.0%.
By Procurement Channel: Corporate PPAs Lead with 75.1%
PPAs grow 14.62% a year to USD 41.85 billion; green tariffs grow 14.79% a year as utilities offer data center tariffs; certificates grow only 4.56%.
| Procurement Channel | 2025 Value | Share 2025 | 2035 Value | CAGR 2025-2035 |
|---|---|---|---|---|
| Corporate PPAs (Physical and Virtual) | USD 10.69 billion | 75.1% | USD 41.85 billion | 14.62% |
| Utility Green Tariffs and Sleeved Supply | USD 2.79 billion | 19.6% | USD 11.10 billion | 14.79% |
| Unbundled Energy Attribute Certificates | USD 320.10 million | 2.2% | USD 500.00 million | 4.56% |
| Onsite Renewable Generation | USD 436.50 million | 3.1% | USD 2.92 billion | 20.95% |
| Total | USD 14.24 billion | 100.0% | USD 56.38 billion | 14.75% |
By Source Technology: Solar PV Leads with 42.0%
Solar PV rises from USD 5.98 billion to USD 27.06 billion as storage-backed solar spreads; offshore wind grows 17.34% a year on European contracts such as Amazon’s 600 MW Gennaker deal in Germany (August 2026).
| Source Technology | 2025 Value | Share 2025 | 2035 Value | CAGR 2025-2035 |
|---|---|---|---|---|
| Solar PV | USD 5.98 billion | 42.0% | USD 27.06 billion | 16.29% |
| Onshore Wind | USD 5.41 billion | 38.0% | USD 16.91 billion | 12.07% |
| Offshore Wind | USD 1.14 billion | 8.0% | USD 5.64 billion | 17.34% |
| Hydro and Geothermal Power | USD 1.71 billion | 12.0% | USD 6.76 billion | 14.75% |
| Total | USD 14.24 billion | 100.0% | USD 56.38 billion | 14.75% |
By Data Center Type: Hyperscale and AI Cloud Lead with 58.0%
Hyperscale and AI cloud buyers grow 16.24% a year; colocation providers, led by Equinix at 96% renewable coverage in 2025 and Digital Realty at 93%, grow 13.55% a year.
| Data Center Type | 2025 Value | Share 2025 | 2035 Value | CAGR 2025-2035 |
|---|---|---|---|---|
| Hyperscale and AI Cloud Data Centers | USD 8.26 billion | 58.0% | USD 37.21 billion | 16.24% |
| Colocation Data Centers | USD 4.27 billion | 30.0% | USD 15.22 billion | 13.55% |
| Enterprise and Edge Data Centers | USD 1.71 billion | 12.0% | USD 3.95 billion | 8.73% |
| Total | USD 14.24 billion | 100.0% | USD 56.38 billion | 14.75% |
DC Exclusive: The Clean-Power Contract Book, 6 Buyers and About 147 GW
Six data center buyers report about 147 GW of contracted clean power, a DC Market Insights tracker built from 10 public inputs in company reports; the second table is a DC Market Insights model that splits USD 14.24 billion of 2025 value by buyer type and channel.
| Buyer | Contracted clean power | Coverage or matching | Latest dated move |
|---|---|---|---|
| Microsoft | 40 GW in 26 countries | 100% annual renewable matching (2025) | Brookfield framework, 10.5 GW for 2026-2030 |
| Amazon | Over 40 GW, 700+ projects (includes nuclear and storage) | 100% matched in 2025 | 700 MW geothermal and solar, Nevada (May 2026) |
| Nearly 35 GW signed 2010-2025 | 100% annual matching, 9th year | Over 12 GW signed in 2025; Intersect acquisition | |
| Meta | Over 30 GW | 100% matched since 2020 | Nearly 1 GW in India with Reliance (June 2026) |
| Digital Realty | 1.7 GW | 93% coverage (2025) | 205 sites at 100% (May 2026 report) |
| Equinix | Not disclosed in GW | 96% coverage (2025) | Eighth year at 90% or more |
The four hyperscalers’ roughly 145 GW of contracts compare with 335 TWh of renewable electricity bought by all data centers in 2025: at a 30% capacity factor, 145 GW would generate about 381 TWh a year once built, which shows how much of the contract book is still under construction or serves non-data-center load (DC Market Insights calculation).
| Data Center Type | Corporate PPAs | Green Tariffs | Certificates | Onsite | Total |
|---|---|---|---|---|---|
| Hyperscale and AI Cloud Data Centers | USD 7.03 billion | USD 936.79 million | USD 29.14 million | USD 262.84 million | USD 8.26 billion |
| Colocation Data Centers | USD 2.79 billion | USD 1.21 billion | USD 156.79 million | USD 113.15 million | USD 4.27 billion |
| Enterprise and Edge Data Centers | USD 867.06 million | USD 647.01 million | USD 134.17 million | USD 60.51 million | USD 1.71 billion |
| Total | USD 10.69 billion | USD 2.79 billion | USD 320.10 million | USD 436.50 million | USD 14.24 billion |
Which Region Spends the Most on Data Center Renewable Energy?
North America leads with 46.0% of 2025 value, while Latin America grows fastest at 18.10% a year to USD 2.25 billion by 2035.
| Region | 2025 Value | Share 2025 | 2035 Value | CAGR 2025-2035 |
|---|---|---|---|---|
| North America | USD 6.55 billion | 46.0% | USD 23.68 billion | 13.71% |
| Europe | USD 3.70 billion | 26.0% | USD 12.40 billion | 12.85% |
| Asia Pacific | USD 2.99 billion | 21.0% | USD 15.22 billion | 17.67% |
| Latin America | USD 427.19 million | 3.0% | USD 2.25 billion | 18.10% |
| Middle East and Africa | USD 569.58 million | 4.0% | USD 2.82 billion | 17.34% |
| Total | USD 14.24 billion | 100.0% | USD 56.38 billion | 14.75% |
North America Leads with 46.0% Share
North America spends USD 6.55 billion in 2025. The National Laboratory of the Rockies counts 122.7 GW of US corporate PPAs and utility renewable contracts as of September 2025, about 64 GW of it operating, and the IEA expects renewables to add 110 TWh to US data center supply between 2024 and 2030.
Europe Holds 26.0% Share
Europe spends USD 3.70 billion in 2025, growing 12.85% a year, with Germany’s 2027 deadline and Ireland’s 80% rule setting the pace; Amazon signed a 156 MW agrivoltaic PPA in Italy in September 2026.
Asia Pacific Holds 21.0% Share
Asia Pacific spends USD 2.99 billion in 2025 and grows 17.67% a year. Amazon committed in June 2025 to buy more than 170 MW from three new solar farms in Victoria and Queensland alongside an AUD 20 billion Australian data center plan.
Latin America Is the Fastest-Growing Region at 18.10%
Latin America grows from USD 427.19 million to USD 2.25 billion, led by Brazil, where REDATA makes renewable supply a condition of the data center tax regime from September 2026.
Middle East and Africa Holds 4.0% Share
Middle East and Africa spends USD 569.58 million in 2025 and grows 17.34% a year; the Abu Dhabi 5.2 GW round-the-clock solar project is the largest firmed renewable supply announced near a data center hub.
Which Countries Spend the Most on Data Center Renewable Energy?
The United States leads with USD 6.05 billion in 2025, and India is the fastest-growing large country at 22.99% a year.
| Rank | Country | Region | 2025 Value | Share 2025 | 2035 Value | CAGR 2025-2035 |
|---|---|---|---|---|---|---|
| 1 | United States | North America | USD 6.05 billion | 42.5% | USD 21.70 billion | 13.62% |
| 2 | China | Asia Pacific | USD 996.77 million | 7.0% | USD 5.64 billion | 18.92% |
| 3 | Germany | Europe | USD 683.50 million | 4.8% | USD 2.42 billion | 13.50% |
| 4 | United Kingdom | Europe | USD 512.63 million | 3.6% | USD 1.80 billion | 13.41% |
| 5 | Canada | North America | USD 498.39 million | 3.5% | USD 1.97 billion | 14.75% |
| 6 | Ireland | Europe | USD 455.67 million | 3.2% | USD 1.41 billion | 11.95% |
| 7 | Japan | Asia Pacific | USD 427.19 million | 3.0% | USD 1.92 billion | 16.20% |
| 8 | Netherlands | Europe | USD 398.71 million | 2.8% | USD 1.35 billion | 13.00% |
| 9 | Australia | Asia Pacific | USD 370.23 million | 2.6% | USD 1.58 billion | 15.61% |
| 10 | India | Asia Pacific | USD 284.79 million | 2.0% | USD 2.25 billion | 22.99% |
| 11 | Brazil | Latin America | USD 227.83 million | 1.6% | USD 1.24 billion | 18.46% |
| 12 | Singapore | Asia Pacific | USD 170.88 million | 1.2% | USD 620.12 million | 13.76% |
China ranks second with USD 996.77 million and grows 18.92% a year as green electricity certificates and provincial green power trading expand; DC Market Insights treats China’s certificate channel at local prices.
How Could the 2035 Data Center Renewable Energy Forecast Change?
The 2035 market ranges from USD 39.24 billion in the low case to USD 69.35 billion in the high case, around a base of USD 56.38 billion.
| Scenario | 2035 Value | CAGR 2025-2035 | Assumptions |
|---|---|---|---|
| Low | USD 39.24 billion | 10.67% | Data center electricity use 15% below base, PPA share 8 points lower, prices 8% lower |
| Base | USD 56.38 billion | 14.75% | 1,250 TWh, PPA share 54%, PPA price USD 62 per MWh |
| High | USD 69.35 billion | 17.15% | Use 10% above base, PPA share 4 points higher, prices 6% higher |
Who Supplies Renewable Energy to Data Centers?
The top five suppliers hold about 21% of 2025 value (DC Market Insights assessment based on announced data center offtake contracts), with Brookfield Renewable the largest at about 6%; hundreds of regional developers and utilities share the rest.
- Brookfield Renewable
- NextEra Energy Resources
- Ørsted
- Iberdrola
- Enel Green Power
- RWE
- EDP Renewables
- AES Corporation
- ENGIE
- Invenergy
- Intersect Power (Alphabet)
- TotalEnergies
- Masdar
- ACWA Power
- Adani Green Energy
- CleanMax
Brookfield Renewable’s framework with Microsoft covers more than 10.5 GW of new US and European capacity for delivery between 2026 and 2030 (Brookfield, May 2024). Alphabet’s USD 4.75 billion purchase of Intersect (December 2025) makes a buyer its own developer. CleanMax supplies 837 MW to the Meta and Reliance project in India (Meta, June 2026), and Masdar leads the 5.2 GW Abu Dhabi solar and storage plant with EWEC (October 2025).
Recent Developments
Six dated events from February to September 2026 show buyers adding contracts and governments tightening rules.
- In February 2026, Microsoft reported 40 GW of contracted new renewable supply across 26 countries and 100% annual renewable matching (Source: Microsoft).
- In April 2026, Meta reserved up to 1 GW of space-based solar from Overview Energy and up to 1 GW of long-duration storage from Noon Energy (Source: Meta).
- In May 2026, Amazon agreed to 700 MW of new geothermal and solar capacity in Nevada (Source: Amazon).
- In June 2026, Meta and Reliance announced a 168 MW first phase in Jamnagar backed by nearly 1 GW of new clean energy in India (Source: Meta).
- In August 2026, Amazon agreed to buy 600 MW from the Gennaker offshore wind farm in Germany (Source: Amazon).
- In September 2026, Brazil signed the REDATA data center tax regime into law with a clean or renewable electricity condition (Source: Ministry of Finance of Brazil).
Methodology: How DC Market Insights Sizes the Data Center Renewable Energy Market
DC Market Insights sizes the market at USD 14.24 billion in 2025 as data center electricity use times the share bought through each renewable channel times that channel’s price per MWh.
Data center electricity use follows the IEA (Energy and AI and its 2026 update): 415 TWh in 2024, 485 TWh in 2025 and 950 TWh in 2030, extended to 1,250 TWh in 2035 and back-cast to 270 TWh in 2020. Channel shares rise from 60.5% total coverage in 2020 to 69.0% in 2025 and 79.0% in 2035; prices per MWh follow the pricing table. The 2025 receipt: 485 TWh x 38% x USD 58 = USD 10.69 billion of PPAs, plus USD 2.79 billion of green tariffs, USD 320.10 million of certificates and USD 436.50 million of onsite output. Regions, countries, technologies and buyer types are shares of the total that move linearly from 2025 to 2035.
Three bound checks hold. First (ceiling): buying all 485 TWh of 2025 data center electricity at the PPA price would cost USD 28.13 billion, above the USD 14.24 billion estimate. Second (ceiling): the 64 GW of operating US corporate renewable contracts would yield about 168 TWh a year at a 30% capacity factor, worth about USD 8.4 billion at USD 50 per MWh, above the USD 5.73 billion of US data center PPA and green-tariff value in the model. Third (floor): Meta’s data centers alone used 18.06 TWh in 2024, all matched with renewables, worth at least USD 0.52 billion at the LBNL solar PPA price of USD 29 per MWh. Full method: DC Market Insights research methodology; the parent figure is in the Data Center Market report.
Table of contents
- 01Introduction
- 1.1Market Definition
- 1.2Historical Period, Base Year and Forecast Period
- 1.3Report Attributes
- 02Research Methodology
- 2.1The Electricity-Times-Channel-Price Model in Numbers
- 2.2Bound Checks: All-PPA Ceiling, US Corporate Contract Ceiling and Meta Floor
- 03Executive Summary
- 3.1Market Snapshot, 2025, 2026 and 2035
- 3.2Key Market Statistics
- 3.3Key Takeaways
- 04What Does the Data Center Renewable Energy Market Include?
- 4.1Included: PPAs, Green Tariffs, Certificates and Onsite Output
- 4.2Excluded: Grid Mix, Equipment, Nuclear and Gas Supply
- 4.3How the Segments Fit Together
- 05Why Do Data Center Renewable Energy Market Estimates Differ?
- 5.1Equipment, Storage and Grid-Mix Renewables in Broader Definitions
- 5.2Scope Comparison: What Is In and Out
- 5.3Buyers Inside the Scope
- 06Market Drivers
- 6.1Germany Requires 100% Renewable Electricity for Data Centers from January 2027
- 6.2AI Pushed Data Center Electricity Use Up 17% in 2025
- 6.3Ireland and Brazil Turn Renewable Supply into a Connection Condition
- 07Market Trends
- 7.1Alphabet Buys Intersect to Build Data Centers Next to Their Own Power
- 7.2Certificates Lose Share to Contracts That Add New Plants
- 7.3Storage-Backed Solar Moves Toward Round-the-Clock Supply
- 08Market Challenges
- 8.1US Wind and Solar Tax Credits End for Plants Online After 2027
- 8.2New Renewable Supply Cannot Keep Pace with Data Center Demand
- 09Market Opportunities
- 9.1India and Brazil Grow Fastest Among Large Countries
- 9.2Onsite and Near-Site Renewables Under Connection Rules
- 10Pricing
- 10.1Price per MWh by Channel, 2020-2035
- 10.2Public Price Anchors: LBNL Solar PPA and Wind LCOE
- 11Laws and Standards
- 11.1Germany Energy Efficiency Act Section 11
- 11.2EU Delegated Regulation 2024/1364
- 11.3Ireland CRU Connection Policy
- 11.4US One Big Beautiful Bill Act and Notice 2025-42
- 11.5Brazil REDATA
- 11.6India Green Energy Open Access Rules
- 11.7Singapore IMDA Green Data Centre Roadmap
- 11.8Greenhouse Gas Protocol Scope 2 Guidance
- 12Market Segmentation by Procurement Channel
- 12.1Corporate PPAs (Physical and Virtual)
- 12.2Utility Green Tariffs and Sleeved Supply
- 12.3Unbundled Energy Attribute Certificates
- 12.4Onsite Renewable Generation
- 13Market Segmentation by Source Technology
- 13.1Solar PV
- 13.2Onshore Wind
- 13.3Offshore Wind
- 13.4Hydro and Geothermal Power
- 14Market Segmentation by Data Center Type
- 14.1Hyperscale and AI Cloud Data Centers
- 14.2Colocation Data Centers
- 14.3Enterprise and Edge Data Centers
- 15DC Exclusive: The Clean-Power Contract Book
- 15.1Microsoft
- 15.2Amazon
- 15.3Google
- 15.4Meta
- 15.5Digital Realty
- 15.6Equinix
- 15.7Procurement Channel by Data Center Type, 2025
- 16Regional Insights
- 16.1North America
- 16.2Europe
- 16.3Asia Pacific
- 16.4Latin America
- 16.5Middle East and Africa
- 17Country Analysis
- 17.1United States
- 17.2China
- 17.3Germany
- 17.4United Kingdom
- 17.5Canada
- 17.6Ireland
- 17.7Japan
- 17.8Netherlands
- 17.9Australia
- 17.10India
- 17.11Brazil
- 17.12Singapore
- 18Forecast Scenarios
- 18.1Low Case
- 18.2Base Case
- 18.3High Case
- 19Competitive Insights
- 19.1Brookfield Renewable
- 19.2NextEra Energy Resources
- 19.3Ørsted
- 19.4Iberdrola
- 19.5Enel Green Power
- 19.6RWE
- 19.7EDP Renewables
- 19.8AES Corporation
- 19.9ENGIE
- 19.10Invenergy
- 19.11Intersect Power (Alphabet)
- 19.12TotalEnergies
- 19.13Masdar
- 19.14ACWA Power
- 19.15Adani Green Energy
- 19.16CleanMax
- 20Recent Developments
- 20.1Dated Events, February to September 2026
- Fig. 1Data Center Renewable Energy Market Size, 2020-2035
- Table 1Report Attributes
- Table 2Scope Comparison: What Is In and Out
- Table 3Price per MWh by Channel, 2020-2035
- Table 4Market by Procurement Channel, 2025 and 2035
- Table 5Market by Source Technology, 2025 and 2035
- Table 6Market by Data Center Type, 2025 and 2035
- Table 7Clean-Power Contract Book: 6 Buyers
- Table 8Procurement Channel by Data Center Type, 2025
- Table 9Market by Region, 2025 and 2035
- Table 10Top 12 Countries, 2025 and 2035
- Table 11Forecast Scenarios, 2035
About this report
Written by Amit Jain and reviewed by Deepti Agrawal, Senior Editor, Research. Figures are built top-down and bottom-up and reconciled before publication, with 2025 as the base year.
Read our methodologyHow we built this
- Historical period2020-2024
- Base year2025
- Forecast period2026-2035
- Sizing approachTop-down + bottom-up
Need more than the report?
Advisory on this market
Due diligence, site selection and market entry work, by the analysts who wrote this report.
See consulting servicesFrequently asked questions
USD 17.48 billion in 2026, up 22.8% from USD 14.24 billion in 2025, according to DC Market Insights estimates. The market is projected to reach USD 56.38 billion by 2035, a CAGR of 14.75% from 2025.
14.75% a year from 2025 to 2035, after 25.75% a year from 2020 to 2025, as data center electricity use rises from 485 TWh to 1,250 TWh and PPAs replace certificates.
USD 14.24 billion of 2025 contract value across corporate PPAs, utility green tariffs, unbundled certificates and onsite solar or wind. Equipment, the ordinary grid mix, nuclear and gas supply are excluded.
USD 42.55 per MWh on average in 2025 across channels, with corporate PPAs at USD 58 and certificates at USD 3 per MWh (DC Market Insights estimates).
75.1% of 2025 value, or USD 10.69 billion, comes from corporate PPAs. Onsite renewable generation grows fastest, at 20.95% a year to USD 2.92 billion by 2035.
46.0% of 2025 value, or USD 6.55 billion, is spent in North America. Latin America grows fastest at 18.10% a year, and India is the fastest-growing country.
About 145 GW across four companies: Microsoft 40 GW, Amazon over 40 GW including nuclear and storage, Google nearly 35 GW since 2010 and Meta over 30 GW, according to their own reports.
Yes, 100% from 1 January 2027 under section 11 of the Energy Efficiency Act (EnEfG), up from 50% since 1 January 2024, counted on a balance-sheet basis.
Wind and solar placed in service after 31 December 2027 lose 45Y and 48E credits unless construction starts by 4 July 2026. LBNL puts solar LCOE at USD 41 per MWh with credits and USD 60 without.
USD 17.48 billion in 2026 is the DC Market Insights figure for contract value only. Estimates that add solar and wind plant capital, storage hardware or the renewable share of the grid mix are larger.
Licences, delivery and payment
Which licence should I choose?
Single User is a view-only PDF for one person. Multi User adds a printable PDF and the Excel data for unlimited users at one location. Enterprise covers your whole company and includes 100 free analyst hours.
How and when will I receive the report?
By email, within 24–48 business hours of payment, in the formats of your licence.
How can I pay?
Securely through PayPal: with a PayPal account, a debit or credit card, or PayPal Pay Later where available. Prices are in US dollars.
Can I see a sample first?
Yes. Request a free sample and we will email it to you.
Can the report be tailored to my needs?
Yes. We can add countries, segments or data cuts. Talk to an analyst about the scope you need.
Can I get an invoice or pay against a purchase order?
Write to sales@dcmarketinsights.com and our team will help.