
Enterprise Data Center Market Size, Share & Forecast to 2035
Market at a glance
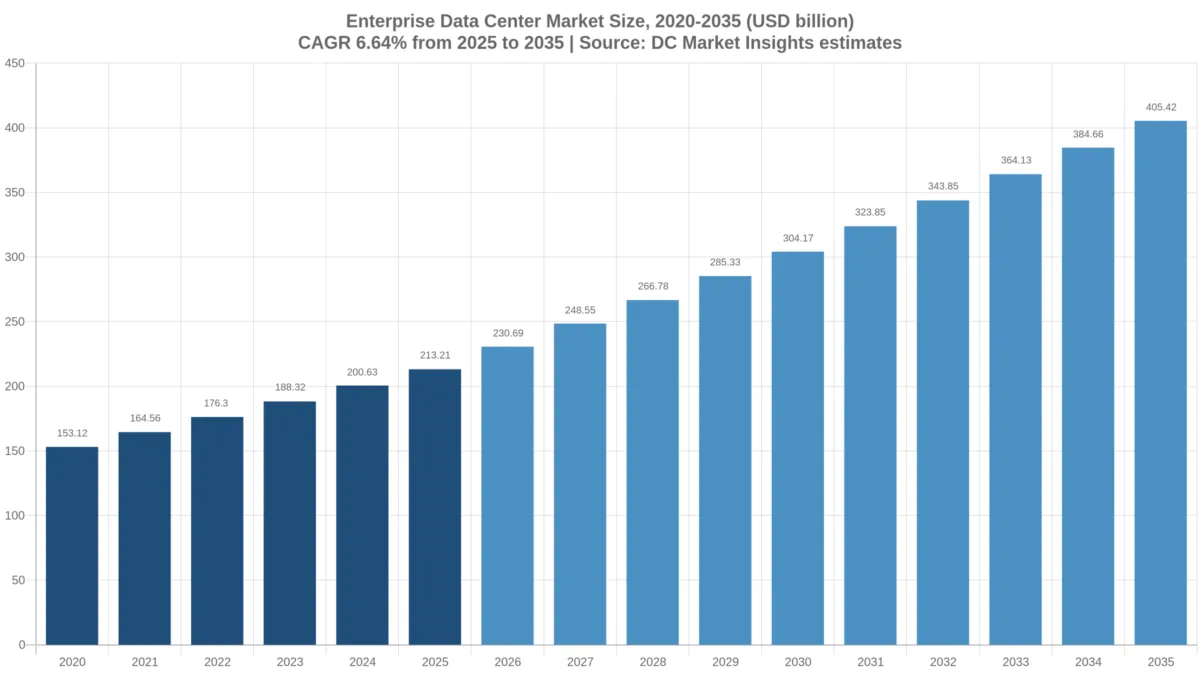
The Enterprise Data Center market was worth USD 213.21 billion in 2025 and is forecast to reach USD 405.42 billion by 2035, growing at a 6.64% CAGR.
 By Amit Jain, Senior Consultant, ICT & Emerging Technologies
 Reviewed by Deepti Agrawal
Last updated 3 Nov 2026
Base year 2025 PDF + Excel
Key findings
Private AI Factories Move Inference Next to Company Data
Private Suites in Colocation Replace Owned Halls
Hyperscale Builders Absorb US Construction Capacity
GPU Clusters for Inference in Leased Suites
What is inside the report
- 01Introduction
- 02Executive Summary
- 03Market Scope
- 04Why Market Estimates Differ
- 05Market Drivers
- 06Market Trends
- 07Market Challenges
- 08Market Opportunities
- 09Pricing Analysis
- 10Standards and Regulation
- 18chapters
- 2020-2024Historical period
- 2026-2035Forecast period
- 15Companies profiled
Segmentation
Companies profiled
- Dell Technologies
- Hewlett Packard Enterprise (HPE)
- Lenovo
- Cisco
- Supermicro
- NetApp
- Everpure (formerly Pure Storage)
- Nutanix
- Broadcom (VMware)
- IBM
- NVIDIA
- Equinix
- Digital Realty
- Schneider Electric
- Vertiv
Recent developments
the U.S. Census Bureau put private data center construction at a USD 96.46 billion annual rate for September 2026 (Source: U.S. Census Bureau).
Dell Technologies reported Infrastructure Solutions Group revenue of USD 31.8 billion, up 89%, and AI orders of USD 60.9 billion (Source: Dell Technologies).
HPE said enterprise AI demand more than doubled and AI systems orders reached USD 2.4 billion (Source: HPE).
the European Commission published its first data center energy report: 770 sites reported, average PUE 1.36 (Source: European Commission).
Nutanix reported fiscal 2026 annual recurring revenue of USD 2.55 billion, up 16% (Source: Nutanix).
Dell Technologies said more than 4,000 customers were deploying the Dell AI Factory (Source: Dell Technologies).
Full analysis
The Enterprise Data Center Market is valued at USD 230.69 billion in 2026 and is projected to reach USD 405.42 billion by 2035, up from USD 213.21 billion in 2025, a CAGR of 6.64% from 2025 to 2035 (DC Market Insights estimate). Enterprises are splitting their estates in two: owned server rooms stop growing, while private AI clusters and regulated systems move into leased colocation suites, so the colocation and private-suite share of enterprise data center spending rises from 48.80% in 2025 to 61.77% by 2035. The swing shows in supplier results: Hewlett Packard Enterprise (HPE) said in September 2026 that enterprise AI demand more than doubled in its third fiscal quarter, and Dell Technologies reported traditional server and networking revenue of USD 10.5 billion in the quarter to July 2026, up 122%. The 2025 build receipt is 43,240 MW of conventional enterprise IT load × USD 2.90 million per MW-year of IT hardware, plus 2,760 MW of enterprise AI load × USD 8.30 million, plus 18,400 MW of leased capacity × USD 195 per kW-month, plus facility and construction spending of USD 21.85 billion. AI training and inference is the fastest workload at 18.60% a year, and Asia Pacific is the fastest region at 8.40% a year because India’s enterprise spend grows 12.90% a year under new data-protection rules.
Key Market Statistics: How Big Is the Enterprise Data Center Market in 2026?
The Enterprise Data Center Market reaches USD 230.69 billion in 2026, 8.20% above the USD 213.21 billion of 2025, according to DC Market Insights estimates.
- Market size 2025: USD 213.21 billion
- Market size 2026: USD 230.69 billion
- Market size 2030: USD 304.17 billion
- Market size 2035: USD 405.42 billion
- CAGR 2025-2035: 6.64% (low case 5.00%, high case 8.20%)
- Largest component: Servers and AI Systems, USD 88.44 billion in 2025 (41.48%)
- Fastest segment: AI Training and Inference workloads, 18.60% a year to USD 160.42 billion
- Leading region: North America, 38.0% of 2025 spending; fastest region: Asia Pacific, 8.40% a year
- Largest country: United States, USD 71.43 billion in 2025; fastest large country: India, 12.90% a year
- Leading suppliers: Dell Technologies, HPE and Lenovo, with about 46% of enterprise server spending (DC Market Insights estimate)
Key Takeaways: What Matters Most in Enterprise Data Center Spending?
- Leased capacity wins because enterprises cannot build fast enough: the colocation and private-suite model grows 9.18% a year to USD 250.43 billion by 2035, while owned on-premises sites grow 3.17% a year.
- AI changes the cost per MW because an AI MW carries USD 8.30 million of IT hardware a year in 2025, against USD 2.90 million for a conventional MW.
- Seven industries explain two-thirds of the market because BFSI, manufacturing, government, telecom operators, retail, energy and healthcare spent USD 141.59 billion of the USD 213.21 billion in 2025.
- Facility spending stays small because enterprises lease rather than build: power, cooling and construction are USD 21.85 billion in 2025, 10.25% of the market.
Executive Summary: What Is the Enterprise Data Center Market Worth?
The Global Enterprise Data Center Market size was valued at USD 153.12 billion in 2020, reached USD 213.21 billion in 2025, and is anticipated to reach USD 405.42 billion by 2035, at a CAGR of 6.64% during the forecast period.
| Attribute | Value |
|---|---|
| Historical period | 2020-2024 |
| Base year | 2025 |
| Forecast period | 2026-2035 |
| Market size 2025 | USD 213.21 billion |
| Market size 2026 | USD 230.69 billion |
| CAGR 2025-2035 | 6.64% |
| Market size 2035 | USD 405.42 billion |
Enterprise data center spending grew 6.85% a year from 2020 to 2025 and grows 6.64% a year to 2035, slower than the overall Data Center Market at 14.27%, because hyperscale cloud builders take most new capacity. Enterprise IT load in use rises from 46,000 MW in 2025 to 66,000 MW in 2035, and the AI share of that load rises from 6% to 24%, which lifts average spending per MW in use from USD 4.63 million to USD 6.14 million.
Market Scope: What Counts as an Enterprise Data Center?
The Enterprise Data Center Market covers USD 213.21 billion of 2025 spending by companies and public bodies on the data center capacity they own or control for their own use.
Included
- Servers, AI systems, storage and data center networking bought for enterprise-owned or enterprise-leased capacity.
- Colocation and hosting fees paid by enterprises for cages, suites and private data halls.
- Power, cooling and other facility equipment in enterprise-owned sites, and construction and fit-out of those sites.
- Edge and branch server rooms in plants, stores, hospitals, offices and campuses.
Excluded
- Hyperscale cloud self-builds and the IT inside them, and public cloud services (infrastructure as a service) bought by enterprises.
- Colocation capacity leased to cloud providers, end-user PCs, software licences, electricity bills and telecom radio networks.
How the Segments Fit Together
Every dimension sums to the same Enterprise Data Center Market total each year: five components, three deployment models, two workload types, eight end-user industries, five regions and twelve leading countries. The seven named industries reuse the totals of the DC Market Insights industry editions, such as the BFSI Data Center Market, and the rest sits in Other Industries.
Why Do Enterprise Data Center Market Estimates Differ?
Enterprise Data Center Market estimates differ because the term covers anything from USD 21.85 billion of facility spending to all non-hyperscale capacity; DC Market Insights puts the market at USD 230.69 billion in 2026.
Narrow definitions count only the power, cooling and construction of enterprise-owned buildings. Broad definitions add colocation revenue earned from cloud providers, public cloud services bought by enterprises, software and end-user devices, so they come out well above this estimate. This edition keeps hyperscale cloud, public cloud subscriptions, software licences and electricity outside the scope, and it keeps small and mid-sized enterprises and public bodies inside it, because their server rooms and colocation cages are part of the same spending decision.
| Element | In this estimate | Why |
|---|---|---|
| Enterprise IT hardware (servers, storage, networking) | Yes, USD 148.30 billion in 2025 | Bought for capacity the enterprise controls |
| Enterprise colocation and hosting fees | Yes, USD 43.06 billion in 2025 | Replaces owned floor space |
| Facility equipment and construction in owned sites | Yes, USD 21.85 billion in 2025 | Owned-site capital and upkeep |
| Hyperscale cloud campuses | No | Built by cloud providers, not enterprises |
| Public cloud subscriptions and software licences | No | Services, not data center capacity |
| Electricity bills | No | Operating cost, counted in utility markets |
Market Drivers: Why Are Enterprises Still Investing in Their Own Data Centers?
Enterprise Data Center Market spending rises by USD 192.21 billion between 2025 and 2035, driven by private AI, data-residency rules and private-cloud re-platforming.
Private AI Factories Move Inference Next to Company Data
Dell Technologies said in March 2026 that more than 4,000 customers were deploying the Dell AI Factory, and HPE reported in its third fiscal quarter of 2026 that enterprise AI demand more than doubled and that orders for HPE Private Cloud AI grew at triple-digit rates. In the Enterprise Data Center Market, AI training and inference grows from USD 29.14 billion in 2025 to USD 160.42 billion by 2035, because each AI MW carries USD 8.30 million of IT hardware a year against USD 2.90 million for a conventional MW. Broadcom’s Private Cloud Outlook 2026 survey, published in May 2026, found that 56% of surveyed organisations run or plan to run production inference in a private cloud.
DORA and India’s DPDP Rules Keep Regulated Data Under Enterprise Control
The European Union Digital Operational Resilience Act (DORA), Regulation (EU) 2022/2554, has applied to banks and insurers since 17 January 2025 and makes them map and test every critical information and communication technology (ICT) provider, according to EUR-Lex. India’s Ministry of Electronics and Information Technology notified the Digital Personal Data Protection (DPDP) Rules on 14 November 2025 with an 18-month phased compliance timeline (Press Information Bureau, November 2025). Both rules favour capacity the enterprise can audit, which is why BFSI is the largest named industry at USD 33.49 billion in 2025 and India grows 12.90% a year.
VMware Licence Changes Push Private-Cloud Re-Platforming
Broadcom said in August 2025 that nine of the top ten Fortune 500 companies had committed to VMware Cloud Foundation (VCF), and Nutanix reported annual recurring revenue of USD 2.55 billion for fiscal 2026, up 16%, with more than 3,000 new customers (Nutanix, August 2026). Each re-platforming project triggers a server and storage refresh, which keeps storage and networking spending in the Enterprise Data Center Market growing 4.29% a year to USD 91.12 billion by 2035.
Market Trends: How Is the Enterprise Data Center Estate Changing?
The Enterprise Data Center Market is moving from owned rooms to leased suites: the colocation and private-suite model rises from 48.80% of spending in 2025 to 61.77% in 2035.
Private Suites in Colocation Replace Owned Halls
Equinix reported more than 10,500 customers across 280 data centers in 77 markets at the end of 2025 (Equinix annual report, February 2026). Enterprise colocation and private suites grow from USD 104.05 billion in 2025 to USD 250.43 billion by 2035 in the Enterprise Data Center Market, because a leased 2 MW suite with liquid-cooling options is ready in months, while an owned hall needs land, a grid connection and a multi-year build. The enterprise share of leased capacity is 57.83% of the 2025 Data Center Colocation Market.
The 2026 Server Refresh Lifts Conventional Hardware Too
Dell Technologies reported record traditional server and networking revenue of USD 10.5 billion in its second quarter of fiscal 2027, up 122%, and storage revenue of USD 4.9 billion, up 26% (Dell Technologies results, September 2026). HPE server revenue reached USD 6.8 billion in its third quarter of fiscal 2026, up 35.3% (HPE results, September 2026). In the Enterprise Data Center Market, IT spending per conventional MW rises from USD 2.90 million a year in 2025 to USD 3.10 million in 2030 as general-purpose servers are consolidated onto fewer, denser machines.
Energy Reporting Exposes Small-Site Inefficiency
The European Commission’s first report on data center energy performance, published in September 2026, says 770 data centers reported under the Energy Efficiency Directive and that the average reported power usage effectiveness (PUE) was 1.36 in 2024, while sites of 500 to 1,000 kW averaged 1.64 (European Commission, COM(2026) 500). Enterprise sites dominate that small-site band, so the report adds pressure to move workloads from owned rooms into efficient colocation halls in the Enterprise Data Center Market.
Market Challenges: What Holds Back Enterprise Data Center Projects?
Enterprise Data Center Market construction spending is only USD 6.67 billion in 2025, because enterprises compete with hyperscale builders for power, sites and contractors.
Hyperscale Builders Absorb US Construction Capacity
The U.S. Census Bureau’s construction spending release of 2 November 2026 put private data center construction at a seasonally adjusted annual rate of USD 96.46 billion in September 2026, against USD 50.70 billion a year earlier (U.S. Census Bureau). Most of that work is for cloud and AI campuses, so enterprise projects wait for electrical gear and crews; owned-site construction in the Enterprise Data Center Market grows only 5.34% a year to USD 11.22 billion by 2035.
Server Rooms Waste Power and Space
ENERGY STAR, the U.S. Environmental Protection Agency programme, states that embedded data centers (server rooms and closets under 50 kW) account for about half of all US data center energy use. Edge and branch server rooms still hold USD 22.92 billion of Enterprise Data Center Market spending in 2025, 10.75% of the total, and many of them have no metering, which makes cost and efficiency cases hard to prove.
Market Opportunities: Where Is the New Enterprise Data Center Money?
The two largest Enterprise Data Center Market opportunities are private AI clusters, worth USD 131.28 billion of added annual spending by 2035, and the consolidation of edge rooms.
GPU Clusters for Inference in Leased Suites
AI workloads add USD 131.28 billion of annual Enterprise Data Center Market spending between 2025 and 2035 (USD 29.14 billion to USD 160.42 billion). HPE reported AI systems orders of USD 2.4 billion in its third fiscal quarter of 2026, up more than 30% from the prior quarter, and Dell Technologies ended its second quarter of fiscal 2027 with a USD 95 billion AI backlog. The opportunity for colocation operators is the 2 to 10 MW private AI suite with direct liquid cooling, priced above the USD 195 per kW-month enterprise average of 2025.
Consolidating Edge Rooms Into Fewer Sites
The U.S. Government Accountability Office (GAO) reported in February 2023 that federal agencies closed 58 data centers in fiscal 2021 and claimed USD 6.6 billion of savings and cost avoidance from 2012 to 2021. Corporate estates follow the same path: edge and branch server rooms grow only 4.96% a year in the Enterprise Data Center Market to USD 37.20 billion by 2035, while consolidation projects move their load into owned cores and colocation.
Pricing: What Does Enterprise Data Center Capacity Cost per MW?
Enterprise Data Center Market spending averages USD 4.63 million per MW of IT load in use in 2025, rising to USD 6.14 million by 2035 as the AI share of load rises from 6% to 24%.
| Price point | 2020 | 2025 | 2030 | 2035 |
|---|---|---|---|---|
| IT hardware per conventional MW-year (USD million) | 2.60 | 2.90 | 3.10 | 3.30 |
| IT hardware per AI MW-year (USD million) | 9.00 | 8.30 | 7.60 | 7.00 |
| Enterprise colocation (USD per kW-month) | 175 | 195 | 215 | 230 |
| Facility power and cooling per owned MW-year (USD million) | 0.50 | 0.55 | 0.60 | 0.64 |
| Construction and fit-out per MW in use (USD million) | 0.120 | 0.145 | 0.160 | 0.170 |
| Average spending per MW in use (USD million) | 3.83 | 4.63 | 5.53 | 6.14 |
Public anchors: Dell Technologies’ traditional server and networking revenue of USD 10.5 billion a quarter and storage revenue of USD 4.9 billion a quarter, and Equinix’s base of more than 10,500 customers, frame the hardware and colocation lines. Sales in this market go by quote; this report states market rates, not supplier list prices.
Standards and Regulation: Which Rules Shape Enterprise Data Centers?
Five rule sets shape the Enterprise Data Center Market, led by European energy reporting that covers sites of 500 kW and above.
- Energy Efficiency Directive (EU) 2023/1791, Article 12, and Delegated Regulation (EU) 2024/1364 (14 March 2024): sites of 500 kW and above report energy, PUE, water and waste heat each year; 770 sites reported in the first period (European Commission, September 2026).
- Digital Operational Resilience Act, Regulation (EU) 2022/2554, applying since 17 January 2025 to financial entities and their ICT providers (EUR-Lex).
- U.S. Office of Management and Budget memorandum M-19-19 (25 June 2019): federal agencies need approval for new or expanded agency-owned data centers (White House, June 2019).
- India Digital Personal Data Protection Rules, 2025 (14 November 2025): 18-month phased compliance and possible localisation for significant data fiduciaries (Press Information Bureau).
- ASHRAE Standard 90.4 and EN 50600 set energy and design rules for enterprise halls, and ENERGY STAR labels servers and storage.
Market Segmentation: Which Segments Lead the Enterprise Data Center Market?
Servers and AI systems lead the Enterprise Data Center Market with USD 88.44 billion in 2025, and AI training and inference is the fastest segment at 18.60% a year.
By Component
| Component | 2025 (USD m) | Share 2025 | 2035 (USD m) | CAGR |
|---|---|---|---|---|
| Servers and AI Systems | 88,439.60 | 41.48% | 185,288.40 | 7.68% |
| Storage and Networking | 59,864.40 | 28.08% | 91,119.60 | 4.29% |
| Colocation and Hosting | 43,056.00 | 20.19% | 98,366.40 | 8.61% |
| Facility Power and Cooling | 15,180.00 | 7.12% | 19,430.40 | 2.50% |
| Construction and Fit-Out | 6,670.00 | 3.13% | 11,220.00 | 5.34% |
By Deployment Model
| Deployment model | 2025 (USD m) | Share 2025 | 2035 (USD m) | CAGR |
|---|---|---|---|---|
| Enterprise Colocation and Private Suites | 104,045.10 | 48.80% | 250,431.72 | 9.18% |
| On-Premises Owned Data Centers | 86,240.27 | 40.45% | 117,794.74 | 3.17% |
| Edge and Branch Server Rooms | 22,924.63 | 10.75% | 37,198.34 | 4.96% |
By Workload
| Workload | 2025 (USD m) | Share 2025 | 2035 (USD m) | CAGR |
|---|---|---|---|---|
| Conventional Enterprise Workloads | 184,071.02 | 86.33% | 245,002.35 | 2.90% |
| AI Training and Inference | 29,138.98 | 13.67% | 160,422.45 | 18.60% |
By End-User Industry
| Industry | 2025 (USD m) | Share 2025 | 2035 (USD m) | CAGR |
|---|---|---|---|---|
| BFSI | 33,489.05 | 15.71% | 78,739.04 | 8.93% |
| Manufacturing | 21,062.98 | 9.88% | 48,788.20 | 8.76% |
| Government and Defense | 19,357.26 | 9.08% | 38,357.40 | 7.08% |
| Telecom Operators | 18,541.91 | 8.70% | 38,509.60 | 7.58% |
| Retail | 17,096.84 | 8.02% | 36,802.97 | 7.97% |
| Energy and Utilities | 16,580.00 | 7.78% | 38,420.00 | 8.77% |
| Healthcare | 15,463.20 | 7.25% | 37,112.60 | 9.15% |
| Other Industries | 71,618.76 | 33.59% | 88,694.99 | 2.16% |
Healthcare is the fastest named industry at 9.15% a year, and Other Industries (media, education, transport, professional and IT services) grow 2.16% a year because those buyers move more of their workloads to public cloud.
DC Exclusive: The Enterprise Spend Ledger, 7 Industries and USD 141.59 Billion
The Enterprise Spend Ledger is a DC Market Insights model built on 9 inputs: the 2025 and 2035 totals of seven DC Market Insights industry editions plus this edition’s market total, so readers can see how much of the Enterprise Data Center Market each industry holds.
| Industry edition | 2025 (USD billion) | 2035 (USD billion) | CAGR | Main spending reason |
|---|---|---|---|---|
| BFSI | 33.49 | 78.74 | 8.93% | DORA testing and trading latency |
| Manufacturing | 21.06 | 48.79 | 8.76% | Plant edge rooms and AI quality inspection |
| Government and Defense | 19.36 | 38.36 | 7.08% | Sovereign hosting and consolidation |
| Telecom Operators | 18.54 | 38.51 | 7.58% | Network cloud and 5G cores |
| Retail | 17.10 | 36.80 | 7.97% | Store edge and payment security |
| Energy and Utilities | 16.58 | 38.42 | 8.77% | Grid control and seismic computing |
| Healthcare | 15.46 | 37.11 | 9.15% | Imaging archives and clinical AI |
| Seven industries | 141.59 | 316.73 | 8.38% | 66.41% of the market in 2025, 78.12% in 2035 |
The ledger shows that regulated and operational industries gain share: their combined spending grows 8.38% a year, against 6.64% for the whole Enterprise Data Center Market, because their data cannot move freely into public cloud. Readers of the Manufacturing Data Center Market edition can trace the plant-edge line directly into this total.
Regional Insights: Which Region Spends Most on Enterprise Data Centers?
North America leads the Enterprise Data Center Market with USD 81.02 billion in 2025 (38.0%), and Asia Pacific grows fastest at 8.40% a year to USD 133.79 billion by 2035.
| Region | 2025 (USD m) | Share 2025 | 2035 (USD m) | CAGR |
|---|---|---|---|---|
| North America | 81,019.80 | 38.0% | 141,898.68 | 5.76% |
| Asia Pacific | 59,698.80 | 28.0% | 133,790.18 | 8.40% |
| Europe | 55,434.60 | 26.0% | 93,247.70 | 5.34% |
| Latin America | 9,594.45 | 4.5% | 20,271.24 | 7.77% |
| Middle East and Africa | 7,462.35 | 3.5% | 16,216.99 | 8.07% |
North America
North American enterprise spending of USD 81.02 billion in 2025 is led by the United States, where the Lawrence Berkeley National Laboratory (LBNL) counted 176 TWh of data center electricity in 2023, 4.4% of national use, with enterprise rooms a large part of the older base.
Europe
European enterprise spending of USD 55.43 billion in 2025 grows 5.34% a year; the European Commission expects EU data center electricity to rise from 68 TWh in 2024 to 114 TWh by 2030, and 52.7% of EU enterprises already bought cloud services in 2025 (Eurostat, February 2026), which caps owned-site growth.
Asia Pacific
Asia Pacific enterprise spending rises from USD 59.70 billion in 2025 to USD 133.79 billion in 2035, the fastest at 8.40% a year, led by China (USD 22.39 billion) and India, where the DPDP Rules keep regulated data in domestic facilities.
Latin America
Latin American enterprise spending of USD 9.59 billion in 2025 grows 7.77% a year, with Brazil at USD 4.26 billion as banks and retailers move from owned rooms into São Paulo colocation.
Middle East and Africa
Middle East and Africa enterprise spending of USD 7.46 billion in 2025 grows 8.07% a year as government and banking data-residency rules in the Gulf favour local capacity.
Country Analysis: Which Countries Lead Enterprise Data Center Spending?
The United States leads the Enterprise Data Center Market with USD 71.43 billion in 2025, and India is the fastest large country at 12.90% a year.
| Rank | Country | Region | 2025 (USD m) | 2035 (USD m) | CAGR |
|---|---|---|---|---|---|
| 1 | United States | North America | 71,425.35 | 123,654.56 | 5.64% |
| 2 | China | Asia Pacific | 22,387.05 | 48,650.98 | 8.07% |
| 3 | Japan | Asia Pacific | 11,726.55 | 19,460.39 | 5.20% |
| 4 | Germany | Europe | 10,660.50 | 17,433.27 | 5.04% |
| 5 | United Kingdom | Europe | 9,807.66 | 16,622.42 | 5.42% |
| 6 | France | Europe | 6,822.72 | 11,351.89 | 5.22% |
| 7 | Canada | North America | 6,396.30 | 10,946.47 | 5.52% |
| 8 | India | Asia Pacific | 5,543.46 | 18,649.54 | 12.90% |
| 9 | South Korea | Asia Pacific | 4,690.62 | 9,324.77 | 7.11% |
| 10 | Brazil | Latin America | 4,264.20 | 9,324.77 | 8.14% |
| 11 | Australia | Asia Pacific | 4,050.99 | 7,297.65 | 6.06% |
| 12 | Italy | Europe | 3,837.78 | 6,486.80 | 5.39% |
India’s enterprise spending more than triples from USD 5.54 billion in 2025 to USD 18.65 billion in 2035, because banks, insurers and large platforms must hold personal data under the DPDP Rules and build private AI capacity in Mumbai, Chennai and Hyderabad.
Forecast Scenarios: How Large Could the Enterprise Data Center Market Be in 2035?
The Enterprise Data Center Market reaches USD 405.42 billion by 2035 in the base case, within a range of USD 347.30 billion to USD 468.90 billion.
| Scenario | 2035 (USD m) | CAGR 2025-2035 | Assumption |
|---|---|---|---|
| Low | 347,296.62 | 5.00% | Enterprise AI stays in public cloud; AI share of load 18% by 2035 |
| Base | 405,424.80 | 6.64% | AI share of load 24% by 2035; leased share 54% |
| High | 468,899.94 | 8.20% | Private AI suites spread to mid-sized firms; AI share near 30% |
Competitive Insights: Who Are the Leading Enterprise Data Center Suppliers?
Dell Technologies, HPE and Lenovo hold about 46% of Enterprise Data Center Market server spending in 2025 (DC Market Insights estimate, based on their reported server revenue and enterprise customer mix).
- Dell Technologies
- Hewlett Packard Enterprise (HPE)
- Lenovo
- Cisco
- Supermicro
- NetApp
- Everpure (formerly Pure Storage)
- Nutanix
- Broadcom (VMware)
- IBM
- NVIDIA
- Equinix
- Digital Realty
- Schneider Electric
- Vertiv
Lenovo reported record Infrastructure Solutions Group revenue of USD 8.5 billion in its first quarter of fiscal 2026/27, up 98% (Lenovo, August 2026). HPE counted 52,000 GreenLake customers in its third quarter of fiscal 2026, up 18% (HPE, September 2026). NetApp reported fiscal 2026 revenue of USD 6.93 billion, up 5% (NetApp, May 2026), and Everpure reported fiscal 2026 revenue above USD 3.6 billion, up 16% (Everpure, February 2026). Cisco reported fiscal 2026 revenue of USD 63.3 billion, up 12% (Cisco, August 2026), and Supermicro reported fiscal 2026 net sales of USD 39.1 billion and said it added several hundred enterprise and other customers (Supermicro, August 2026).
Recent Developments: What Changed in Enterprise Data Centers in 2026?
Six dated events from 2026 shape the Enterprise Data Center Market outlook, led by record enterprise server results.
- In November 2026, the U.S. Census Bureau put private data center construction at a USD 96.46 billion annual rate for September 2026 (Source: U.S. Census Bureau).
- In September 2026, Dell Technologies reported Infrastructure Solutions Group revenue of USD 31.8 billion, up 89%, and AI orders of USD 60.9 billion (Source: Dell Technologies).
- In September 2026, HPE said enterprise AI demand more than doubled and AI systems orders reached USD 2.4 billion (Source: HPE).
- In September 2026, the European Commission published its first data center energy report: 770 sites reported, average PUE 1.36 (Source: European Commission).
- In August 2026, Nutanix reported fiscal 2026 annual recurring revenue of USD 2.55 billion, up 16% (Source: Nutanix).
- In March 2026, Dell Technologies said more than 4,000 customers were deploying the Dell AI Factory (Source: Dell Technologies).
Methodology: How Is the Enterprise Data Center Market Sized?
The Enterprise Data Center Market model starts from 46,000 MW of enterprise IT load in use in 2025 and prices five spending lines to reach USD 213.21 billion.
Inputs: enterprise IT load in use of 40,000 MW (2020), 46,000 MW (2025), 55,000 MW (2030) and 66,000 MW (2035); leased share 32%, 40%, 48% and 54%; AI share of load 1.5%, 6%, 16% and 24%; unit prices as in the pricing table. The 2025 lines are IT hardware USD 148.30 billion (43,240 conventional MW × USD 2.90 million + 2,760 AI MW × USD 8.30 million), colocation USD 43.06 billion (18,400 MW × USD 195 per kW-month), owned-site facility equipment USD 15.18 billion (27,600 MW × USD 0.55 million) and construction USD 6.67 billion (46,000 MW × USD 0.145 million). Three bound checks:
- Ceiling 1: USD 213.21 billion is 37.40% of the DC Market Insights global Data Center Market of USD 570.04 billion in 2025, leaving the rest to hyperscale and cloud.
- Ceiling 2: the USD 43.06 billion colocation line is 57.83% of the USD 74.46 billion Data Center Colocation Market in 2025.
- Floor: annualised 2026 revenue of Dell Technologies traditional servers and networking (USD 42.0 billion) and storage (USD 19.6 billion), HPE servers (USD 27.2 billion), NetApp (USD 6.93 billion), Everpure (USD 3.6 billion) and Nutanix (USD 2.85 billion) sums to USD 102.18 billion, below the USD 148.30 billion IT hardware line that also includes Lenovo, Cisco, Supermicro, IBM and others.
Every split sums to the total each year, and the CAGR is recomputed from the 2025 and 2035 endpoints. Full rules are on the research methodology page.
Table of contents
- 01Introduction
- 1.1Report Description
- 1.2Key Market Statistics, 2025, 2026, 2030 and 2035
- 1.3Key Takeaways
- 02Executive Summary
- 2.1Market Snapshot, 2025, 2026 and 2035
- 2.2Market Size Chart, 2020-2035
- 03Market Scope
- 3.1Included
- 3.2Excluded
- 3.3How the Segments Fit Together
- 04Why Market Estimates Differ
- 4.1Scope Table: In and Out of This Estimate
- 05Market Drivers
- 5.1Private AI Factories Move Inference Next to Company Data
- 5.2DORA and India's DPDP Rules Keep Regulated Data Under Enterprise Control
- 5.3VMware Licence Changes Push Private-Cloud Re-Platforming
- 06Market Trends
- 6.1Private Suites in Colocation Replace Owned Halls
- 6.2The 2026 Server Refresh Lifts Conventional Hardware Too
- 6.3Energy Reporting Exposes Small-Site Inefficiency
- 07Market Challenges
- 7.1Hyperscale Builders Absorb US Construction Capacity
- 7.2Server Rooms Waste Power and Space
- 08Market Opportunities
- 8.1GPU Clusters for Inference in Leased Suites
- 8.2Consolidating Edge Rooms Into Fewer Sites
- 09Pricing Analysis
- 9.1Price per MW, 2020-2035
- 9.2Public Price Anchors
- 10Standards and Regulation
- 10.1Energy Efficiency Directive and Delegated Regulation (EU) 2024/1364
- 10.2Digital Operational Resilience Act
- 10.3OMB Memorandum M-19-19
- 10.4India DPDP Rules 2025
- 10.5ASHRAE 90.4, EN 50600 and ENERGY STAR
- 11Market Segmentation
- 11.1By Component
- 11.2Servers and AI Systems
- 11.3Storage and Networking
- 11.4Colocation and Hosting
- 11.5Facility Power and Cooling
- 11.6Construction and Fit-Out
- 11.7By Deployment Model
- 11.8Enterprise Colocation and Private Suites
- 11.9On-Premises Owned Data Centers
- 11.10Edge and Branch Server Rooms
- 11.11By Workload
- 11.12Conventional Enterprise Workloads
- 11.13AI Training and Inference
- 11.14By End-User Industry
- 11.15BFSI
- 11.16Manufacturing
- 11.17Government and Defense
- 11.18Telecom Operators
- 11.19Retail
- 11.20Energy and Utilities
- 11.21Healthcare
- 11.22Other Industries
- 12DC Exclusive: The Enterprise Spend Ledger, 7 Industries and USD 141.59 Billion
- 12.1Spend Ledger by Industry, 2025 and 2035
- 12.2Share of Regulated and Operational Industries
- 13Regional Insights
- 13.1North America
- 13.2Europe
- 13.3Asia Pacific
- 13.4Latin America
- 13.5Middle East and Africa
- 14Country Analysis
- 14.1United States
- 14.2China
- 14.3Japan
- 14.4Germany
- 14.5United Kingdom
- 14.6France
- 14.7Canada
- 14.8India
- 14.9South Korea
- 14.10Brazil
- 14.11Australia
- 14.12Italy
- 15Forecast Scenarios, 2035
- 15.1Low Scenario
- 15.2Base Scenario
- 15.3High Scenario
- 16Competitive Insights
- 16.1Server Supplier Concentration, 2025
- 16.2Dell Technologies
- 16.3Hewlett Packard Enterprise (HPE)
- 16.4Lenovo
- 16.5Cisco
- 16.6Supermicro
- 16.7NetApp
- 16.8Everpure (formerly Pure Storage)
- 16.9Nutanix
- 16.10Broadcom (VMware)
- 16.11IBM
- 16.12NVIDIA
- 16.13Equinix
- 16.14Digital Realty
- 16.15Schneider Electric
- 16.16Vertiv
- 17Recent Developments
- 17.1US Census Data Center Construction Rate, November 2026
- 17.2Dell Technologies Q2 FY27 Results, September 2026
- 17.3HPE Q3 FY26 Results, September 2026
- 17.4European Commission Data Center Energy Report, September 2026
- 17.5Nutanix Fiscal 2026 Results, August 2026
- 17.6Dell AI Factory 4,000 Customers, March 2026
- 18Research Methodology
- 18.1Model Inputs
- 18.2Bound Checks
- Fig. 1Enterprise Data Center Market Size, 2020-2035 (USD billion)
- Table 1Market Snapshot, 2025, 2026 and 2035
- Table 2Scope Table: In and Out of This Estimate
- Table 3Price per MW, 2020-2035
- Table 4Market by Component, 2025 and 2035
- Table 5Market by Deployment Model, 2025 and 2035
- Table 6Market by Workload, 2025 and 2035
- Table 7Market by End-User Industry, 2025 and 2035
- Table 8Enterprise Spend Ledger by Industry
- Table 9Market by Region, 2025 and 2035
- Table 10Top 12 Countries, 2025 and 2035
- Table 112035 Forecast Scenarios
About this report
Written by Amit Jain and reviewed by Deepti Agrawal, Senior Editor, Research. Figures are built top-down and bottom-up and reconciled before publication, with 2025 as the base year.
Read our methodologyHow we built this
- Historical period2020-2024
- Base year2025
- Forecast period2026-2035
- Sizing approachTop-down + bottom-up
Need more than the report?
Advisory on this market
Due diligence, site selection and market entry work, by the analysts who wrote this report.
See consulting servicesFrequently asked questions
USD 230.69 billion in 2026, up 8.20% from USD 213.21 billion in 2025, according to DC Market Insights estimates. The market is projected to reach USD 405.42 billion by 2035, a CAGR of 6.64% from 2025.
6.64% a year from 2025 to 2035, after 6.85% a year from 2020 to 2025, because enterprise IT load in use rises from 46,000 MW to 66,000 MW and the AI share of that load rises from 6% to 24%.
USD 213.21 billion of 2025 spending: IT hardware USD 148.30 billion, colocation and hosting USD 43.06 billion, facility power and cooling USD 15.18 billion and construction USD 6.67 billion. Hyperscale cloud campuses and public cloud subscriptions are excluded.
Yes. Enterprise colocation and private suites hold 48.80% of 2025 spending and 61.77% by 2035, growing 9.18% a year to USD 250.43 billion, while owned on-premises sites grow 3.17% a year.
USD 29.14 billion in 2025, 13.67% of the market, rising to USD 160.42 billion by 2035 at 18.60% a year. An AI MW carries USD 8.30 million of IT hardware a year against USD 2.90 million for a conventional MW.
BFSI, with USD 33.49 billion in 2025, followed by manufacturing at USD 21.06 billion and government and defense at USD 19.36 billion. Seven named industries spend USD 141.59 billion, 66.41% of the market.
North America, with 38.0% of 2025 spending and USD 71.43 billion in the United States. Asia Pacific grows fastest at 8.40% a year, and India is the fastest large country at 12.90% a year.
About USD 4.63 million per MW of IT load in use in 2025 across all lines, rising to USD 6.14 million by 2035. Enterprise colocation averaged USD 195 per kW-month in 2025 (DC Market Insights estimate).
Dell Technologies, HPE and Lenovo hold about 46% of enterprise server spending (DC Market Insights estimate). Cisco, Supermicro, NetApp, Everpure, Nutanix, Broadcom, Equinix and Digital Realty are other leading suppliers.
USD 230.69 billion in 2026 counts enterprise IT hardware, colocation fees and owned-site facilities. Narrow measures count only facility spending of about USD 22 billion, and wide ones add cloud subscriptions, software and devices.
Get this report
How do I get the full report?
Request a quote; we reply by email within one business day.
How and when will I receive the report?
By email, within 24–48 business hours of payment.
How can I pay?
Once you accept the quote, we email you a secure payment link.
Can I see a sample first?
Yes. Request a free sample and we will email it to you.
Can the report be tailored to my needs?
Yes. We can add countries, segments or data cuts. Talk to an analyst about the scope you need.
Can I get an invoice or pay against a purchase order?
Write to sales@dcmarketinsights.com and our team will help.