
Hyperscale Computing Market Size, Share & Forecast to 2035
Market at a glance
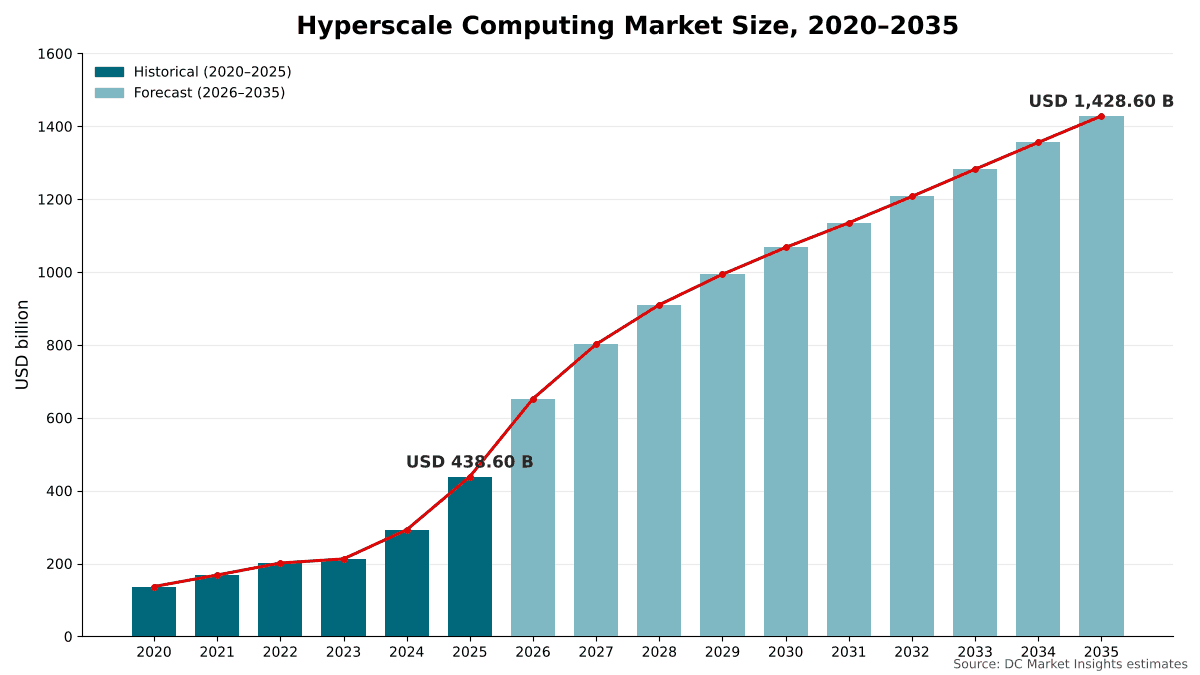
The Hyperscale Computing market was worth USD 438.60 billion in 2025 and is forecast to reach USD 1,428.60 billion by 2035, growing at a 12.53% CAGR. North America accounts for 64.5% of the market.
 By Amit Jain, Senior Consultant, ICT & Emerging Technologies
 Reviewed by Deepti Agrawal
Last updated 10 Oct 2026
Base year 2025 PDF + Excel
Reviewed by Deepti Agrawal
Last updated 10 Oct 2026
Base year 2025 PDF + Excel
Source: DC Market Insights analysis
Key findings
Amazon, Alphabet and Meta Guide to About USD 505 Billion of 2026 Capital Spending
Campuses Scale from Hundreds of Megawatts to Gigawatts
Grid Power Doubles Data Center Electricity Demand by 2030
Inference Overtakes Training by 2035
What is inside the report
- 01Introduction
- 02Research Methodology
- 03Executive Summary
- 04Market Dynamics
- 05Pricing and Cost Analysis
- 06Standards and Regulation
- 07Supply Chain Analysis
- 08Market Size and Forecast
- 09Hyperscale Computing Market, By Component
- 10Hyperscale Computing Market, By Operator Type
- 21chapters
- 2020-2024Historical period
- 2026-2035Forecast period
- 14Companies profiled
Regional insights
- North America64.5%
- Asia Pacific20.8%
- Europe9.6%
- Middle East and Africa3.4%
- Latin America1.7%
Segmentation
Companies profiled
- Amazon Web Services
- Microsoft
- Meta
- Oracle
- Alibaba Cloud
- Tencent
- ByteDance
- Apple
- Baidu
- Huawei Cloud
- OpenAI (Stargate)
- xAI
- CoreWeave
Recent developments
OpenAI, Oracle and SoftBank announced five new Stargate sites providing seven gigawatts of planned capacity over the next three years (Source: Axios report).
Meta formed a USD 27 billion joint venture with Blue Owl funds to finance its Hyperion campus in Louisiana (Source: DatacenterDynamics report).
Microsoft brought its Atlanta AI super factory online as part of its Fairwater network (Source: SiliconANGLE report).
Google announced USD 40 billion of investment in new data center campuses across Texas through 2027 (Source: TechRepublic report).
Oracle reported fiscal 2026 net cash capital spending of USD 48 billion and remaining performance obligations of USD 638 billion (Source: Nasdaq report).
Microsoft reported fiscal 2026 capital spending of USD 145.30 billion and 88 data centers brought online (Source: DatacenterDynamics report).
Full analysis
The Hyperscale Computing Market covers the capital spending of hyperscale operators on the data centers that run their clouds, platforms and AI models: servers and accelerated compute, storage, networking, power and cooling infrastructure, and building construction and fit-out, whether the campus is self-built or leased. DC Market Insights values the global Hyperscale Computing Market at USD 438.60 billion in 2025 and forecasts USD 1,428.60 billion by 2035, a CAGR of 12.53%. The 2025 value is built from capacity and spend per megawatt (MW): about 13.41 gigawatts (GW) of hyperscale IT capacity equivalent at a blended USD 32.69 million per MW, of which USD 338.00 billion is IT equipment and USD 100.60 billion is facility infrastructure. AI inference is the fastest-growing segment at 21.31% a year because every trained model is served for years across billions of requests, and the Middle East and Africa is the fastest-growing region at 15.83% a year as Gulf AI programs build hyperscale campuses from a small base.
Executive Summary
The Global Hyperscale Computing Market size was valued at USD 136.85 billion in 2020, reached USD 438.60 billion in 2025, and is anticipated to reach USD 1,428.60 billion by 2035, at a CAGR of 12.53% during the forecast period.
| Report attribute | Details |
|---|---|
| Historical Period | 2020-2024 |
| Base Year | 2025 |
| Forecast Period | 2026-2035 |
| Hyperscale Computing Market Size 2025 | USD 438.60 Billion |
| Hyperscale Computing Market, CAGR | 12.53% |
| Hyperscale Computing Market Size 2035 | USD 1,428.60 Billion |
The Hyperscale Computing Market grew at 26.23% a year between 2020 and 2025, and 2025 alone added 49.9% over 2024 as AI clusters moved from pilot halls to gigawatt campuses. Three operators disclosed calendar-2025 capital spending of USD 295.47 billion between them: Amazon USD 131.80 billion, Alphabet USD 91.45 billion and Meta USD 72.22 billion including principal payments on finance leases. NVIDIA reported fiscal 2026 data center revenue of USD 193.70 billion, up 68%, for the year ended January 25, 2026, and data center revenue of USD 89.00 billion, up 117%, for the quarter ended July 26, 2026 (Source: NVIDIA filing with the US Securities and Exchange Commission).
DC Market Insights forecasts USD 652.40 billion in 2026, a further 48.7% rise, in line with operator guidance: Amazon expects about USD 200 billion of capital spending in 2026, Alphabet targets USD 175 billion to USD 185 billion and Meta USD 115 billion to USD 135 billion. Growth then slows to 22.9% in 2027 and to between 5% and 10% a year from 2029, because the installed base becomes very large, accelerator prices rise more slowly and power connections, not demand, set the pace of new capacity. North America keeps 60.0% of value in 2035, down from 64.5% in 2025.
Market Scope: What Does the Hyperscale Computing Market Cover?
The Hyperscale Computing Market covers the data center capital spending of operators that run computing at hyperscale, valued at purchase in current US dollars, with 2025 as the base year and forecasts to 2035. DC Market Insights sizes it at USD 438.60 billion in 2025.
Included. Servers and accelerated compute, including AI servers with graphics processing units (GPUs) and custom accelerators; storage systems; data center networking, including switches, optics and AI cluster fabrics; power and cooling infrastructure such as switchgear, uninterruptible power supplies (UPS), generators, chillers and liquid cooling; and building construction and fit-out. The buyers are cloud service providers, internet and social media platforms, and AI labs and neoclouds that build or lease hyperscale capacity. Finance leases are included when the operator reports them as capital spending.
Excluded. Land, offices, logistics and retail assets, consumer devices, software licenses, electricity and other operating costs, and rent paid for colocation space under operating leases. The IT equipment and fit-out that an operator installs inside leased space is included.
How the segments fit together. The component, operator type, workload and facility model splits each re-cut the same USD 438.60 billion total for 2025. The AI part of this market overlaps with our AI Infrastructure Market report, which also counts enterprise and government AI buyers, and the building work overlaps with our Data Center Construction Market report, which counts every type of data center. Regions and countries are allocated by where the capacity is installed, not where the operator is headquartered.
Market Drivers: What Drives the Hyperscale Computing Market?
Three drivers explain most of the growth in the Hyperscale Computing Market, which DC Market Insights forecasts to add USD 990.00 billion of annual spending between 2025 and 2035: capital budgets that roughly double in 2026, contract backlogs that run years ahead of capacity, and AI demand that keeps the main supplier’s data center revenue more than doubling.
Amazon, Alphabet and Meta Guide to About USD 505 Billion of 2026 Capital Spending
The midpoints of 2026 guidance from Amazon (about USD 200 billion), Alphabet (USD 175 billion to USD 185 billion) and Meta (USD 115 billion to USD 135 billion) add up to about USD 505 billion, 70.9% more than the USD 295.47 billion the three companies spent in 2025. Microsoft spent USD 145.30 billion in its fiscal year to June 2026, including USD 41 billion in the final quarter. Not all of this is data center spending, since Amazon’s figure covers all of Amazon and not only AWS, but DC Market Insights estimates that 80% to 90% of hyperscaler capital spending now goes to data centers and the equipment inside them. DC Market Insights forecasts the market at USD 652.40 billion in 2026.
Contract Backlogs Run Ahead of Capacity
Operators are building against signed contracts. The AWS backlog stood at USD 244 billion at the end of 2025, up 40% year over year, and Oracle ended fiscal 2026 with remaining performance obligations of USD 638 billion, up 363%, while its cloud infrastructure revenue grew 93% in the fourth quarter of fiscal 2026. Google Cloud revenue rose 48% to USD 17.70 billion in the fourth quarter of 2025, and AWS revenue rose 24% to USD 35.60 billion in the same quarter. DC Market Insights reads these backlogs as committed demand for at least the next three years of construction.
AI Compute Demand Still Accelerated in 2026
NVIDIA’s data center revenue rose 117% to USD 89.00 billion in the quarter ended July 26, 2026, and the company guided third-quarter revenue to USD 108.00 billion, plus or minus 2%. DC Market Insights values servers and accelerated compute bought by hyperscale operators at USD 268.40 billion in 2025, 61.2% of the market, and forecasts USD 842.50 billion by 2035, a CAGR of 12.12%.
Market Trends: How Is Hyperscale Computing Changing?
Hyperscale computing is moving to gigawatt campuses, linked AI sites and more leased capacity, with leased and build-to-suit capacity growing at 13.57% a year against 12.12% for self-built campuses.
Campuses Scale from Hundreds of Megawatts to Gigawatts
Single sites now reach gigawatt scale. Meta’s Hyperion campus in Louisiana is a 2 GW development that can scale to 5 GW over several years, funded through a USD 27 billion joint venture in which Blue Owl funds own 80% and Meta 20%. AWS added 3.8 GW of capacity between October 2024 and October 2025, and Microsoft brought 88 data centers online in its fiscal year to June 2026, adding 1 GW in each of the last three quarters. DC Market Insights estimates that a hyperscale AI training hall cost about USD 51.80 million per MW in 2025, including the IT equipment.
AI Sites Are Linked into One Training System
Microsoft opened its Atlanta AI “super factory” in November 2025 as part of its Fairwater network and links it with a site in Wisconsin roughly 700 miles away; the facility will host hundreds of thousands of NVIDIA GPUs. Linking sites over long distances raises spending on optics and wide-area capacity, which is one reason DC Market Insights forecasts networking to grow fastest among components at 14.29% a year, from USD 41.70 billion to USD 158.60 billion.
Leased and Partner-Financed Capacity Grows Faster
Operators increasingly share the cost of buildings with investors and partners. Microsoft’s chief financial officer said that more of its future data center leases will shift from finance leases to operating leases, and in the Hyperion joint venture Blue Owl funds own 80% of the campus. DC Market Insights values IT equipment and fit-out in leased and build-to-suit capacity at USD 119.70 billion in 2025, 27.3% of the market, rising to 29.9% by 2035.
Market Challenges: What Holds the Hyperscale Computing Market Back?
Power supply and efficiency rules are the two constraints that DC Market Insights expects to keep the Hyperscale Computing Market below unconstrained demand, with the low scenario at USD 1,104.30 billion in 2035, 22.7% below the base case.
Grid Power Doubles Data Center Electricity Demand by 2030
The International Energy Agency (IEA) estimates that data centers used about 415 terawatt-hours (TWh) in 2024, around 1.5% of world electricity consumption, and that this will more than double to about 945 TWh by 2030 (Source: IEA Energy and AI report). The United States accounted for 45% of data center electricity use in 2024, China for 25% and Europe for 15%. Every hyperscale campus needs a grid connection or on-site generation before its servers can be installed, so DC Market Insights treats power delivery as the main swing factor between scenarios.
Efficiency Rules Raise the Cost of New Sites in Europe
Germany’s Energy Efficiency Act requires data centers that begin operations on or after July 1, 2026 to reach a power usage effectiveness (PUE) of 1.2 or lower and an energy reuse factor of at least 10%, and to cover 100% of their electricity with renewable power from January 1, 2027. DC Market Insights estimates that these rules add heat reuse and higher-efficiency cooling to each German campus, and forecasts Germany at 13.33% a year, slightly above the European rate of 13.18%.
Market Opportunities: Where Are the New Revenue Pools?
The two largest new revenue pools in the Hyperscale Computing Market are inference capacity, which grows from USD 96.30 billion to USD 664.90 billion, and AI labs and neoclouds, which grow at 18.31% a year.
Inference Overtakes Training by 2035
AI inference accounted for USD 96.30 billion, or 22.0% of 2025 spending, against USD 171.50 billion (39.1%) for training. DC Market Insights forecasts inference to grow at 21.31% a year to 46.5% of the 2035 market, because inference capacity scales with users and requests rather than with the number of frontier models trained. Inference halls cost less per MW than training halls in the DC Market Insights model, at about USD 36.40 million against USD 51.80 million, which widens the number of sites that suit them.
AI Labs and Neoclouds Become Hyperscale Buyers
AI labs now commission capacity at hyperscale. The Stargate program of OpenAI, Oracle and SoftBank announced five new US sites in September 2025 to provide seven gigawatts of planned capacity over the next three years, and said USD 400 billion of its USD 500 billion goal was lined up; the flagship site is in Abilene, Texas. DC Market Insights values spending by AI labs and neoclouds at USD 49.10 billion in 2025 and USD 263.90 billion by 2035, rising from 11.2% to 18.5% of the market.
Pricing: How Much Does Hyperscale Capacity Cost per MW?
Hyperscale capacity cost a blended USD 32.69 million per MW of IT load in 2025, including servers, storage, networking, power, cooling and the building, according to DC Market Insights estimates. Facility infrastructure alone accounts for about USD 7.50 million per MW; the rest is IT equipment, which DC Market Insights assumes is refreshed every five to six years.
| Hall type (2025) | Spend per MW (USD million) | Capacity equivalent (GW) | Spend (USD billion) |
|---|---|---|---|
| AI training | 51.80 | 3.31 | 171.50 |
| AI inference | 36.40 | 2.65 | 96.30 |
| General-purpose cloud and enterprise | 22.90 | 7.46 | 170.80 |
| Total or blended | 32.69 | 13.41 | 438.60 |
Announced programs sit at the top of this range. Dividing the USD 400 billion lined up for Stargate by its seven gigawatts of planned capacity gives about USD 57 million per MW (DC Market Insights calculation), close to the DC Market Insights training-hall estimate because Stargate sites are built for frontier AI clusters.
Standards and Regulation: Which Rules Shape Hyperscale Data Centers?
Two sets of rules shape hyperscale data centers in Europe, the region that DC Market Insights values at USD 42.10 billion in 2025: the European Union (EU) reporting regulation for sites of 500 kW and above, and Germany’s PUE limit of 1.2 for new data centers.
EU Delegated Regulation 2024/1364. The EU data center rating regulation requires operators of data centers with an installed IT power demand of at least 500 kW to report 24 performance indicators covering energy and sustainability, information and communication technology, and data traffic, first by September 15, 2024, then by May 15, 2025 and every year after that.
German Energy Efficiency Act (EnEfG). New data centers that start operating on or after July 1, 2026 must achieve a PUE of 1.2 or lower and an energy reuse factor of at least 10%, and data centers covered by the Act must cover 50% of their electricity with renewable power from January 1, 2024 and 100% from January 1, 2027.
Capital spending disclosure. In the United States, hyperscale operators report capital spending in filings with the Securities and Exchange Commission, and the treatment of leases decides how much of a campus appears as capital spending: Microsoft and Meta include finance leases in the capital expenditures they report, while operating leases are not included. DC Market Insights adjusts for this by counting IT equipment installed in leased space.
Market Segmentation: Which Segment Leads the Hyperscale Computing Market?
Servers and accelerated compute lead the Hyperscale Computing Market with 61.2% of 2025 spending, cloud service providers lead operator types with 65.0%, and AI training leads workloads with 39.1%. AI inference is the fastest-growing segment at 21.31% a year, against 8.72% for training, because inference demand grows with every user, application and agent that calls a model.
By Component: Servers and Accelerated Compute Lead with 61.2%
| Component | 2025 (USD billion) | Share 2025 | 2035 (USD billion) | CAGR 2025-2035 |
|---|---|---|---|---|
| Servers and Accelerated Compute | 268.40 | 61.2% | 842.50 | 12.12% |
| Power and Cooling Infrastructure | 58.30 | 13.3% | 214.90 | 13.93% |
| Building Construction and Fit-Out | 42.30 | 9.6% | 138.30 | 12.58% |
| Networking | 41.70 | 9.5% | 158.60 | 14.29% |
| Storage | 27.90 | 6.4% | 74.30 | 10.29% |
Power and cooling infrastructure gains 1.7 points of share by 2035 because liquid cooling and higher rack densities add equipment to every MW, while storage loses share as AI spending grows faster than data volumes.
By Operator Type: Cloud Service Providers Lead with 65.0%
| Operator type | 2025 (USD billion) | Share 2025 | 2035 (USD billion) | CAGR 2025-2035 |
|---|---|---|---|---|
| Cloud Service Providers | 285.10 | 65.0% | 862.00 | 11.70% |
| Internet and Social Media Platforms | 104.40 | 23.8% | 302.70 | 11.23% |
| AI Labs and Neoclouds | 49.10 | 11.2% | 263.90 | 18.31% |
Cloud service providers include AWS, Microsoft, Google Cloud, Oracle and the Chinese cloud providers. Internet and social media platforms such as Meta and ByteDance build mainly for their own services, and AI labs and neoclouds buy compute at hyperscale for model training and GPU rental.
By Workload: AI Training Leads with 39.1%
| Workload | 2025 (USD billion) | Share 2025 | 2035 (USD billion) | CAGR 2025-2035 |
|---|---|---|---|---|
| AI Training | 171.50 | 39.1% | 395.80 | 8.72% |
| General-Purpose Cloud and Enterprise | 170.80 | 38.9% | 367.90 | 7.98% |
| AI Inference | 96.30 | 22.0% | 664.90 | 21.31% |
General-purpose cloud halls still made up about 7.46 GW of the 13.41 GW capacity equivalent in 2025, more than half, but at less than half the spend per MW of an AI training hall.
By Facility Model: Self-Built Campuses Lead with 72.7%
Self-built campuses account for USD 318.90 billion in 2025 and USD 1,001.30 billion by 2035, a CAGR of 12.12%. Leased and build-to-suit capacity, valued at the IT equipment and fit-out that operators install, accounts for USD 119.70 billion in 2025 and grows faster, at 13.57% a year, to USD 427.30 billion, as operators use partners to add capacity faster than they can build it alone.
DC Exclusive: The Hyperscale Operator Type × Component Matrix
Servers and accelerated compute bought by cloud service providers are the single largest cell of the matrix at USD 168.90 billion, 38.5% of all 2025 hyperscale spending. The matrix below cross-tabulates who spends and what they buy.
| 2025, USD billion | Compute | Storage | Networking | Power and Cooling | Construction and Fit-Out | Total |
|---|---|---|---|---|---|---|
| Cloud Service Providers | 168.90 | 20.60 | 25.40 | 39.60 | 30.60 | 285.10 |
| Internet and Social Media Platforms | 64.30 | 6.10 | 10.20 | 13.40 | 10.40 | 104.40 |
| AI Labs and Neoclouds | 35.20 | 1.20 | 6.10 | 5.30 | 1.30 | 49.10 |
| Total | 268.40 | 27.90 | 41.70 | 58.30 | 42.30 | 438.60 |
AI labs and neoclouds put 71.7% of their spending into compute and only 2.6% into construction and fit-out, against 59.2% and 10.7% for cloud service providers, because they lease most of their buildings from cloud partners and developers. Networking takes 12.4% of AI lab spending, the highest share of any operator type, since their clusters are built for large training jobs.
The matrix is a DC Market Insights model, not a count of purchase orders, built from 39 inputs: 16 annual market totals (2020 to 2035), 5 component totals and 3 operator-type totals for 2025, 3 spend-per-MW assumptions, 8 operator and supplier disclosures used as anchors and 4 capacity disclosures. The model and its assumptions are explained on our research methodology page.
Regional Insights: Which Region Leads the Hyperscale Computing Market?
North America leads the Hyperscale Computing Market with 64.5% of 2025 spending. The Middle East and Africa is the fastest-growing region at 15.83% a year, because Gulf AI programs are building hyperscale campuses from a small base (DC Market Insights estimate).
North America Leads with 64.5% Share
North America accounted for USD 282.90 billion of hyperscale spending in 2025 and is forecast to grow at 11.72% a year to USD 857.20 billion. The region holds several gigawatt campuses under construction, including Meta’s Hyperion in Louisiana, the Stargate sites announced in Texas, and Google’s USD 40 billion program for new Texas campuses through 2027.
Asia Pacific Holds 20.8% Share
Asia Pacific is worth USD 91.20 billion in 2025 and USD 330.10 billion by 2035, a CAGR of 13.73%. China is the largest country market in the region; Alibaba alone plans to invest at least RMB 380 billion (USD 53 billion) in AI and cloud infrastructure over three years, more than its total AI and cloud spending over the past decade. India and Malaysia grow fastest among the region’s large markets.
Europe Holds 9.6% Share
Europe is worth USD 42.10 billion in 2025 and USD 145.20 billion by 2035, a CAGR of 13.18%. The United Kingdom is the largest European market at USD 9.70 billion, ahead of Germany at USD 7.90 billion, where the PUE limit for new sites applies from July 2026.
Middle East and Africa Holds 3.4% Share
The Middle East and Africa is worth USD 14.90 billion in 2025 and USD 64.80 billion by 2035, the fastest regional growth at 15.83% a year. Saudi Arabia and the United Arab Emirates together account for 67.8% of the region in the DC Market Insights allocation.
Latin America Holds 1.7% Share
Latin America is worth USD 7.50 billion in 2025 and USD 31.30 billion by 2035, a CAGR of 15.36%, led by Brazil at USD 4.10 billion.
Country Analysis: Which Countries Get the Most Hyperscale Investment?
The United States is the largest country market for hyperscale computing at USD 270.30 billion in 2025, 61.6% of global spending, followed by China at USD 38.40 billion (8.8%) and Japan at USD 14.90 billion (3.4%). The 12 largest countries account for 89.5% of 2025 spending.
| Rank | Country | Region | 2025 (USD billion) | Share 2025 | 2035 (USD billion) | CAGR 2025-2035 |
|---|---|---|---|---|---|---|
| 1 | United States | North America | 270.30 | 61.6% | 815.40 | 11.67% |
| 2 | China | Asia Pacific | 38.40 | 8.8% | 121.60 | 12.22% |
| 3 | Japan | Asia Pacific | 14.90 | 3.4% | 47.30 | 12.25% |
| 4 | Canada | North America | 12.60 | 2.9% | 41.80 | 12.74% |
| 5 | India | Asia Pacific | 9.80 | 2.2% | 52.90 | 18.36% |
| 6 | United Kingdom | Europe | 9.70 | 2.2% | 32.10 | 12.71% |
| 7 | Germany | Europe | 7.90 | 1.8% | 27.60 | 13.33% |
| 8 | Malaysia | Asia Pacific | 7.60 | 1.7% | 29.80 | 14.64% |
| 9 | Australia | Asia Pacific | 7.10 | 1.6% | 24.70 | 13.28% |
| 10 | Saudi Arabia | Middle East and Africa | 5.30 | 1.2% | 25.90 | 17.19% |
| 11 | United Arab Emirates | Middle East and Africa | 4.80 | 1.1% | 21.70 | 16.28% |
| 12 | Brazil | Latin America | 4.10 | 0.9% | 17.60 | 15.68% |
India is the fastest-growing large country market at 18.36% a year, as global cloud providers and domestic operators build hyperscale regions from a small installed base, ahead of Saudi Arabia at 17.19%. The country figures are a DC Market Insights allocation of the regional totals, weighted by each country’s estimated share of hyperscale capacity under construction and of announced operator investment programs.
Forecast Scenarios: How Could the 2035 Forecast Change?
The Hyperscale Computing Market reaches USD 1,428.60 billion by 2035 in the base case, with a range of USD 1,104.30 billion to USD 1,742.80 billion across the low and high scenarios.
| Scenario | Assumption from 2026 | 2035 (USD billion) | CAGR 2025-2035 |
|---|---|---|---|
| Low | Two-year slip in grid connections for AI campuses; operator capital spending flat in real terms after 2028 | 1,104.30 | 9.67% |
| Base | 2026 guidance delivered; announced gigawatt campuses energized by 2030; inference reaches 46.5% of spending | 1,428.60 | 12.53% |
| High | Power, memory and advanced packaging supply keep pace with announced programs; AI labs reach a quarter of spending | 1,742.80 | 14.79% |
The spread between the low and high cases is USD 638.50 billion in 2035. Power delivery explains most of it, followed by the pace at which inference demand turns into new capacity rather than higher use of existing halls.
Competitive Insights: Who Leads the Hyperscale Computing Market?
- Amazon Web Services
- Microsoft
- Meta
- Oracle
- Alibaba Cloud
- Tencent
- ByteDance
- Apple
- Baidu
- Huawei Cloud
- OpenAI (Stargate)
- xAI
- CoreWeave
Amazon leads the Hyperscale Computing Market with about 24% of 2025 spending (DC Market Insights estimate: roughly 80% of its USD 131.80 billion of 2025 capital spending goes to data centers, set against the USD 438.60 billion total), and AWS said it added more data center capacity globally than any other company in 2025, including more than 1.2 GW in the fourth quarter. Amazon, Microsoft, Alphabet and Meta together account for about 77% of the market in the DC Market Insights estimate. Microsoft spent USD 145.30 billion in fiscal 2026 and added 1 GW of capacity in each of its last three quarters. Oracle’s net cash outlay for capital expenditures was USD 48 billion in fiscal 2026; it delivered more than 1.2 GW of capacity to customers and expects about USD 70 billion in fiscal 2027.
Recent Developments
- In September 2025, OpenAI, Oracle and SoftBank announced five new Stargate sites providing seven gigawatts of planned capacity over the next three years (Source: Axios report).
- In October 2025, Meta formed a USD 27 billion joint venture with Blue Owl funds to finance its Hyperion campus in Louisiana (Source: DatacenterDynamics report).
- In November 2025, Microsoft brought its Atlanta AI super factory online as part of its Fairwater network (Source: SiliconANGLE report).
- In November 2025, Google announced USD 40 billion of investment in new data center campuses across Texas through 2027 (Source: TechRepublic report).
- In June 2026, Oracle reported fiscal 2026 net cash capital spending of USD 48 billion and remaining performance obligations of USD 638 billion (Source: Nasdaq report).
- In July 2026, Microsoft reported fiscal 2026 capital spending of USD 145.30 billion and 88 data centers brought online (Source: DatacenterDynamics report).
We follow these deals, launches and capacity announcements as they happen in our data center industry updates.
Methodology: How We Built the Hyperscale Computing Market Model
DC Market Insights built this market bottom-up from capacity and spend per MW. The 2025 value equals about 3.31 GW of AI training capacity equivalent at USD 51.80 million per MW (USD 171.50 billion), 2.65 GW of AI inference capacity at USD 36.40 million per MW (USD 96.30 billion) and 7.46 GW of general-purpose cloud capacity at USD 22.90 million per MW (USD 170.80 billion), a total of 13.41 GW at a blended USD 32.69 million per MW. Capacity equivalent includes new halls and the IT refresh of existing halls. Four checks frame the result. A floor: the calendar-2025 capital spending of Amazon, Alphabet and Meta sums to USD 295.47 billion; at the 80% to 90% data center share that DC Market Insights estimates, these three operators alone account for about USD 236 billion to USD 266 billion before Microsoft, Oracle, the Chinese operators and the AI labs are added. A ceiling: the IEA puts global data center investment at half a trillion dollars in 2024, above the USD 292.58 billion that DC Market Insights values for hyperscale operators in that year. A supplier check: NVIDIA’s fiscal 2026 data center revenue of USD 193.70 billion, which also includes sales to enterprises and governments, is below the USD 268.40 billion of servers and accelerated compute that hyperscale operators bought in 2025. A capacity check: the AWS figure of 3.8 GW in a year, 1 GW a quarter at Microsoft and more than 1.2 GW at Oracle in fiscal 2026 are consistent with 13.41 GW of hyperscale capacity equivalent in 2025. The total was split by 5 components, 3 operator types, 3 workloads, 2 facility models, 5 regions and 12 countries, and every split sums to the market total. The analyst named on this page built the model, and the reviewer checked the arithmetic, the sources and the dates before publication.
Table of contents
- 01Introduction
- 1.1Market Definition and Scope
- 1.2Research Objectives
- 1.3Currency, Units and Years Considered
- 1.4Stakeholders
- 02Research Methodology
- 2.1Bottom-Up Capacity and Spend per MW Model
- 2.2Operator Capital Spending Anchors
- 2.3Bound Checks and Data Triangulation
- 2.4Assumptions and Limitations
- 03Executive Summary
- 3.1Market Size, 2020-2035
- 3.2Key Findings
- 3.3Analyst View
- 04Market Dynamics
- 4.1Drivers
- 4.2Trends
- 4.3Challenges
- 4.4Opportunities
- 05Pricing and Cost Analysis
- 5.1Spend per MW by Hall Type, 2025
- 5.2IT Equipment and Facility Cost Split
- 5.3Announced Program Cost Benchmarks
- 06Standards and Regulation
- 6.1EU Delegated Regulation 2024/1364
- 6.2German Energy Efficiency Act (EnEfG)
- 6.3Capital Spending and Lease Reporting
- 07Supply Chain Analysis
- 7.1Accelerator and Server Suppliers
- 7.2Power and Cooling Equipment Suppliers
- 7.3Construction Contractors and Developers
- 7.4Hyperscale Operators
- 08Market Size and Forecast
- 8.1Market Size, 2020-2035
- 8.2Year-on-Year Growth
- 8.3Capacity Equivalent, 2025
- 09Hyperscale Computing Market, By Component
- 9.1Servers and Accelerated Compute
- 9.2Storage
- 9.3Networking
- 9.4Power and Cooling Infrastructure
- 9.5Building Construction and Fit-Out
- 10Hyperscale Computing Market, By Operator Type
- 10.1Cloud Service Providers
- 10.2Internet and Social Media Platforms
- 10.3AI Labs and Neoclouds
- 11Hyperscale Computing Market, By Workload
- 11.1AI Training
- 11.2AI Inference
- 11.3General-Purpose Cloud and Enterprise
- 12Hyperscale Computing Market, By Facility Model
- 12.1Self-Built Campuses
- 12.2Leased and Build-to-Suit Capacity
- 13DC Exclusive: Operator Type × Component Matrix
- 13.1Matrix Values, 2025
- 13.2Key Observations
- 13.3Model Inputs
- 14Hyperscale Computing Market, By Region
- 14.1North America: United States, Canada
- 14.2Asia Pacific: China, Japan, India, Malaysia, Australia, Rest of Asia Pacific
- 14.3Europe: United Kingdom, Germany, Rest of Europe
- 14.4Middle East and Africa: Saudi Arabia, United Arab Emirates, Rest of Middle East and Africa
- 14.5Latin America: Brazil, Rest of Latin America
- 15Country Analysis
- 15.1Top 12 Countries, 2025 and 2035
- 15.2Fastest-Growing Countries
- 16Regional Cross-Sections
- 16.1Region by Component, 2025 and 2035
- 16.2Region by Operator Type, 2025 and 2035
- 17Forecast Scenarios
- 17.1Low Scenario
- 17.2Base Scenario
- 17.3High Scenario
- 18Competitive Landscape
- 18.1Operator Spending Shares, 2025
- 18.2Capital Spending Guidance, 2026
- 18.3Capacity Additions
- 19Company Profiles
- 19.1Amazon Web Services
- 19.2Microsoft
- 19.3Google
- 19.4Meta
- 19.5Oracle
- 19.6Alibaba Cloud
- 19.7Tencent
- 19.8ByteDance
- 19.9Apple
- 19.10Baidu
- 19.11Huawei Cloud
- 19.12OpenAI (Stargate)
- 19.13xAI
- 19.14CoreWeave
- 20Recent Developments
- 20.1Capacity and Campus Announcements
- 20.2Financing and Joint Ventures
- 21Analyst Recommendations
- 21.1For Hyperscale Operators
- 21.2For Equipment Suppliers
- 21.3For Investors and Developers
- Fig. 1Hyperscale Computing Market Size, 2020-2035
- Fig. 2Hyperscale Computing Market Share by Component, 2025
- Fig. 3Hyperscale Computing Market by Region, 2025 and 2035
- Fig. 4Spend per MW by Hall Type, 2025
- Fig. 5Forecast Scenarios, 2035
- Table 1Report Attributes
- Table 2Spend per MW by Hall Type, 2025
- Table 3Market by Component, 2025 and 2035
- Table 4Market by Operator Type, 2025 and 2035
- Table 5Market by Workload, 2025 and 2035
- Table 6Market by Facility Model, 2025 and 2035
- Table 7Operator Type × Component Matrix, 2025
- Table 8Market by Region, 2025 and 2035
- Table 9Top 12 Countries, 2025 and 2035
- Table 10Forecast Scenarios, 2035
- Table 11Operator Capital Spending Disclosures
About this report
Written by Amit Jain and reviewed by Deepti Agrawal, Senior Editor, Research. Figures are built top-down and bottom-up and reconciled before publication, with 2025 as the base year.
Read our methodologyHow we built this
- Historical period2020-2024
- Base year2025
- Forecast period2026-2035
- Sizing approachTop-down + bottom-up
Need more than the report?
Advisory on this market
Due diligence, site selection and market entry work, by the analysts who wrote this report.
See consulting servicesFrequently asked questions
USD 438.60 billion in 2025, rising to USD 1,428.60 billion by 2035. DC Market Insights estimates the market at USD 136.85 billion in 2020.
12.53% a year from 2025 to 2035. Growth was faster, at 26.23% a year, between 2020 and 2025, and DC Market Insights forecasts a further 48.7% rise to USD 652.40 billion in 2026.
Amazon Web Services, Microsoft, Google, Meta and Oracle lead, with Amazon at about 24% of 2025 spending (DC Market Insights estimate). Alibaba Cloud, Tencent, ByteDance, Apple, Baidu, Huawei Cloud, OpenAI (Stargate), xAI and CoreWeave also build at hyperscale.
Servers and accelerated compute, with USD 268.40 billion or 61.2% of 2025 spending. Networking grows fastest among components at 14.29% a year as AI clusters need larger fabrics.
About USD 32.69 million per MW blended in 2025, ranging from USD 22.90 million for a general-purpose cloud hall to USD 51.80 million for an AI training hall, according to DC Market Insights estimates including IT equipment.
AI training led with USD 171.50 billion or 39.1% of 2025 spending. AI inference is the fastest-growing segment at 21.31% a year and reaches 46.5% of spending by 2035.
North America, with USD 282.90 billion or 64.5% of 2025 spending. The Middle East and Africa grows fastest at 15.83% a year.
USD 270.30 billion in the United States, or 61.6% of 2025 spending, followed by China at USD 38.40 billion. India grows fastest among large country markets at 18.36% a year (DC Market Insights estimate).
Licences, delivery and payment
Which licence should I choose?
Single User is a view-only PDF for one person. Multi User adds a printable PDF and the Excel data for unlimited users at one location. Enterprise covers your whole company and includes 100 free analyst hours.
How and when will I receive the report?
By email, within 24–48 business hours of payment, in the formats of your licence.
How can I pay?
Securely through PayPal: with a PayPal account, a debit or credit card, or PayPal Pay Later where available. Prices are in US dollars.
Can I see a sample first?
Yes. Request a free sample and we will email it to you.
Can the report be tailored to my needs?
Yes. We can add countries, segments or data cuts. Talk to an analyst about the scope you need.
Can I get an invoice or pay against a purchase order?
Write to sales@dcmarketinsights.com and our team will help.