
Managed Data Center Services Market Size, Share & Forecast to 2035
Market at a glance
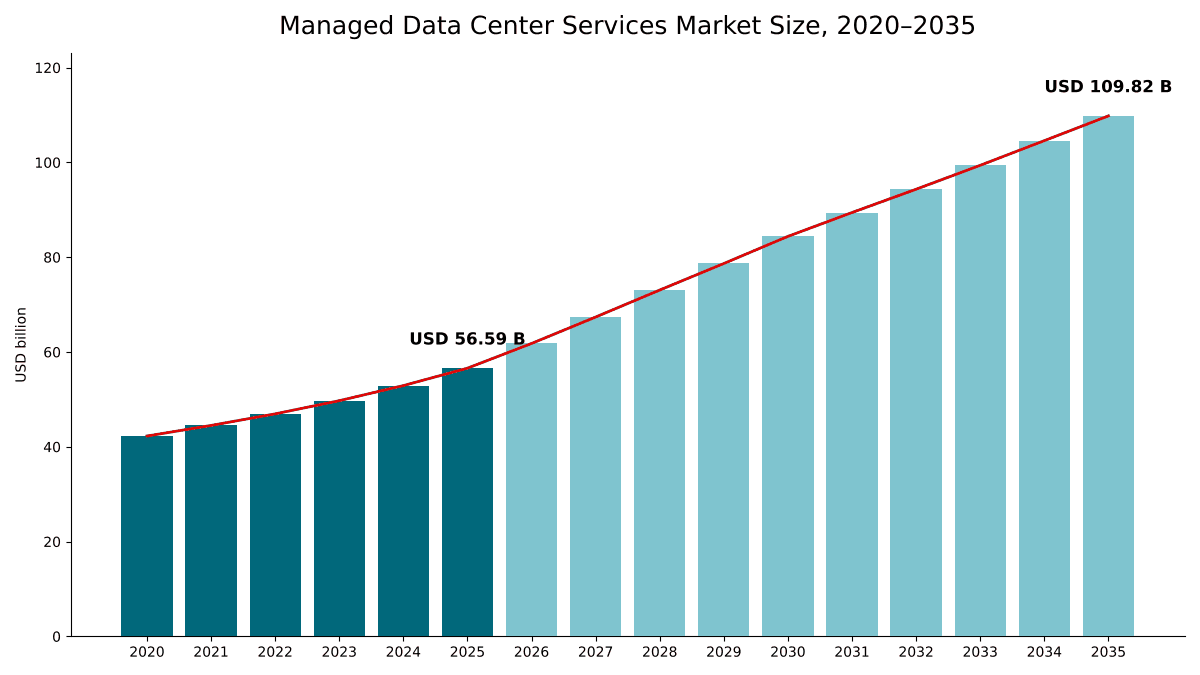
The Managed Data Center Services market was worth USD 56.59 billion in 2025 and is forecast to reach USD 109.82 billion by 2035, growing at a 6.85% CAGR. North America accounts for 41.8% of the market.
 By Amit Jain, Senior Consultant, ICT & Emerging Technologies
 Reviewed by Deepti Agrawal
Last updated 10 Oct 2026
Base year 2025 PDF + Excel
Reviewed by Deepti Agrawal
Last updated 10 Oct 2026
Base year 2025 PDF + Excel
Source: DC Market Insights analysis
Key findings
Installed Capacity Nearly Doubles to 200 GW by 2030, Adding USD 7.62 billion of Maintenance Revenue
Liquid Cooling Creates a New Maintenance Line
Public Cloud Erodes Managed Private Hosting
AI and GPU Cloud Providers Grow at 11.88% a Year
What is inside the report
- 01Introduction
- 02Research Methodology
- 03Executive Summary
- 04Market Dynamics
- 05Pricing Analysis
- 06Standards and Regulation
- 07Value Chain and Supply Analysis
- 08Market Size and Forecast
- 09Market by Service Type
- 10Market by Customer Type
- 21chapters
- 2020-2024Historical period
- 2026-2035Forecast period
- 16Companies profiled
Regional insights
- North America41.8%
- Europe26.4%
- Asia Pacific24.2%
- Latin America4.1%
- Middle East and Africa3.5%
Segmentation
Companies profiled
- Kyndryl
- IBM
- NTT DATA
- DXC Technology
- Rackspace Technology
- Accenture
- Fujitsu
- Park Place Technologies
- Hewlett Packard Enterprise
- Dell Technologies
- Vertiv
- Schneider Electric
- Eaton
- CBRE
- JLL
- Atos
Recent developments
the European Supervisory Authorities published the list of designated critical ICT third-party providers under the Digital Operational Resilience Act (Source: EIOPA press release).
Vertiv completed its acquisition of PurgeRite, a fluid management services provider, in a deal worth around USD 1.00 billion to bolster its liquid cooling services (Source: Data Centre Review news report).
Park Place Technologies completed its merger with Service Express, creating a company with more than 3,000 employees and over 20,000 customers (Source: Charlesbank press release).
Kyndryl reported fiscal 2026 hyperscaler-related revenue of USD 1.90 billion, up 59% year over year (Source: Kyndryl SEC filing).
CBRE reported a 30% increase in its data center solutions business in the second quarter, much of it from hyperscalers (Source: Facilities Dive news report).
Rackspace Technology launched Rackspace Cloud, a fully managed multitenant cloud platform built on VMware Cloud Foundation 9.1 (Source: StorageNewsletter news report).
Full analysis
The Managed Data Center Services Market covers the revenue that third parties earn for running, maintaining and monitoring data center infrastructure on behalf of its owner: managed hosting and infrastructure services, support and maintenance of servers, storage and network hardware, maintenance of power and cooling systems, critical facility management and operations, and remote monitoring and management. DC Market Insights values the global Managed Data Center Services Market at USD 56.59 billion in 2025 and forecasts USD 109.82 billion by 2035, a CAGR of 6.85%. The 2025 value is built from installed capacity and service spend: about 103 GW of operational data center capacity, at roughly USD 0.155 million per MW for IT hardware support and USD 0.086 million per MW for outsourced power and cooling maintenance, gives USD 24.85 billion of maintenance revenue; managed hosting and infrastructure services add USD 23.40 billion, facility management and operations USD 5.14 billion and remote monitoring and management USD 3.20 billion. Facility management and operations is the fastest-growing service at 13.04% a year because DC Market Insights expects owners of new campuses to hand day-to-day operation to specialist contractors when they cannot hire enough staff, and Asia Pacific is the fastest-growing region at 8.27% a year as new capacity in India, Japan and Southeast Asia comes under service contracts.
Executive Summary
The Global Managed Data Center Services Market size was valued at USD 42.27 billion in 2020, reached USD 56.59 billion in 2025, and is anticipated to reach USD 109.82 billion by 2035, at a CAGR of 6.85% during the forecast period.
| Report attribute | Details |
|---|---|
| Historical Period | 2020-2024 |
| Base Year | 2025 |
| Forecast Period | 2026-2035 |
| Managed Data Center Services Market Size 2025 | USD 56.59 Billion |
| Managed Data Center Services Market, CAGR | 6.85% |
| Managed Data Center Services Market Size 2035 | USD 109.82 Billion |
The market grew at 6.01% a year between 2020 and 2025, and 2025 added 6.9% over 2024. DC Market Insights expects growth to peak at 9.2% in 2026 and stay above 7% to 2030 while the capacity now under construction is energized and put under maintenance and operations contracts, then to ease toward 5.0% by 2035 as the build cycle matures. Growth is uneven across services: managed hosting grows only 4.20% a year because, in the DC Market Insights view, public cloud absorbs much of the work that used to sit in managed private environments, while facility management and critical infrastructure maintenance grow at 13.04% and 9.27% a year because they scale with the installed base of power and cooling equipment.
Market Scope: What Does the Managed Data Center Services Market Cover?
The Managed Data Center Services Market covers every recurring service through which an organization pays a third party to operate, maintain or monitor its data center infrastructure, valued as provider revenue in current US dollars, with 2025 as the base year and forecasts to 2035. DC Market Insights sizes it at USD 56.59 billion in 2025.
Included. Managed hosting, managed private cloud and data center infrastructure outsourcing of servers, storage and networks, delivered from provider or customer facilities; original equipment manufacturer (OEM) post-warranty support and third-party maintenance (TPM) of IT hardware; preventive and corrective maintenance of uninterruptible power supplies (UPS), batteries, generators, switchgear, chillers, computer room air handlers and liquid cooling loops; critical facility management and operations contracts; and remote monitoring, network operations center (NOC) and data center infrastructure management (DCIM) services sold as a managed service.
Excluded. Colocation space and power, interconnection, public cloud infrastructure as a service, application management and consulting, construction, commissioning and design, hardware and software product sales, and in-house staff costs of data center owners.
How the segments fit together. Service type is the primary split. Customer type, delivery location and vertical re-cut the same USD 56.59 billion by who buys and where the service is delivered, so each of those splits also sums to the market total. Managed hosting and infrastructure services and facility management and operations are measured on the same basis as the matching segments of the DC Market Insights Data Center Outsourcing Market report, so the two reports reconcile.
Market Drivers: What Drives the Managed Data Center Services Market?
Three drivers explain most of the growth in the Managed Data Center Services Market: an installed base that nearly doubles to 200 GW by 2030, operators that cannot hire enough staff, and workloads that keep moving out of enterprise-owned rooms into third-party facilities and services.
Installed Capacity Nearly Doubles to 200 GW by 2030, Adding USD 7.62 billion of Maintenance Revenue
JLL expects global data center capacity to nearly double from 103 GW to 200 GW by 2030, and expects the build-out to require up to USD 3 trillion of total investment over the next five years. Every MW of that capacity carries UPS systems, batteries, generators and cooling plant that need scheduled maintenance. DC Market Insights applies an outsourced maintenance spend of about USD 0.086 million per MW to the installed base, which lifts critical infrastructure maintenance from USD 8.88 billion in 2025 to USD 16.51 billion in 2030 and USD 21.56 billion by 2035.
Staffing Shortages Push Owners to Outsource Operations
Nearly two-thirds of operators reported difficulty retaining staff, finding qualified candidates or both in the Uptime Institute Global Data Center Survey 2025, and more than half of respondents to the 2026 survey reported difficulty finding qualified candidates for open jobs. DC Market Insights expects owners that cannot staff a new hall to buy the operation as a contract. CBRE reported a 30% increase in its data center solutions business in the second quarter of 2026, much of it from hyperscalers, and expects its data center services to grow revenue by about 25% a year over the next five years. DC Market Insights forecasts facility management and operations to grow from USD 5.14 billion in 2025 to USD 17.51 billion by 2035.
Third-Party Facilities and Services Now Host More Workloads
The Uptime Institute 2025 survey found 45% of IT workloads still residing in corporate facilities. Its 2026 survey reports that, for the first time, third-party data center facilities and services account for a larger share of IT workloads than enterprise-owned data centers, measured by facility rather than total capacity. DC Market Insights expects services delivered in colocation and provider facilities to rise from 47.2% of the market in 2025 to 55.4% by 2035.
Market Trends: How Are Managed Data Center Services Changing?
The Managed Data Center Services Market is shifting from managing servers toward managing power, cooling and hybrid estates: maintenance and facility services rise from 24.8% of value in 2025 to 35.5% in 2035.
Liquid Cooling Creates a New Maintenance Line
Direct-to-chip and immersion cooling bring coolant loops, pumps and fluid chemistry that need their own service routines. Vertiv completed its acquisition of PurgeRite in December 2025 in a deal worth around USD 1.00 billion, citing PurgeRite’s specialized expertise in fluid management services, to bolster its liquid cooling services. DC Market Insights counts this work inside critical infrastructure maintenance and expects it to lift spend per MW at AI campuses above the average for air-cooled halls.
Hardware Maintenance Providers Consolidate
DC Market Insights sees independent hardware maintenance consolidating. Park Place Technologies completed its merger with Service Express in January 2026, creating a company with more than 3,000 employees and over 20,000 customers across North America, Europe, Asia and South America, and the combined firm said the merger expands its infrastructure services across traditional, cloud and AI-accelerated environments.
Managed Service Providers Pivot to Hyperscaler Partnerships
Kyndryl recognized USD 1.90 billion of hyperscaler-related revenue in fiscal 2026, a 59% increase year over year, up from USD 1.20 billion tied to cloud hyperscaler alliances in fiscal 2025. Rackspace Technology launched Rackspace Cloud in August 2026, a fully managed multitenant cloud platform powered by VMware Cloud Foundation 9.1 and initially available in Dallas. DC Market Insights reads both moves as the same shift: managed hosting providers keep their customers by running hybrid estates that span private infrastructure and public cloud.
Market Challenges: What Holds the Managed Data Center Services Market Back?
Public cloud substitution and labor costs are the two constraints that DC Market Insights expects to hold the Managed Data Center Services Market to 6.85% a year, below the growth of installed capacity.
Public Cloud Erodes Managed Private Hosting
Rackspace Technology reported Private Cloud revenue of USD 990.00 million in 2025, a decrease of 6% on a reported basis, and Kyndryl reported fiscal 2026 revenue of USD 15.10 billion, flat on a reported basis, with an outlook of constant-currency revenue flat to down 2% for fiscal 2027. DC Market Insights therefore forecasts managed hosting and infrastructure services to grow only 4.20% a year, and its share of the market falls from 41.4% in 2025 to 32.2% by 2035.
Skilled Labor Is Scarce and Outages Remain Costly
The staffing shortage that creates demand also limits supply, because providers compete with operators for the same technicians. The Uptime Institute 2026 survey also finds that one in ten outages is still classified as serious or severe and that the costs of outages continue to rise, which pushes buyers to demand tighter service levels and penalty clauses.
Market Opportunities: Where Are the New Revenue Pools?
The two largest new revenue pools in the Managed Data Center Services Market are AI and GPU cloud providers, which add USD 8.37 billion of annual spending by 2035, and colocation and wholesale operators, which add USD 14.95 billion.
AI and GPU Cloud Providers Grow at 11.88% a Year
AI and GPU cloud providers rise from 7.1% of the market in 2025 to 11.3% in 2035 in the DC Market Insights model. DC Market Insights assumes that dense GPU halls need more frequent hardware swaps, liquid cooling service and round-the-clock monitoring, and that many newer AI cloud providers buy those services rather than build operations teams.
Power and Cooling Vendors Expand Service Revenue
Equipment vendors are turning their installed base into recurring revenue. Vertiv’s services and spares revenue rose 14.5% to USD 2.02 billion in 2025 out of total net sales of USD 10.23 billion, and Schneider Electric reported that software and services represented 19% of its group revenues in 2025. DC Market Insights expects colocation and wholesale operators, the largest buyers of critical infrastructure maintenance, to raise their managed services spending from USD 9.96 billion in 2025 to USD 24.91 billion by 2035.
Pricing: How Much Do Managed Data Center Services Cost per MW?
Managed data center services were worth about USD 0.549 million per MW of installed capacity in 2025, according to DC Market Insights estimates, falling to USD 0.399 million by 2035. These are blended averages across all facilities, including hyperscale campuses that buy only facility services.
| Spend per MW of installed capacity (USD million a year) | 2020 | 2025 | 2030 | 2035 |
|---|---|---|---|---|
| Managed Hosting and Infrastructure Services | 0.348 | 0.227 | 0.144 | 0.128 |
| IT Hardware Support and Maintenance | 0.205 | 0.155 | 0.121 | 0.096 |
| Critical Infrastructure Maintenance | 0.085 | 0.086 | 0.083 | 0.078 |
| Facility Management and Operations | 0.055 | 0.050 | 0.047 | 0.064 |
| Remote Monitoring and Management | 0.036 | 0.031 | 0.027 | 0.033 |
| Total | 0.729 | 0.549 | 0.422 | 0.399 |
IT hardware support falls fastest per MW, from USD 0.205 million in 2020 to USD 0.096 million by 2035, because DC Market Insights assumes that hyperscale operators maintain most of their own servers. Facility management is the only service whose spend per MW rises after 2030, to USD 0.064 million by 2035, as more owners outsource whole-site operations.
Standards and Regulation: Which Rules Shape Managed Data Center Services?
Four groups of rules decide how buyers select and oversee managed data center service providers: financial-sector third-party risk rules, service management standards, information security standards and data center tier certification.
Digital Operational Resilience Act (DORA). The EU regulation entered into application on 17 January 2025 and establishes an EU-wide oversight framework for critical ICT third-party providers (CTPPs). The European Supervisory Authorities published the list of designated CTPPs on 18 November 2025.
US third-party risk guidance. The Federal Reserve, the Federal Deposit Insurance Corporation (FDIC) and the Office of the Comptroller of the Currency (OCC) issued final joint guidance on third-party relationships in June 2023, covering risk management across the life cycle of a relationship from planning and due diligence to contract negotiation, ongoing monitoring and termination.
Service management and security standards. ISO/IEC 20000-1:2018 sets the requirements for a service management system, and ISO/IEC 27001 is the world’s best-known standard for information security management systems.
Tier certification. The Uptime Institute has issued more than 4,300 Tier Certifications in more than 120 countries.
Market Segmentation: Which Segment Leads the Managed Data Center Services Market?
Managed hosting and infrastructure services lead the Managed Data Center Services Market with 41.4% of 2025 value, enterprises lead customers with 51.0%, and facility management and operations is the fastest-growing segment at 13.04% a year because DC Market Insights expects new campuses to be handed to specialist operators.
By Service Type: Managed Hosting and Infrastructure Services Lead with 41.4%
| Service type | 2025 (USD billion) | Share 2025 | 2035 (USD billion) | CAGR 2025-2035 |
|---|---|---|---|---|
| Managed Hosting and Infrastructure Services | 23.40 | 41.4% | 35.31 | 4.20% |
| IT Hardware Support and Maintenance | 15.96 | 28.2% | 26.45 | 5.18% |
| Critical Infrastructure Maintenance | 8.88 | 15.7% | 21.56 | 9.27% |
| Facility Management and Operations | 5.14 | 9.1% | 17.51 | 13.04% |
| Remote Monitoring and Management | 3.20 | 5.7% | 8.98 | 10.87% |
Managed hosting loses 9.2 points of share by 2035, while facility management gains 6.8 points. Remote monitoring and management grows 10.87% a year as DC Market Insights expects operators to adopt DCIM and NOC services delivered as a subscription.
By Customer Type: Enterprises Lead with 51.0%
| Customer type | 2025 (USD billion) | Share 2025 | 2035 (USD billion) | CAGR 2025-2035 |
|---|---|---|---|---|
| Enterprises | 28.89 | 51.0% | 45.04 | 4.54% |
| Colocation and Wholesale Operators | 9.96 | 17.6% | 24.91 | 9.60% |
| Government and Public Sector | 7.36 | 13.0% | 12.55 | 5.48% |
| Hyperscale and Cloud Providers | 6.35 | 11.2% | 14.91 | 8.91% |
| AI and GPU Cloud Providers | 4.04 | 7.1% | 12.41 | 11.88% |
Enterprises still spend USD 28.89 billion, but their share falls 10.0 points because their managed hosting spending grows slowly. Colocation and wholesale operators grow at 9.60% a year as they outsource maintenance of the power and cooling plant behind their leases.
By Delivery Location: Customer-Owned Facilities Lead with 52.8%
Services delivered at customer-owned facilities are worth USD 29.88 billion (52.8%) in 2025 and USD 48.98 billion by 2035, growing 5.07% a year. Services delivered in colocation and provider facilities are worth USD 26.71 billion (47.2%) and grow 8.58% a year, overtaking customer-owned sites before 2030 in the DC Market Insights model.
By Vertical: IT and Telecom Lead with 27.4%
IT and telecom companies, including cloud, content and network operators, account for USD 15.51 billion (27.4%) of 2025 demand and grow 8.39% a year. Banking, financial services and insurance (BFSI) follows with USD 12.34 billion (21.8%) and grows 5.78% a year; DC Market Insights expects DORA and US third-party guidance to favor certified providers. Government and defense hold 12.9%, healthcare 8.6%, others 8.3%, retail and e-commerce 8.1%, manufacturing 7.7% and energy and utilities 5.2%. Healthcare grows fastest outside IT and telecom at 7.81% a year as DC Market Insights expects imaging archives and clinical systems to move into managed environments.
DC Exclusive: The Installed-Base Service Model and Service × Customer Matrix
At USD 15.51 billion in 2025, managed hosting and infrastructure services sold to enterprises is the single largest cell of the matrix and 27.4% of all managed data center services revenue. The matrix below cross-tabulates what is outsourced against who buys it.
| 2025, USD billion | Enterprises | Colocation and Wholesale | Hyperscale and Cloud | Government | AI and GPU Cloud | Total |
|---|---|---|---|---|---|---|
| Managed Hosting and Infrastructure Services | 15.51 | 1.22 | 1.43 | 4.14 | 1.10 | 23.40 |
| IT Hardware Support and Maintenance | 8.27 | 2.60 | 1.64 | 1.90 | 1.55 | 15.96 |
| Critical Infrastructure Maintenance | 2.64 | 3.59 | 1.31 | 0.61 | 0.73 | 8.88 |
| Facility Management and Operations | 0.94 | 1.84 | 1.63 | 0.31 | 0.42 | 5.14 |
| Remote Monitoring and Management | 1.52 | 0.71 | 0.33 | 0.39 | 0.24 | 3.20 |
| Total | 28.89 | 9.96 | 6.35 | 7.36 | 4.04 | 56.59 |
Enterprises spend 54% of their managed services budget on managed hosting and infrastructure services, while colocation and wholesale operators spend 55% on critical infrastructure maintenance and facility management. Hyperscale and cloud providers put 46% of their spend into power, cooling and facility services because DC Market Insights assumes they maintain most of their IT hardware themselves, and AI and GPU cloud providers put 38% into IT hardware support, the highest share of any customer type, because DC Market Insights assumes dense GPU servers need frequent part swaps.
The installed-base service model behind these figures is a DC Market Insights model built from 44 inputs: 16 annual global capacity points (2020 to 2035), 3 IT hardware support spend-per-MW points, 3 power and cooling maintenance spend-per-MW points, 3 outsourced maintenance shares, 6 growth anchors for managed hosting, facility management and remote monitoring, 5 customer mixes for each of 2025 and 2035 counted as 10 inputs, and 3 company disclosures used as cross-checks. Its key input can be checked by any reader: global capacity of 103 GW in 2025 rising to 200 GW by 2030. The model and its assumptions are explained on our research methodology page.
Regional Insights: Which Region Leads the Managed Data Center Services Market?
North America leads the Managed Data Center Services Market with 41.8% of 2025 value, and Asia Pacific is the fastest-growing region at 8.27% a year, because DC Market Insights expects new capacity in India, Japan, Australia and Southeast Asia to come under maintenance and operations contracts as it is energized.
North America Leads with 41.8% Share
North America is worth USD 23.65 billion in 2025 and USD 44.59 billion by 2035, a CAGR of 6.54%. The United States alone is worth USD 20.93 billion in 2025, and CBRE’s data center solutions growth in the second quarter of 2026 came, in large part, from hyperscalers. DC Market Insights expects North America to remain the largest regional market through 2035.
Europe Holds 26.4% Share
Europe is worth USD 14.94 billion in 2025 and USD 25.81 billion by 2035, a CAGR of 5.62%, the slowest of the five regions. DORA raises the compliance bar for providers that serve banks and insurers, which DC Market Insights expects to concentrate financial-sector contracts among certified providers rather than to expand total spending.
Asia Pacific Holds 24.2% Share
Asia Pacific is worth USD 13.69 billion in 2025 and USD 30.31 billion by 2035, growing fastest at 8.27% a year. In the DC Market Insights country allocation, India is the fastest-growing large country market in the region, and Japan remains the second-largest country market in Asia Pacific after China.
Latin America Holds 4.1% Share
Latin America is worth USD 2.32 billion in 2025 and USD 4.83 billion by 2035, a CAGR of 7.61%. DC Market Insights expects Brazil, Mexico and Chile to lead demand.
Middle East and Africa Holds 3.5% Share
The Middle East and Africa is worth USD 1.98 billion in 2025 and USD 4.28 billion by 2035, a CAGR of 8.02%. DC Market Insights attributes most of the new demand to Saudi Arabia and the United Arab Emirates.
Country Analysis: Which Countries Spend the Most on Managed Data Center Services?
The United States is the largest country market for managed data center services at USD 20.93 billion in 2025, 37.0% of global value, followed by China at USD 4.52 billion (8.0%) and the United Kingdom at USD 3.59 billion (6.3%). The 12 largest countries account for 80.6% of 2025 spending.
| Rank | Country | Region | 2025 (USD billion) | Share 2025 | 2035 (USD billion) | CAGR 2025-2035 |
|---|---|---|---|---|---|---|
| 1 | United States | North America | 20.93 | 37.0% | 39.23 | 6.48% |
| 2 | China | Asia Pacific | 4.52 | 8.0% | 9.40 | 7.59% |
| 3 | United Kingdom | Europe | 3.59 | 6.3% | 5.94 | 5.17% |
| 4 | Germany | Europe | 3.21 | 5.7% | 5.42 | 5.37% |
| 5 | Japan | Asia Pacific | 3.01 | 5.3% | 5.61 | 6.41% |
| 6 | Canada | North America | 2.72 | 4.8% | 5.35 | 7.00% |
| 7 | France | Europe | 2.02 | 3.6% | 3.46 | 5.54% |
| 8 | Australia | Asia Pacific | 1.30 | 2.3% | 2.82 | 8.04% |
| 9 | India | Asia Pacific | 1.23 | 2.2% | 3.94 | 12.32% |
| 10 | Netherlands | Europe | 1.20 | 2.1% | 2.12 | 5.88% |
| 11 | Brazil | Latin America | 1.04 | 1.8% | 2.22 | 7.85% |
| 12 | Singapore | Asia Pacific | 0.82 | 1.5% | 1.86 | 8.54% |
India is the fastest-growing large country market at 12.32% a year, ahead of Singapore at 8.54%, and India overtakes France before 2035. The United Kingdom grows only 5.17% a year because, in the DC Market Insights view, its managed hosting base is mature. The country figures are a DC Market Insights allocation of the regional totals, weighted by each country’s estimated share of installed and new data center capacity.
Forecast Scenarios: How Could the 2035 Forecast Change?
The Managed Data Center Services Market reaches USD 109.82 billion by 2035 in the base case, with a range of USD 94.66 billion to USD 123.76 billion across the low and high scenarios.
| Scenario | Assumption from 2026 | 2035 (USD billion) | CAGR 2025-2035 |
|---|---|---|---|
| Low | Capacity additions 15% below base; managed hosting declines 1% a year; outsourced share of power and cooling maintenance stays at 75% | 94.66 | 5.28% |
| Base | Capacity reaches 200 GW in 2030 and 275 GW in 2035; outsourced maintenance share rises to 80%; facility management grows 13.04% a year | 109.82 | 6.85% |
| High | Capacity additions 12% above base; AI and GPU cloud providers outsource most operations; maintenance labor rates rise 2 points a year faster | 123.76 | 8.14% |
The low case is what a faster move to public cloud and slower grid connections look like: enterprises shut more managed private environments and new campuses are energized later. The high case assumes that the capacity now under construction is delivered on schedule and that new AI operators buy operations rather than build in-house teams.
Competitive Insights: Who Leads the Managed Data Center Services Market?
- Kyndryl
- IBM
- NTT DATA
- DXC Technology
- Rackspace Technology
- Accenture
- Fujitsu
- Park Place Technologies
- Hewlett Packard Enterprise
- Dell Technologies
- Vertiv
- Schneider Electric
- Eaton
- CBRE
- JLL
- Atos
Kyndryl is the largest provider in the DC Market Insights assessment, with about 9.0% of the Managed Data Center Services Market in 2025 (DC Market Insights estimate: about USD 5.11 billion of infrastructure operations revenue, or 44% of the USD 11.60 billion of Kyndryl revenue outside Kyndryl Consult, set against the USD 56.59 billion market). Kyndryl reported fiscal 2026 revenue of USD 15.10 billion (Source: Kyndryl filing with the US Securities and Exchange Commission), Kyndryl Consult revenue of USD 3.50 billion, up 18%, and signings of USD 13.50 billion. Rackspace Technology’s USD 990.00 million of Private Cloud revenue in 2025 equals about 4.2% of managed hosting and infrastructure services. Vertiv deploys approximately 5,000 service engineers, and its USD 2.02 billion of services and spares revenue, which includes spare parts and non-data-center customers, sets an upper bound on its share of critical infrastructure maintenance at about 22.8%. In the DC Market Insights assessment, the market is fragmented: IT services firms such as Kyndryl, IBM, NTT DATA, DXC Technology, Accenture, Fujitsu and Atos compete for managed infrastructure contracts, OEMs and independent providers such as Park Place Technologies compete for hardware maintenance, power and cooling vendors such as Vertiv, Schneider Electric and Eaton compete in equipment maintenance, and real estate services firms such as CBRE and JLL compete for facility operations.
Recent Developments
- In November 2025, the European Supervisory Authorities published the list of designated critical ICT third-party providers under the Digital Operational Resilience Act (Source: EIOPA press release).
- In December 2025, Vertiv completed its acquisition of PurgeRite, a fluid management services provider, in a deal worth around USD 1.00 billion to bolster its liquid cooling services (Source: Data Centre Review news report).
- In January 2026, Park Place Technologies completed its merger with Service Express, creating a company with more than 3,000 employees and over 20,000 customers (Source: Charlesbank press release).
- In May 2026, Kyndryl reported fiscal 2026 hyperscaler-related revenue of USD 1.90 billion, up 59% year over year (Source: Kyndryl SEC filing).
- In July 2026, CBRE reported a 30% increase in its data center solutions business in the second quarter, much of it from hyperscalers (Source: Facilities Dive news report).
- In August 2026, Rackspace Technology launched Rackspace Cloud, a fully managed multitenant cloud platform built on VMware Cloud Foundation 9.1 (Source: StorageNewsletter news report).
We follow these deals, contracts and service launches as they happen in our data center industry updates, and the asset-tracking side of operations is covered in the Data Center Asset Management Market report.
Methodology: How We Built the Managed Data Center Services Market Model
DC Market Insights built this market bottom-up from 16 annual global capacity points (2020 to 2035), anchored on 103 GW in 2025 and 200 GW in 2030, and rising to 275 GW by 2035 as a DC Market Insights assumption. IT hardware support and maintenance was priced at USD 0.205 million per MW of installed capacity in 2020, USD 0.155 million in 2025 and USD 0.096 million by 2035. Critical infrastructure maintenance was priced at USD 0.118, 0.115 and 0.098 million per MW for the same years, multiplied by an outsourced share of 72%, 75% and 80%. Managed hosting and infrastructure services and facility management and operations were set to the same 2025 and 2035 values as the matching segments of the DC Market Insights Data Center Outsourcing Market model, with historical growth of 3% and 10% a year, and remote monitoring and management was grown at 9% a year to 2025 and 10.87% a year to 2035. The total was split by 5 service types, 5 customer types, 2 delivery locations, 8 verticals and 5 regions, and every split sums to the market total. The result was checked top-down against Kyndryl’s revenue outside Kyndryl Consult as a ceiling for its infrastructure business, against Rackspace Technology’s Private Cloud revenue as a floor for managed hosting, and against Vertiv’s services and spares revenue as an upper bound for one vendor’s share of power and cooling maintenance. The analyst named on this page built the model, and the reviewer checked the arithmetic, the sources and the dates before publication.
Table of contents
- 01Introduction
- 1.1Market Definition and Scope
- 1.2Research Objectives
- 1.3Currency, Base Year and Forecast Period
- 1.4Key Stakeholders
- 02Research Methodology
- 2.1Installed-Base Service Model
- 2.2Bottom-Up Revenue Build
- 2.3Top-Down Cross-Checks
- 2.4Data Sources and Fact Verification
- 2.5Assumptions and Limitations
- 03Executive Summary
- 3.1Market Snapshot, 2025 and 2035
- 3.2Key Findings
- 3.3Analyst View
- 04Market Dynamics
- 4.1Market Drivers
- 4.2Market Trends
- 4.3Market Challenges
- 4.4Market Opportunities
- 05Pricing Analysis
- 5.1Spend per MW by Service Type
- 5.2Labor and Contract Price Trends
- 5.3Price Outlook to 2035
- 06Standards and Regulation
- 6.1Digital Operational Resilience Act (DORA)
- 6.2US Third-Party Risk Guidance
- 6.3ISO/IEC 20000-1 and ISO/IEC 27001
- 6.4Uptime Institute Tier Certification
- 07Value Chain and Supply Analysis
- 7.1IT Services Providers
- 7.2OEM and Third-Party Maintenance Providers
- 7.3Power and Cooling Equipment Vendors
- 7.4Facility Management Contractors
- 08Market Size and Forecast
- 8.1Market Size, 2020-2035
- 8.2Installed Data Center Capacity, 2020-2035
- 8.3Spend per MW of Installed Capacity
- 09Market by Service Type
- 9.1Managed Hosting and Infrastructure Services
- 9.2IT Hardware Support and Maintenance
- 9.3Critical Infrastructure Maintenance
- 9.4Facility Management and Operations
- 9.5Remote Monitoring and Management
- 10Market by Customer Type
- 10.1Enterprises
- 10.2Colocation and Wholesale Operators
- 10.3Hyperscale and Cloud Providers
- 10.4Government and Public Sector
- 10.5AI and GPU Cloud Providers
- 11Market by Delivery Location
- 11.1Customer-Owned Facilities
- 11.2Colocation and Provider Facilities
- 12Market by Vertical
- 12.1IT and Telecom
- 12.2BFSI
- 12.3Government and Defense
- 12.4Healthcare
- 12.5Retail and E-commerce
- 12.6Manufacturing
- 12.7Energy and Utilities
- 12.8Others
- 13DC Exclusive: Installed-Base Service Model
- 13.1Service Type x Customer Type Matrix, 2025
- 13.2Spend Mix by Customer Type
- 13.3Implications for Providers and Buyers
- 14Market by Region
- 14.1North America (United States, Canada)
- 14.2Europe (United Kingdom, Germany, France, Netherlands)
- 14.3Asia Pacific (China, Japan, India, Australia, Singapore)
- 14.4Latin America (Brazil)
- 14.5Middle East and Africa
- 15Country Analysis
- 15.1Top 12 Countries, 2025 and 2035
- 15.2Fastest-Growing Country Markets
- 16Regional Cross-Sections
- 16.1Regional Share Shifts, 2025 to 2035
- 16.2Regional Growth Comparison, 2025-2035
- 17Forecast Scenarios
- 17.1Low Scenario
- 17.2Base Scenario
- 17.3High Scenario
- 18Competitive Landscape
- 18.1Market Share Analysis, 2025
- 18.2IT Services and Managed Hosting Providers
- 18.3Hardware Maintenance Providers
- 18.4Power, Cooling and Facility Service Providers
- 19Recent Developments
- 19.1Mergers and Acquisitions
- 19.2Service Launches
- 19.3Regulatory Milestones
- 20Company Profiles
- 20.1Kyndryl
- 20.2IBM
- 20.3NTT DATA
- 20.4DXC Technology
- 20.5Rackspace Technology
- 20.6Accenture
- 20.7Fujitsu
- 20.8Park Place Technologies
- 20.9Hewlett Packard Enterprise
- 20.10Dell Technologies
- 20.11Vertiv
- 20.12Schneider Electric
- 20.13Eaton
- 20.14CBRE
- 20.15JLL
- 20.16Atos
- 21Analyst Recommendations
- 21.1For Managed Service Providers
- 21.2For Data Center Operators
- 21.3For Enterprise Buyers
- Fig. 1Managed Data Center Services Market Size, 2020-2035
- Fig. 2Managed Data Center Services Market by Service Type, 2025 and 2035
- Fig. 3Managed Data Center Services Market by Region, 2025 and 2035
- Fig. 4Installed Data Center Capacity, 2020-2035
- Fig. 5Spend per MW of Installed Capacity, 2020-2035
- Fig. 6Managed Data Center Services Market by Customer Type, 2025 and 2035
- Fig. 7Forecast Scenarios, 2035
- Table 1Report Attributes
- Table 2Spend per MW by Service Type, 2020, 2025, 2030 and 2035
- Table 3Market by Service Type, 2025 and 2035
- Table 4Market by Customer Type, 2025 and 2035
- Table 5Market by Delivery Location, 2025 and 2035
- Table 6Market by Vertical, 2025 and 2035
- Table 7Service Type x Customer Type Matrix, 2025
- Table 8Market by Region, 2025 and 2035
- Table 9Top 12 Countries, 2025 and 2035
- Table 10Forecast Scenarios, 2035
- Table 11Model Inputs and Sources
About this report
Written by Amit Jain and reviewed by Deepti Agrawal, Senior Editor, Research. Figures are built top-down and bottom-up and reconciled before publication, with 2025 as the base year.
Read our methodologyHow we built this
- Historical period2020-2024
- Base year2025
- Forecast period2026-2035
- Sizing approachTop-down + bottom-up
Need more than the report?
Advisory on this market
Due diligence, site selection and market entry work, by the analysts who wrote this report.
See consulting servicesFrequently asked questions
USD 56.59 billion in 2025, rising to USD 109.82 billion by 2035. DC Market Insights estimates the market at USD 42.27 billion in 2020.
6.85% a year from 2025 to 2035, up from 6.01% a year between 2020 and 2025, as installed data center capacity nearly doubles to 200 GW by 2030.
Managed hosting and infrastructure services, with USD 23.40 billion or 41.4% of the market in 2025. Facility management and operations grows fastest at 13.04% a year.
About USD 0.549 million per MW of installed capacity in 2025, falling to USD 0.399 million by 2035, according to DC Market Insights estimates.
North America, with USD 23.65 billion or 41.8% of 2025 value. Asia Pacific grows fastest at 8.27% a year.
Kyndryl is the largest provider with about 9.0% of the market (DC Market Insights estimate). IBM, NTT DATA, DXC Technology, Rackspace Technology, Accenture, Fujitsu, Park Place Technologies, Hewlett Packard Enterprise, Dell Technologies, Vertiv, Schneider Electric, Eaton, CBRE, JLL and Atos also compete.
Enterprises, with USD 28.89 billion or 51.0% of 2025 demand. AI and GPU cloud providers grow fastest at 11.88% a year.
USD 20.93 billion in the United States, or 37.0% of 2025 spending, followed by China at USD 4.52 billion. India grows fastest among large country markets at 12.32% a year (DC Market Insights estimate).
Licences, delivery and payment
Which licence should I choose?
Single User is a view-only PDF for one person. Multi User adds a printable PDF and the Excel data for unlimited users at one location. Enterprise covers your whole company and includes 100 free analyst hours.
How and when will I receive the report?
By email, within 24–48 business hours of payment, in the formats of your licence.
How can I pay?
Securely through PayPal: with a PayPal account, a debit or credit card, or PayPal Pay Later where available. Prices are in US dollars.
Can I see a sample first?
Yes. Request a free sample and we will email it to you.
Can the report be tailored to my needs?
Yes. We can add countries, segments or data cuts. Talk to an analyst about the scope you need.
Can I get an invoice or pay against a purchase order?
Write to sales@dcmarketinsights.com and our team will help.