
North America Data Center Infrastructure Management (DCIM) Market Size, Share & Forecast to 2035
Market at a glance
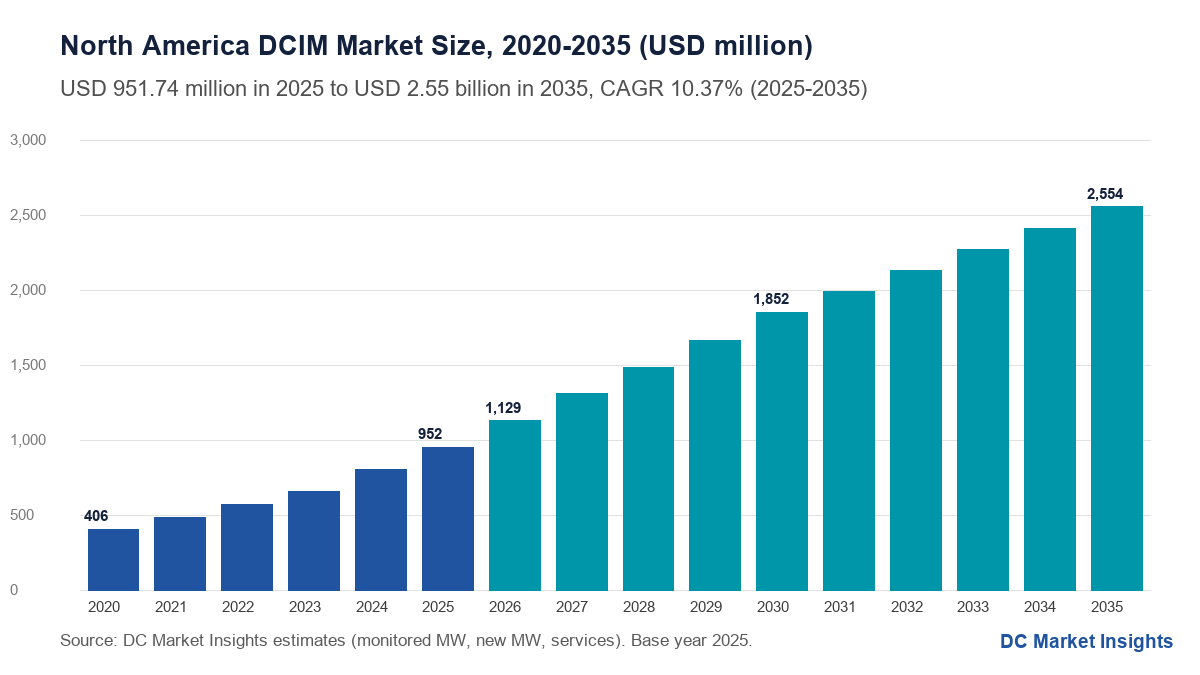
The North America Data Center Infrastructure Management (DCIM) market was worth USD 951.7 million in 2025 and is forecast to reach USD 2,550.0 million by 2035, growing at a 10.37% CAGR.
 By Amit Jain, Senior Consultant, ICT & Emerging Technologies
 Reviewed by Deepti Agrawal
Last updated 22 Oct 2026
Base year 2025 PDF + Excel
Key findings
Grid Operators Now Ask Data Centers to Prove Their Load
Power and Cooling Vendors Fold DCIM Into Their Hardware
SaaS Monitoring for Colocation Tenants: USD 1.61 billion by 2035
What is inside the report
- 01Introduction
- 02Research Methodology
- 03Executive Summary
- 04Market Dynamics
- 05Pricing Analysis
- 06Standards and Regulation
- 07Market Segmentation by Component
- 08Market Segmentation by Deployment
- 09Market Segmentation by Data Center Type
- 10Market Segmentation by End User
- 16chapters
- 2020-2024Historical period
- 2026-2035Forecast period
- —Companies profiled
Segmentation
Full analysis
The North America Data Center Infrastructure Management (DCIM) Market is valued at USD 1.13 billion in 2026 and is projected to reach USD 2.55 billion by 2035, up from USD 951.74 million in 2025, a CAGR of 10.37% from 2025 to 2035 (DC Market Insights estimate). Power, not floor space, is what operators in the United States, Canada and Mexico now meter most closely: the U.S. Department of Energy (DOE) reported that U.S. data centers used 176 TWh in 2023, 4.4% of national electricity, and could use 325-580 TWh by 2028 (Source: DOE, December 2024). Grid rules turn that metering into a duty, as Texas Senate Bill 6 (SB 6) set a 75 MW large-load threshold and curtailment equipment for Electric Reliability Council of Texas (ERCOT) connections in June 2025 (Source: Texas Legislature). North America Data Center Infrastructure Management (DCIM) covers the software, sensors, meters, gateways and services that monitor power, cooling, space and assets in a data center. The 2025 receipt is 24,128 MW of monitored IT load × USD 13,000 per MW a year = USD 313.66 million of software, plus 5,400 MW of new IT load × USD 60,000 per MW = USD 324.00 million of hardware, plus USD 314.07 million of services. Cloud and SaaS (Software as a Service) DCIM is the fastest deployment at 14.94% a year, and Mexico is the fastest country at 13.95%, led by Querétaro, where CloudHQ plans 900 MW.
North America DCIM in Numbers: How Big Is the Market in 2026?
DC Market Insights values North America DCIM spending at USD 1.13 billion in 2026, 18.61% above 2025, as monitored IT load rises from 24,128 MW to 29,007 MW.
- Market size 2025: USD 951.74 million
- Market size 2026: USD 1.13 billion
- Market size 2030: USD 1.85 billion
- Market size 2035: USD 2.55 billion
- CAGR 2025-2035: 10.37% (low case 7.94%, high case 12.50%)
- Largest component: Sensors Meters and Gateways, 34.04% of 2025 value
- Fastest deployment: Cloud and SaaS at 14.94% a year
- Largest data center type: Hyperscale and Cloud Campuses, 34.00% of 2025 value
- Leading country: United States, 86.50% of 2025 value; fastest country: Mexico at 13.95%
- Largest submarket: Northern Virginia, 20.50% of 2025 value
- Five largest vendors: about 46% of 2025 value (DC Market Insights estimate)
Key Takeaways: What Should a North America DCIM Buyer Know in 2026?
DC Market Insights draws four takeaways from a North America DCIM market that grows from USD 951.74 million in 2025 to USD 2.55 billion in 2035.
- New capacity sets the pace, because every megawatt built needs about USD 60,000 of sensors, meters and gateways at commissioning, and North American new IT load doubles from 5,400 MW in 2025 to 10,800 MW in 2035.
- Software follows the installed base, because monitored IT load nearly quadruples from 24,128 MW to 89,680 MW while the price per monitored MW falls from USD 13,000 to USD 11,000 a year.
- Subscriptions win, because hyperscale and colocation operators buy DCIM as SaaS: cloud deployments rise from 42.00% of 2025 value to 63.00% by 2035.
- Power rules make DCIM compulsory, because federal agencies must meter power usage effectiveness (PUE) in every data center above 100 kW and Texas grid rules require large loads to be curtailable.
How Much Did North American Operators Spend on DCIM in 2025?
North American operators spent USD 951.74 million on DCIM in 2025. The North America Data Center Infrastructure Management (DCIM) Market size was valued at USD 405.67 million in 2020, reached USD 951.74 million in 2025, and is anticipated to reach USD 2.55 billion by 2035, at a CAGR of 10.37% during the forecast period. From 2020 to 2025 spending grew 18.60% a year as installed IT load rose from about 27,000 MW to 46,400 MW and the monitored share rose from 38% to 52%.
| Report attribute | Details |
|---|---|
| Historical period | 2020-2024 |
| Base year | 2025 |
| Forecast period | 2026-2035 |
| Market size 2025 | USD 951.74 million |
| Market size 2026 | USD 1.13 billion |
| CAGR 2025-2035 | 10.37% |
| Market size 2035 | USD 2.55 billion |
Growth peaks at 18.61% in 2026, when hyperscale halls signed in 2024 and 2025 are commissioned, and slows to 5.92% by 2035 as new IT load per year levels off near 10,800 MW. The global picture sits in the Data Center Infrastructure Management (DCIM) Market, and the leased halls that buy much of this software in the North America Data Center Colocation Market.
What Is North America DCIM, and What Does It Leave Out?
North America DCIM is the software, instrumentation and services that monitor and manage power, cooling, space and IT assets in data centers in the United States, Canada and Mexico, worth USD 951.74 million in 2025.
Included
- Software platforms: monitoring, capacity planning, asset and change management, energy and PUE reporting, sold as licenses or subscriptions, 32.96% of 2025 value.
- Sensors meters and gateways: temperature, humidity, leak and power sensors, branch-circuit meters and protocol gateways installed for DCIM, 34.04%.
- Services: integration, consulting, support and managed monitoring, 33.00%.
Excluded
- Uninterruptible power supplies, rack power distribution units and cooling units themselves; building management systems (BMS) and electrical power monitoring systems (EPMS) bought as separate contracts; IT service management and AIOps (artificial intelligence for IT operations) software.
How the Segments Fit Together
The three components add to the total in every year; the deployment, data center type and end-user splits divide the same total. The three countries add to the total too, and the 12 submarkets in the submarket table cover 67.3% of 2025 value.
Why Do North America DCIM Market Estimates Differ?
North America DCIM estimates differ mainly because of what each counts as DCIM; DC Market Insights puts the 2026 market at USD 1.13 billion on a narrow software, instrumentation and services basis.
Broader definitions add the controls inside power and cooling hardware, building management systems sized in the Data Center Building Management System Market, electrical power monitoring systems, IT asset discovery tools and AIOps platforms sized in the AIOps for Data Center Management Market, which can double or triple the headline. Out-of-scope terms such as intelligent power distribution, environmental monitoring hardware sold with racks, and IT service management are therefore not counted. Small and medium enterprises (SMEs), banks, hospitals, government agencies and telecom operators are in scope as buyers, with Government and Defense at 13.00% of 2025 value. DC Market Insights lowered its own earlier 2025 estimate of USD 1.46 billion after rebuilding the market bottom-up from monitored megawatts.
| Element | In this estimate | Why |
|---|---|---|
| DCIM software platforms | Yes, 32.96% | Core of the market |
| Sensors, meters and gateways for DCIM | Yes, 34.04% | Installed to feed DCIM data |
| Integration, support and managed monitoring | Yes, 33.00% | Billed with DCIM projects |
| BMS and EPMS contracts | No | Separate building and electrical systems |
| Power and cooling hardware | No | Counted in infrastructure markets |
| AIOps and IT service management | No | IT software, not facility management |
Market Drivers: What Is Driving DCIM Demand in North America?
Three North American forces lift DCIM spending from USD 951.74 million in 2025 to USD 1.85 billion in 2030, a 14.25% annual rate.
Grid Operators Now Ask Data Centers to Prove Their Load
Texas SB 6, signed in June 2025, tells the Public Utility Commission of Texas (PUCT) to set interconnection standards for loads of 75 MW or more, requires disclosure of on-site backup generation and lets ERCOT require equipment so the load can be curtailed during firm load shed (Source: Texas Legislature, SB 6). In Alberta, the Alberta Electric System Operator (AESO) capped large-load connections at 1,200 MW in June 2025 after 29 projects asked for more than 16 GW (Source: AESO, June 2025). DC Market Insights estimates that grid-driven metering and curtailment reporting add about USD 8,000 per new MW to DCIM instrumentation from 2026.
Federal Agencies Must Meter PUE in Every Site Above 100 kW
The Office of Management and Budget (OMB) memorandum M-19-19 under the Data Center Optimization Initiative (DCOI) tells agencies to replace manual collection with automated monitoring, inventory and management tools such as DCIM, and to meter power well enough to estimate PUE in every remaining data center above 100 kW (Source: OMB M-19-19, June 2019). OMB memorandum M-25-03 of January 2025 extends automated monitoring to all new federal data centers (Source: OMB). DC Market Insights puts Government and Defense at 13.00% of 2025 North America DCIM value, growing 9.49% a year to 2035.
Electricity Growth Makes Every Megawatt Worth Tracking
The DOE and Lawrence Berkeley National Laboratory (LBNL) projected U.S. data center use of 325-580 TWh by 2028, up to 12% of U.S. electricity, against 176 TWh in 2023 (Source: DOE, December 2024). DC Market Insights models North American new IT load rising from 5,400 MW in 2025 to 9,200 MW in 2030, and each new megawatt carries USD 60,000 of DCIM sensors, meters and gateways at commissioning.
Market Trends: How Is DCIM Software Changing in North America?
North America DCIM is moving to subscriptions and to vendors that also sell power and cooling: Cloud and SaaS rises from 42.00% of 2025 value to 63.00% by 2035.
Power and Cooling Vendors Fold DCIM Into Their Hardware
Schneider Electric’s rack power distribution units launched in June 2025 connect through its Network Management Card to EcoStruxure IT (Source: Schneider Electric), and Vertiv bought Belgium-based Waylay NV, a hyperautomation and generative AI software firm, in August 2025 to strengthen monitoring and control of power and cooling (Source: Vertiv). DC Market Insights estimates that hardware vendors’ bundled DCIM carried about 38% of 2025 software value.
Specialist DCIM Brands Change Hands
Carrier completed its purchase of Nlyte Software in October 2021 (Source: Carrier), Freshworks completed its purchase of Device42 in June 2024 (Source: Freshworks), and Panduit said in October 2024 it would discontinue its SmartZone Cloud DCIM software in favour of Hyperview’s platform (Source: Panduit). DC Market Insights sees the specialist tier at about 22% of 2025 value.
AI Halls Need Monitoring at Rack and Liquid-Loop Level
Graphics processing unit (GPU) racks above 40 kW push DCIM from room-level readings to per-rack power and coolant data; Sunbird Software released dcTrack 9.3 in December 2025 (Source: Sunbird Software). DC Market Insights expects Hyperscale and Cloud Campuses to grow 12.46% a year to 2035, the fastest of the large data center types.
Market Challenges and Restraints: What Holds Back North America DCIM?
Two restraints could cut 2035 North America DCIM spending to the USD 2.04 billion low case, 20.00% below the base case.
Hyperscalers Build Their Own Tools
The largest cloud providers run in-house monitoring stacks on their own campuses, so DC Market Insights counts only about 45% of hyperscale megawatts as buying third-party DCIM software in 2025, and Hyperscale and Cloud Campuses hold 34.00% of value despite owning most new capacity.
Enterprise Rooms Shrink as Workloads Move
Enterprise Data Centers fall from 31.00% of 2025 value to 19.00% by 2035 and grow only 5.10% a year, as banks, retailers and manufacturers move workloads into colocation and cloud regions; DC Market Insights estimates that on-premises DCIM licenses grow just 5.52% a year.
Market Opportunities: Where Will New North America DCIM Revenue Come From?
Two pools could add about USD 1.31 billion of yearly North America DCIM spending between 2025 and 2035.
SaaS Monitoring for Colocation Tenants: USD 1.61 billion by 2035
Cloud and SaaS DCIM grows 14.94% a year to 2035, as colocation operators give tenants portal access to power, temperature and capacity data; Colocation Facilities reach USD 740.63 million by 2035.
Mexico’s Querétaro Corridor
Mexico’s Presidency announced a USD 4.8 billion CloudHQ investment in six Querétaro data centers with 900 MW, the first 200 MW backed by the Comisión Federal de Electricidad (CFE) and the Centro Nacional de Control de Energía (CENACE) (Source: Presidencia de México, September 2025). DC Market Insights expects Mexican DCIM spending to rise about 3.7-fold between 2025 and 2035.
Pricing Analysis: How Much Does DCIM Cost per MW in North America?
DC Market Insights estimates North America DCIM software at USD 13,000 per monitored MW a year in 2025, about USD 130 per 10 kW rack, and DCIM hardware at USD 60,000 per new MW.
| Year | Software (USD per monitored MW a year) | Software (USD per 10 kW rack a year) | Sensors, meters and gateways (USD per new MW) |
|---|---|---|---|
| 2020 | 14,500 | 145 | 52,000 |
| 2025 | 13,000 | 130 | 60,000 |
| 2030 | 12,000 | 120 | 62,000 |
| 2035 | 11,000 | 110 | 60,000 |
Software prices per megawatt fall from USD 14,500 in 2020 to USD 11,000 in 2035 because sites get larger and subscriptions are priced on racks or devices, not megawatts. Hardware per megawatt rises to USD 62,000 in 2030 as liquid-cooled AI halls add coolant-flow and leak sensors, then eases as gateways get cheaper. Public anchors: the OMB metering threshold of 100 kW, the Texas 75 MW large-load threshold and the AESO 1,200 MW interim limit set how much metering each site needs.
Standards and Regulation: Which Rules Make DCIM Necessary in North America?
Seven rules shape the USD 1.13 billion of 2026 North America DCIM spending.
- OMB M-19-19 (June 2019): automated monitoring and DCIM tools, and PUE-grade energy metering in federal data centers above 100 kW.
- OMB M-25-03 (January 2025): automated tools, including electricity monitoring, in all new federal data centers.
- Executive Order 14318 (July 2025): faster federal permitting for data center projects needing more than 100 MW of new load (Source: The White House).
- Texas SB 6 (June 2025): 75 MW large-load threshold, backup-generation disclosure and curtailment equipment in ERCOT.
- ANSI/ASHRAE Standard 90.4-2022 from the American Society of Heating, Refrigerating and Air-Conditioning Engineers (ASHRAE): minimum energy efficiency for data center design and operation, referenced in Oregon, Virginia and Washington codes and in the International Energy Conservation Code (IECC).
- ENERGY STAR for data centers, run by the U.S. Environmental Protection Agency (EPA): the score rests on metered PUE.
- AESO interim large-load approach (June 2025): 1,200 MW limit for new large loads in Alberta.
Market Segmentation: Which North America DCIM Segment Makes the Most Money?
Sensors Meters and Gateways make the most, 34.04% of 2025 value, while Software Platforms grow fastest among components at 12.14% a year.
By Component
| Component | 2025 (USD million) | Share 2025 | 2035 (USD million) | CAGR 2025-2035 |
|---|---|---|---|---|
| Software Platforms | 313.66 | 32.96% | 986.49 | 12.14% |
| Sensors Meters and Gateways | 324.01 | 34.04% | 648.00 | 7.18% |
| Services | 314.07 | 33.00% | 919.39 | 11.34% |
By Deployment
| Deployment | 2025 (USD million) | Share 2025 | 2035 (USD million) | CAGR 2025-2035 |
|---|---|---|---|---|
| On-Premises Software | 552.01 | 58.00% | 944.94 | 5.52% |
| Cloud and SaaS (Software as a Service) | 399.73 | 42.00% | 1,608.94 | 14.94% |
By Data Center Type
| Data center type | 2025 (USD million) | Share 2025 | 2035 (USD million) | CAGR 2025-2035 |
|---|---|---|---|---|
| Hyperscale and Cloud Campuses | 323.59 | 34.00% | 1,047.08 | 12.46% |
| Colocation Facilities | 256.97 | 27.00% | 740.63 | 11.17% |
| Enterprise Data Centers | 295.04 | 31.00% | 485.24 | 5.10% |
| Edge Sites | 76.14 | 8.00% | 280.93 | 13.95% |
By End User
| End user | 2025 (USD million) | Share 2025 | 2035 (USD million) | CAGR 2025-2035 |
|---|---|---|---|---|
| Cloud and IT Services | 361.66 | 38.00% | 1,200.32 | 12.75% |
| Banking and Financial Services | 142.76 | 15.00% | 332.00 | 8.81% |
| Telecom Operators | 114.21 | 12.00% | 255.39 | 8.38% |
| Government and Defense | 123.73 | 13.00% | 306.47 | 9.49% |
| Healthcare | 76.14 | 8.00% | 178.77 | 8.91% |
| Other Enterprises | 133.24 | 14.00% | 280.93 | 7.74% |
Edge Sites are small at 8.00% of 2025 value but grow 13.95% a year, because telecom operators and retailers need remote monitoring of unstaffed sites; Cloud and IT Services stay the largest end user at 38.00%.
DC Exclusive: The 20 MW Hall DCIM Cost Teardown, USD 5.16 Million Over 10 Years
DC Market Insights prices what DCIM costs a North American operator on one 20 MW hall over 10 years: USD 5.16 million, of which hardware at commissioning is only USD 1.20 million. The teardown is a DC Market Insights model estimate built on 6 inputs: the hall size, hardware per MW, software per monitored MW a year, integration cost, the support ratio and the 10-year term.
| Cost line | USD million | Basis |
|---|---|---|
| Sensors meters and gateways at commissioning | 1.20 | USD 60,000 per MW of new IT load |
| Integration and commissioning services | 0.42 | Asset discovery, network setup and BMS and EPMS interfaces |
| Software subscription over 10 years | 2.60 | USD 13,000 per monitored MW a year |
| Support, upgrades and managed monitoring over 10 years | 0.94 | 36% of the software bill |
| Total 10-year cost | 5.16 | About USD 258 thousand per MW |
Reading the teardown: subscriptions carry 50% of the 10-year cost, so a buyer comparing vendors should price the software term, not the sensor kit, and at about USD 258 thousand per MW, DCIM is a small line next to the cost of the hall itself.
Regional Insights: Which Country Leads the North America DCIM Market?
In the North America DCIM market, the United States leads with USD 823.25 million in 2025 (86.50%), and Mexico grows fastest at 13.95% a year to USD 140.46 million by 2035.
| Country | 2025 (USD million) | Share 2025 | 2035 (USD million) | CAGR 2025-2035 |
|---|---|---|---|---|
| United States | 823.25 | 86.50% | 2,158.03 | 10.12% |
| Canada | 90.42 | 9.50% | 255.39 | 10.94% |
| Mexico | 38.07 | 4.00% | 140.46 | 13.95% |
United States
The United States holds most of the region’s hyperscale and colocation load; Virginia’s Joint Legislative Audit and Review Commission (JLARC) found that unconstrained power demand in Virginia would double within 10 years, mainly from data centers (Source: JLARC, December 2024). U.S. DCIM grows 10.12% a year.
Canada
Canada is led by Montreal and Toronto; Alberta’s 1,200 MW interim cap pushes operators to meter and report load precisely, and Canadian DCIM grows 10.94% a year to 2035.
Mexico
Mexico is the fastest country at 13.95% a year because new hyperscale campuses in Querétaro are fitted with DCIM from day one, lifting its share from 4.00% to 5.50%.
Which North American Submarkets Spend the Most on DCIM?
Northern Virginia leads North America DCIM spending with USD 195.11 million in 2025, Querétaro is the fastest submarket at 16.16% a year, and Columbus (Ohio) grows 13.44% as hyperscale campuses spread west of Virginia.
| Rank | Submarket | Country | 2025 (USD million) | 2035 (USD million) | CAGR 2025-2035 |
|---|---|---|---|---|---|
| 1 | Northern Virginia | United States | 195.11 | 459.70 | 8.95% |
| 2 | Dallas-Fort Worth | United States | 66.62 | 191.54 | 11.14% |
| 3 | Phoenix | United States | 55.20 | 173.66 | 12.14% |
| 4 | Chicago | United States | 49.49 | 114.92 | 8.79% |
| 5 | Silicon Valley | United States | 45.68 | 91.94 | 7.25% |
| 6 | Atlanta | United States | 42.83 | 132.80 | 11.98% |
| 7 | Columbus (Ohio) | United States | 36.17 | 127.69 | 13.44% |
| 8 | New York-New Jersey | United States | 34.26 | 71.51 | 7.64% |
| 9 | Montreal (Quebec) | Canada | 32.36 | 97.05 | 11.61% |
| 10 | Hillsboro (Oregon) | United States | 31.41 | 81.72 | 10.03% |
| 11 | Toronto (Ontario) | Canada | 28.55 | 76.62 | 10.38% |
| 12 | Queretaro | Mexico | 22.84 | 102.16 | 16.16% |
Forecast Scenarios: What Could Change the North America DCIM Market by 2035?
DC Market Insights puts 2035 North America DCIM spending between USD 2.04 billion and USD 3.09 billion, around a base case of USD 2.55 billion.
| Scenario | 2035 (USD million) | CAGR 2025-2035 | What it assumes |
|---|---|---|---|
| Low | 2,043.10 | 7.94% | Grid limits slow new IT load to about 7,500 MW a year; hyperscalers keep in-house tools |
| Base | 2,553.88 | 10.37% | Installed IT load reaches 118,000 MW, 76% of it monitored; USD 11,000 per monitored MW a year |
| High | 3,090.19 | 12.50% | Utilities and states require metered load and curtailment reporting for every large data center |
Key Players and Market Share: Who Leads the North America DCIM Market?
The five largest North America DCIM vendors, Schneider Electric, Vertiv, Eaton, Sunbird Software and Carrier’s Nlyte, hold about 46% of 2025 value on DC Market Insights estimates built from product reach and installed sites; Schneider Electric leads with about 15%.
- Schneider Electric (EcoStruxure IT): FY2025 revenue of EUR 40.15 billion, up 9% organically, with North America up 15% and Software and Digital Services at 8% of revenue (Source: Schneider Electric, February 2026).
- Vertiv (Environet and Waylay software): Q4 2025 net sales of USD 2.88 billion, up 23%, and 2026 guidance of USD 13.25-13.75 billion (Source: Vertiv, February 2026).
- Eaton (Brightlayer Data Centers suite): power monitoring tied to its UPS and power distribution base.
- Sunbird Software (dcTrack and Power IQ): New Jersey-based specialist, Herman Chan CEO since January 2025 (Source: Sunbird Software).
- Carrier (Nlyte Software): acquired in October 2021 (Source: Carrier).
- Hyperview: cloud DCIM, chosen by Panduit in October 2024 (Source: Panduit).
- Freshworks (Device42): asset discovery, acquired in June 2024 (Source: Freshworks).
- Siemens: data center building and power management software.
- ABB: data center automation and power monitoring.
- Cisco: network-integrated infrastructure telemetry.
- IBM: asset and facilities management software.
- Hewlett Packard Enterprise (HPE): infrastructure monitoring for its server base.
- Delta Electronics: InfraSuite power and environment monitoring.
- FNT: infrastructure documentation and capacity software.
- Modius: OpenData DCIM for colocation and federal sites.
Concentration basis: DC Market Insights allocates 2025 software, hardware and services value by each vendor’s installed DCIM sites and bundled power and cooling sales in North America; no vendor holds more than 16%.
What Changed in North America DCIM Between June 2025 and December 2025?
Six dated events in North America DCIM since June 2025 tied grid rules and vendor strategy to a market DC Market Insights values at USD 1.13 billion in 2026.
- In June 2025, Texas enacted SB 6 with a 75 MW large-load threshold and curtailment equipment rules (Source: Texas Legislature).
- In June 2025, Schneider Electric launched rack power distribution units that connect to EcoStruxure IT (Source: Schneider Electric).
- In July 2025, Executive Order 14318 sped up federal permitting for data centers above 100 MW (Source: The White House).
- In August 2025, Vertiv acquired Waylay NV for AI-driven infrastructure software (Source: Vertiv).
- In September 2025, Mexico announced CloudHQ’s USD 4.8 billion, 900 MW Querétaro campus (Source: Presidencia de México).
- In December 2025, Sunbird Software released dcTrack 9.3 (Source: Sunbird Software).
Methodology: How the Model Sizes North America DCIM Spending
DC Market Insights built the North America Data Center Infrastructure Management (DCIM) Market bottom-up from 16 inputs: installed IT load (27,000 MW in 2020, 46,400 MW in 2025, 118,000 MW in 2035), new IT load per year (5,400 MW in 2025, 10,800 MW in 2035), the monitored share (38% in 2020, 52% in 2025, 76% in 2035), software per monitored MW a year, hardware per new MW and a services share of 30-36%. The 2025 receipt is 24,128 MW × USD 13,000 = USD 313.66 million plus 5,400 MW × USD 60,000 = USD 324.00 million, divided by (1 − 33% services) = USD 951.74 million. All component, deployment, type, end-user and country splits add to the total in every year.
- Ceiling 1: Schneider Electric’s Software and Digital Services are 8% of EUR 40.15 billion, about EUR 3.2 billion worldwide across all industries, well above the North American DCIM software in this model.
- Ceiling 2: USD 951.74 million over 46,400 MW of installed IT load is about USD 20.5 thousand per installed MW a year, under 3% of the yearly power bill of a fully used megawatt at USD 0.08 per kWh (about USD 700,000).
- Floor: federal metering for 100 kW and larger sites under M-19-19, plus the 75 MW Texas loads under SB 6, keep the monitored base above the 10,260 MW the model counts in 2020.
The full approach is set out in the DC Market Insights research methodology.
Table of contents
- 01Introduction
- 1.1Market Definition and Scope
- 1.2Included and Excluded Elements
- 1.3How the Segments Fit Together
- 1.4Why North America DCIM Estimates Differ
- 02Research Methodology
- 2.1Bottom-Up Model: Monitored MW, New MW and Services
- 2.2Bound Checks
- 2.3Source Ledger
- 03Executive Summary
- 3.1Market Snapshot, 2025, 2026 and 2035
- 3.2North America DCIM in Numbers
- 3.3Key Takeaways
- 04Market Dynamics
- 4.1Driver: Grid Operators Ask Data Centers to Prove Their Load
- 4.2Driver: Federal PUE Metering Above 100 kW
- 4.3Driver: Electricity Growth Makes Every Megawatt Worth Tracking
- 4.4Trend: Power and Cooling Vendors Fold DCIM Into Hardware
- 4.5Trend: Specialist DCIM Brands Change Hands
- 4.6Trend: AI Halls Need Rack and Liquid-Loop Monitoring
- 4.7Restraint: Hyperscalers Build Their Own Tools
- 4.8Restraint: Enterprise Rooms Shrink
- 4.9Opportunity: SaaS Monitoring for Colocation Tenants
- 4.10Opportunity: Mexico's Querétaro Corridor
- 05Pricing Analysis
- 5.1Software per Monitored MW, 2020-2035
- 5.2Hardware per New MW, 2020-2035
- 5.3Public Anchors
- 06Standards and Regulation
- 6.1OMB M-19-19
- 6.2OMB M-25-03
- 6.3Executive Order 14318
- 6.4Texas SB 6
- 6.5ASHRAE Standard 90.4-2022
- 6.6ENERGY STAR for Data Centers
- 6.7AESO Interim Large-Load Approach
- 07Market Segmentation by Component
- 7.1Software Platforms
- 7.2Sensors Meters and Gateways
- 7.3Services
- 08Market Segmentation by Deployment
- 8.1On-Premises Software
- 8.2Cloud and SaaS (Software as a Service)
- 09Market Segmentation by Data Center Type
- 9.1Hyperscale and Cloud Campuses
- 9.2Colocation Facilities
- 9.3Enterprise Data Centers
- 9.4Edge Sites
- 10Market Segmentation by End User
- 10.1Cloud and IT Services
- 10.2Banking and Financial Services
- 10.3Telecom Operators
- 10.4Government and Defense
- 10.5Healthcare
- 10.6Other Enterprises
- 11DC Exclusive: 20 MW Hall DCIM Cost Teardown
- 11.1Sensors meters and gateways at commissioning
- 11.2Integration and commissioning services
- 11.3Software subscription over 10 years
- 11.4Support, upgrades and managed monitoring over 10 years
- 11.5Total 10-year cost
- 12Country Analysis
- 12.1United States
- 12.2Canada
- 12.3Mexico
- 13Submarket Analysis
- 13.1Northern Virginia
- 13.2Dallas-Fort Worth
- 13.3Phoenix
- 13.4Chicago
- 13.5Silicon Valley
- 13.6Atlanta
- 13.7Columbus (Ohio)
- 13.8New York-New Jersey
- 13.9Montreal (Quebec)
- 13.10Hillsboro (Oregon)
- 13.11Toronto (Ontario)
- 13.12Queretaro
- 14Forecast Scenarios
- 14.1Low Case
- 14.2Base Case
- 14.3High Case
- 15Key Players and Market Share
- 15.1Schneider Electric
- 15.2Vertiv
- 15.3Eaton
- 15.4Sunbird Software
- 15.5Carrier (Nlyte Software)
- 15.6Hyperview
- 15.7Freshworks (Device42)
- 15.8Siemens
- 15.9ABB
- 15.10Cisco
- 15.11IBM
- 15.12Hewlett Packard Enterprise
- 15.13Delta Electronics
- 15.14FNT
- 15.15Modius
- 15.16Market Concentration
- 16Recent Developments
- 16.1June 2025 to December 2025
- Fig. 11. North America DCIM Market Size, 2020-2035 (USD million)
- Table 11. Report Attributes
- Table 22. Scope Comparison
- Table 33. DCIM Pricing per MW, 2020-2035
- Table 44. Market by Component, 2025 and 2035
- Table 55. Market by Deployment, 2025 and 2035
- Table 66. Market by Data Center Type, 2025 and 2035
- Table 77. Market by End User, 2025 and 2035
- Table 88. 20 MW Hall DCIM Cost Teardown
- Table 99. Market by Country, 2025 and 2035
- Table 1010. Top 12 Submarkets
- Table 1111. Forecast Scenarios, 2035
About this report
Written by Amit Jain and reviewed by Deepti Agrawal, Senior Editor, Research. Figures are built top-down and bottom-up and reconciled before publication, with 2025 as the base year.
Read our methodologyHow we built this
- Historical period2020-2024
- Base year2025
- Forecast period2026-2035
- Sizing approachTop-down + bottom-up
Need more than the report?
Advisory on this market
Due diligence, site selection and market entry work, by the analysts who wrote this report.
See consulting servicesFrequently asked questions
USD 1.13 billion in 2026, up 18.61% from USD 951.74 million in 2025, according to DC Market Insights estimates. The market is projected to reach USD 2.55 billion by 2035, a CAGR of 10.37% from 2025.
10.37% a year from 2025 to 2035, after 18.60% a year from 2020 to 2025, as monitored IT load rises from 24,128 MW to 89,680 MW.
Software, sensors, meters, gateways and services that monitor power, cooling, space and assets; North American spending was USD 951.74 million in 2025, with BMS, EPMS and power hardware counted separately.
About USD 13,000 per monitored MW a year for software and USD 60,000 per new MW for sensors and meters in 2025 (DC Market Insights estimate); a 20 MW hall costs about USD 5.16 million over 10 years.
Sensors Meters and Gateways, with USD 324.01 million or 34.04% of 2025 value, because every new megawatt needs metering at commissioning.
Cloud and SaaS deployment, at 14.94% a year from USD 399.73 million in 2025 to USD 1.61 billion in 2035, as colocation and hyperscale operators buy subscriptions.
The United States, with USD 823.25 million or 86.50% of 2025 value; Northern Virginia alone accounts for USD 195.11 million.
Mexico, at 13.95% a year from USD 38.07 million in 2025 to USD 140.46 million in 2035, led by Querétaro, where CloudHQ plans 900 MW.
Schneider Electric, Vertiv, Eaton, Sunbird Software and Carrier’s Nlyte hold about 46% of 2025 value (DC Market Insights estimate); Hyperview, Device42, Siemens and ABB also compete.
USD 1.13 billion in 2026 is the DC Market Insights figure for DCIM software, instrumentation and services. Estimates that add BMS, EPMS, power hardware controls or AIOps come out two to three times higher.
Get this report
How do I get the full report?
Request a quote; we reply by email within one business day.
How and when will I receive the report?
By email, within 24–48 business hours of payment.
How can I pay?
Once you accept the quote, we email you a secure payment link.
Can I see a sample first?
Yes. Request a free sample and we will email it to you.
Can the report be tailored to my needs?
Yes. We can add countries, segments or data cuts. Talk to an analyst about the scope you need.
Can I get an invoice or pay against a purchase order?
Write to sales@dcmarketinsights.com and our team will help.