
Data Center Liquid Cooling Manifolds Market Size, Share & Forecast to 2035
Market at a glance
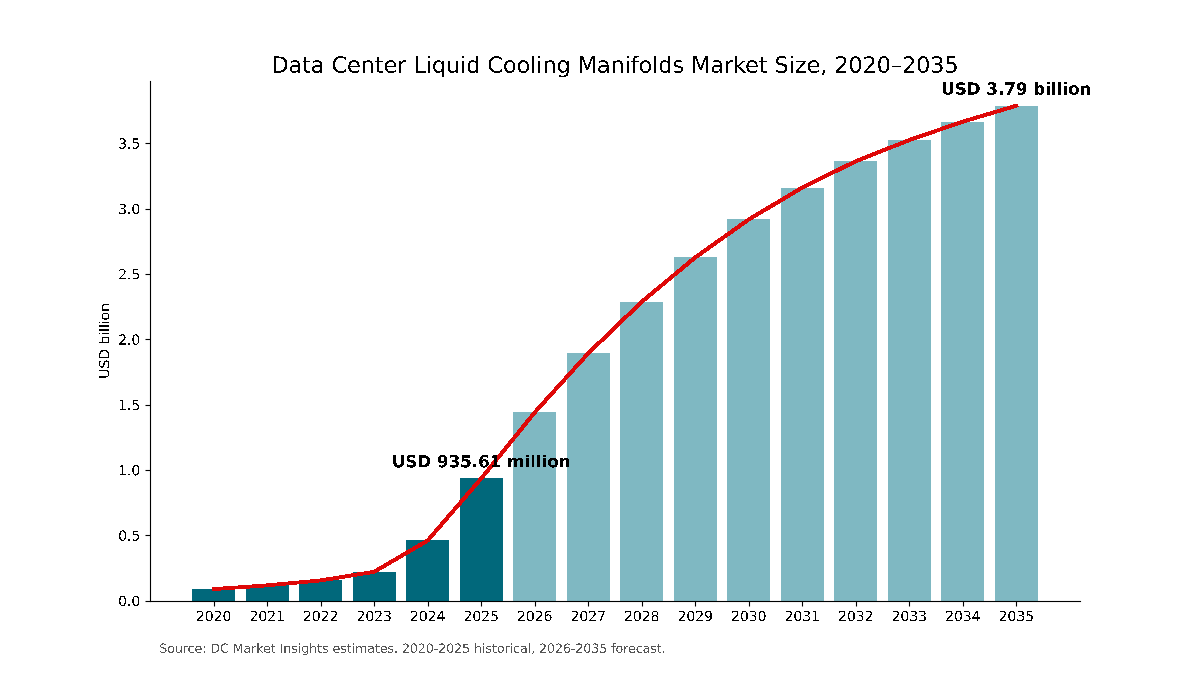
The Data Center Liquid Cooling Manifolds market was worth USD 935.6 million in 2025 and is forecast to reach USD 3,790.0 million by 2035, growing at a 15.01% CAGR. North America accounts for 46.2% of the market.
 By Satyabrat Rajawat, Senior Research Analyst, Strategic Advisory
 Reviewed by Deepti Agrawal
Last updated 10 Oct 2026
Base year 2025 PDF + Excel
Source: DC Market Insights analysis
Key findings
AI Racks at 132 kW Make Every New GPU Rack a Manifold Buyer
Universal Quick Disconnect Version 2.0 Standardizes the Manifold Port
Retrofits of Air-Cooled Halls Grow at Only 7.85%
Colocation Spend on Manifolds Reaches USD 1.02 billion by 2035
What is inside the report
- 01Introduction
- 02Research Methodology
- 03Executive Summary
- 04Market Dynamics
- 05Pricing and Cost Analysis
- 06Standards and Regulation
- 07Supply Chain and Value Chain Analysis
- 08Global Data Center Liquid Cooling Manifolds Market Size and Forecast
- 09Market by Manifold Type
- 10Market by Cooling Technology
- 21chapters
- 2020-2024Historical period
- 2026-2035Forecast period
- 16Companies profiled
Regional insights
- North America46.2%
- Asia Pacific25.1%
- Europe18.4%
- Middle East and Africa6.4%
- Latin America3.9%
Segmentation
Companies profiled
- Vertiv
- CoolIT Systems
- Schneider Electric (Motivair)
- nVent
- Delta Electronics
- Supermicro
- Parker Hannifin
- Danfoss
- Stäubli
- CPC
- Boyd
- Cooler Master
- Foxconn
- Auras
- AVC
- Flex (JetCool)
Recent developments
Danfoss completed its range of OCP-compliant blind-mate couplings for direct connection between servers and manifolds, made of 303 stainless steel (Source: Danfoss news release).
Vertiv announced it would acquire PurgeRite for about USD 1.00 billion in cash at closing plus up to USD 250.00 million tied to 2026 performance; the deal closed in December 2025 (Source: Vertiv press release).
Motivair, a Schneider Electric company, launched a 2.5 MW CDU alongside a product line that includes in-rack manifolds (Source: Data Center Dynamics news report).
Ecolab completed its acquisition of CoolIT Systems, agreed in March 2026 for about USD 4.75 billion in cash (Source: Ecolab SEC filing).
nVent said it had deployed more than 2 GW of liquid cooling and was leasing a second 160,000 square foot site in Blaine, Minnesota for liquid cooling (Source: Data Center Dynamics news report).
Full analysis
The Data Center Liquid Cooling Manifolds Market covers the coolant distribution manifolds that carry liquid from coolant distribution units (CDUs) to cold plates, immersion tanks and rear-door heat exchangers inside data centers: in-rack manifolds, row-based manifolds and facility-level technology cooling system (TCS) manifolds, valued with their integrated quick disconnects. DC Market Insights values the global Data Center Liquid Cooling Manifolds Market at USD 935.61 million in 2025 and forecasts USD 3.79 billion by 2035, a CAGR of 15.01%. The 2025 value is built from the build itself: about 4,150 MW of new liquid-cooled IT capacity at roughly USD 0.218 million of manifold content per MW gives USD 904.70 million, and replacement and expansion work on the installed liquid-cooled base adds USD 30.91 million. Two-phase direct-to-chip cooling is the fastest-growing technology segment at 28.77% a year because it handles the highest chip heat loads, and Asia Pacific is the fastest-growing region at 17.15% a year as China, India and Malaysia build liquid-cooled AI halls from the ground up.
Executive Summary
The Global Data Center Liquid Cooling Manifolds Market size was valued at USD 88.92 million in 2020, reached USD 935.61 million in 2025, and is anticipated to reach USD 3.79 billion by 2035, at a CAGR of 15.01% during the forecast period.
| Report attribute | Details |
|---|---|
| Historical Period | 2020-2024 |
| Base Year | 2025 |
| Forecast Period | 2026-2035 |
| Data Center Liquid Cooling Manifolds Market Size 2025 | USD 935.61 Million |
| Data Center Liquid Cooling Manifolds Market, CAGR | 15.01% |
| Data Center Liquid Cooling Manifolds Market Size 2035 | USD 3.79 Billion |
DC Market Insights estimates that the market grew at 60.11% a year between 2020 and 2025, and that 2025 alone added 102.9% over 2024 as new liquid-cooled capacity more than doubled. Supermicro’s GB200 NVL72 rack, a rack-scale graphics processing unit (GPU) system, operates at 125 kW to 135 kW, and Supermicro’s DLC-2 design distributes coolant through vertical manifolds in the rack. Growth slows to 15.01% a year from 2025 to 2035 because rack density keeps rising: more compute per rack means fewer racks, and fewer manifolds, per MW, even as new liquid-cooled capacity grows from 4,150 MW in 2025 to 20,400 MW in 2035. The market passes USD 1.44 billion in 2026.
Market Scope: What Does the Data Center Liquid Cooling Manifolds Market Cover?
The Data Center Liquid Cooling Manifolds Market covers every manifold that splits, routes and collects coolant between the CDU and the IT equipment in a liquid-cooled data center, valued at first sale in current US dollars, with 2025 as the base year and forecasts to 2035. DC Market Insights sizes it at USD 935.61 million in 2025.
Included. In-rack manifolds (the vertical supply and return rails in each rack, with their quick disconnect ports), row-based manifolds (piping assemblies that feed a row of racks from a CDU), facility-level TCS manifolds and headers, the quick disconnects and blind-mate couplings mounted on those manifolds, and the valves, sensors, flow and cooling meters and brackets sold as part of a manifold assembly. Vertiv describes in-rack manifolds as “the final distribution point within each server rack” and row-based manifolds as piping assemblies that distribute coolant to the racks.
Excluded. CDUs, pumps, cold plates, immersion tanks, chillers, facility water piping outside the white space, coolant fluids and installation labor. These are covered in the Data Center Liquid Cooling Market report. Thermal simulation tools and software used to design cooling loops are also excluded.
How the segments fit together. Every split below re-cuts the same USD 935.61 million: by manifold type, cooling technology, data center type (including high-performance computing (HPC) and research centers), material, design and installation. The cross-section in the DC Exclusive section shows manifold type against data center type.
Market Drivers: What Drives the Liquid Cooling Manifold Market?
Rack-scale AI systems drawing 132 kW per rack drive the Data Center Liquid Cooling Manifolds Market. Two more drivers add to them: a rise in new liquid-cooled capacity from 4,150 MW to 20,400 MW a year, and open quick disconnect standards that let hyperscalers buy manifolds for distributing coolant from many suppliers.
AI Racks at 132 kW Make Every New GPU Rack a Manifold Buyer
The NVIDIA GB300 NVL72 is a fully liquid-cooled, rack-scale design that integrates 72 Blackwell Ultra GPUs, and Supermicro’s GB200 NVL72 rack carries eight 33 kW power shelves for a total of 132 kW. Supermicro’s DLC-2 design “utilizes vertical coolant distribution manifolds (CDMs)” and captures up to 98% of rack heat in liquid. DC Market Insights estimates the manifold content of a liquid-cooled hall at USD 0.218 million per MW in 2025, of which in-rack manifolds take 49.3%; at 132 kW per rack that is about USD 14,187 of in-rack manifold hardware per rack. Supermicro targeted capacity of up to 6,000 racks a month by its fiscal year 2026, including 3,000 racks a month optimized for direct liquid cooling.
New Liquid-Cooled Capacity Rises from 4,150 MW to 20,400 MW a Year
The Data Center Liquid Cooling Manifolds Market is a build market first: 96.7% of 2025 spending went into newly commissioned liquid-cooled capacity. The International Energy Agency (IEA) estimates that data centers used about 415 TWh of electricity in 2024, around 1.5% of world consumption, and expects that to more than double to about 945 TWh by 2030. DC Market Insights models new liquid-cooled IT capacity rising from 4,150 MW in 2025 to 14,600 MW in 2030 and 20,400 MW in 2035, which lifts the installed liquid-cooled base from about 9.7 GW to about 155.6 GW.
Vertiv’s Backlog Doubles to USD 15.00 Billion as Thermal Orders Surge
Supplier order books show the demand. Vertiv reported fourth-quarter 2025 organic orders up about 252% on the prior year, a book-to-bill ratio of about 2.9 times and a backlog of USD 15.00 billion at the end of 2025, up 109% (Source: Vertiv filing with the US Securities and Exchange Commission). In the second quarter of 2026 Vertiv’s net sales rose 24% to USD 3.27 billion, and the company expects full-year 2026 net sales of USD 14.00 billion with 31% organic growth. In November 2025 Vertiv agreed to buy PurgeRite, a Houston-based provider of mechanical flushing, purging and filtration services for data centers, for about USD 1.00 billion in cash at closing to expand its liquid cooling services portfolio, and completed the deal in December 2025. DC Market Insights treats these thermal and power orders as a leading indicator of manifold demand.
Market Trends: How Are Liquid Cooling Manifolds Changing?
The Data Center Liquid Cooling Manifolds Market is moving toward standard quick disconnect interfaces, stainless steel and polymer construction, and open CDU and rack designs shared through the Open Compute Project (OCP).
Universal Quick Disconnect Version 2.0 Standardizes the Manifold Port
The OCP Universal Quick Disconnect (UQD) specification version 2.0.0 covers couplings for single-phase water and glycol systems, sets a maximum operating pressure of 6.89 bar (100 psi) and an operating range of 5°C to 65°C (Source: Open Compute Project UQD specification). Its contributors include AMD, CoolIT, CPC, Danfoss, Nvidia, Stäubli and Parker. Stäubli describes version 2 as an evolution of the original standard first developed in 2020. A standard port lets a hyperscaler mix manifolds and servers from different suppliers, which widens the supplier base and pushes manifold prices down.
Stainless Steel Leads, Engineering Plastics Grow Fastest at 18.86%
Stainless steel accounts for 57.4% of 2025 manifold value, worth USD 537.04 million. Vertiv’s row manifolds use 304L stainless steel with sanitary tri-clamp fittings, nVent’s RackChiller rack manifold uses extruded stainless steel, and Danfoss makes its blind-mate couplings from 303 stainless steel. Engineering plastics and composites grow fastest among materials at 18.86% a year, reaching USD 1.01 billion by 2035, because polymer manifolds weigh less and cannot corrode in glycol loops.
Open Rack Designs Move Manifolds to Blind-Mate Connections
The OCP Open Rack V3 (ORV3) blind-mate quick connector specification mounts the socket on the manifold and the plug on the server chassis, uses a 25% propylene glycol mixture as test fluid and sets a maximum working pressure of 3.45 bar (50 psi). Google contributed its Project Deschutes CDU design to OCP, and Boyd, Cooler Master, Delta, Envicool, Nidec, nVent and Vertiv showed Deschutes-based CDUs at 2025 events such as the OCP Global Summit and SuperComputing 2025. Blind-mate manifolds let a technician slide a server in without touching a hose, which cuts service time and leak risk.
Market Challenges: What Holds the Liquid Cooling Manifold Market Back?
Retrofit complexity and price pressure from a crowded supplier field are the two constraints that DC Market Insights expects to slow the Data Center Liquid Cooling Manifolds Market; retrofit work grows only 7.85% a year to 2035.
Retrofits of Air-Cooled Halls Grow at Only 7.85%
Retrofits of existing halls are worth USD 217.13 million in 2025, 23.2% of the market, and reach USD 462.33 million by 2035. Older halls lack facility water at the row, floor loading for filled manifolds and space for CDUs, so operators retrofit only the zones that host AI racks. Retrofit loops also need flushing, filtration and commissioning work that new factory-built racks avoid, which adds cost per MW.
Eight Rack Manifold Vendors at One Show Push Prices Down
Barriers to entry for rack manifolds are low. ServeTheHome counted eight vendors making NVIDIA MGX rack manifolds at GTC 2025: Pinda, LiteOn, Lead Wealth, Foxconn, Delta, Cooler Master, AVC and Auras. DC Market Insights models manifold content per MW falling 3.6% a year from USD 0.218 million in 2025 to USD 0.151 million in 2035, as more suppliers compete on price and higher rack density spreads each manifold over more kilowatts.
Market Opportunities: Where Are the New Revenue Pools in Liquid Cooling Manifolds?
Colocation data centers, growing at 17.03% a year, are the largest new revenue pool in the Data Center Liquid Cooling Manifolds Market. Replacement and expansion work on the installed base is the second, growing from USD 30.91 million to USD 704.78 million.
Colocation Spend on Manifolds Reaches USD 1.02 billion by 2035
Colocation data centers spent USD 211.45 million on manifolds in 2025, and DC Market Insights expects USD 1.02 billion by 2035, lifting their share from 22.6% to 26.9%. Colocation operators build liquid-ready halls before they know the tenant, so they buy row and facility manifolds with spare ports and modular branches. The CDU side of these loops is covered in the Data Center Cooling CDU Pumps Market report.
Replacement and Expansion Grows at 36.71% a Year
DC Market Insights assumes operators replace or extend in-rack manifolds when they refresh servers, because each GPU generation can change cold plate layouts, flow rates and port counts. DC Market Insights models replacement and expansion at USD 30.91 million in 2025 and USD 704.78 million in 2035, when it reaches 18.6% of the Data Center Liquid Cooling Manifolds Market.
Pricing: How Much Do Liquid Cooling Manifolds Cost per MW?
A liquid-cooled data center hall spends about USD 0.218 million on manifolds per MW of IT load in 2025, or about USD 218,000 per MW. These are DC Market Insights estimates covering in-rack, row and facility manifolds with their quick disconnects, excluding labor.
| Manifold content per MW | 2020 | 2025 | 2030 | 2035 |
|---|---|---|---|---|
| USD million per MW | 0.262 | 0.218 | 0.181 | 0.151 |
| New liquid-cooled capacity (MW) | 310 | 4,150 | 14,600 | 20,400 |
Content per MW fell from USD 0.262 million in 2020 to USD 0.218 million in 2025 as average liquid-cooled rack power rose, and DC Market Insights expects it to keep falling 3.6% a year. In-rack manifolds carry about USD 14,187 per 132 kW rack in 2025. Stainless steel and quick disconnect pricing are the two largest cost items; the UQD standard makes quick disconnects interchangeable, which compresses their price.
Standards and Regulation: Which Standards Shape Liquid Cooling Manifolds?
Three sets of standards decide how a liquid cooling manifold is built: the OCP quick disconnect and rack specifications, the American Society of Heating, Refrigerating and Air-Conditioning Engineers (ASHRAE) liquid cooling classes, and vendor approval lists for GPU platforms.
OCP UQD 2.0.0 and ORV3 blind-mate connector. UQD 2.0.0 sets 6.89 bar maximum operating pressure and a 5°C to 65°C range for water and glycol systems. The ORV3 blind-mate quick connector specification sets 3.45 bar maximum working pressure and tests with a 25% propylene glycol mixture. Manifolds with UQD or blind-mate ports must meet these pressure and temperature ratings.
ASHRAE TC 9.9 liquid cooling classes. ASHRAE moved to the liquid cooling class definitions W17, W27, W32, W40, W45 and W+. The class an operator designs for sets the water temperatures and flow rates the manifold loop must handle.
GPU platform approval. Stäubli’s UQD and blind-mate couplings are on NVIDIA’s Recommended Vendor List, and Parker’s push-button UQD couplings were developed to OCP specifications with a 7 bar (100 psi) maximum operating pressure. Approval lists act as a de facto qualification step for manifold suppliers serving GPU racks.
Market Segmentation: Which Segment Leads the Data Center Liquid Cooling Manifolds Market?
In-rack manifolds lead the Data Center Liquid Cooling Manifolds Market with 49.3% of 2025 value, single-phase direct-to-chip cooling leads technologies with 78.4%, and hyperscale data centers lead buyers with 47.8%. The fastest-growing segment is two-phase direct-to-chip cooling at 28.77% a year, because DC Market Insights expects the hottest accelerators to move to refrigerant-based cold plates.
By Manifold Type: In-Rack Manifolds Lead with 49.3%
| Manifold type | 2025 (USD million) | Share 2025 | 2035 (USD billion) | CAGR 2025-2035 |
|---|---|---|---|---|
| In-Rack Manifolds | 461.26 | 49.3% | 1.73 | 14.14% |
| Row-Based Manifolds | 295.65 | 31.6% | 1.34 | 16.32% |
| Facility-Level (TCS) Manifolds | 178.70 | 19.1% | 0.72 | 14.88% |
Row-based manifolds grow fastest at 16.32% a year because colocation halls and large AI rows move from in-rack CDUs to row-level CDUs that feed many racks through one manifold.
By Cooling Technology: Single-Phase Direct-to-Chip Leads with 78.4%
| Cooling technology | 2025 (USD million) | Share 2025 | 2035 (USD billion) | CAGR 2025-2035 |
|---|---|---|---|---|
| Single-Phase Direct-to-Chip | 733.52 | 78.4% | 2.66 | 13.74% |
| Two-Phase Direct-to-Chip | 29.00 | 3.1% | 0.36 | 28.77% |
| Immersion Cooling | 58.01 | 6.2% | 0.32 | 18.55% |
| Hybrid and Rear-Door Liquid Cooling | 115.08 | 12.3% | 0.45 | 14.53% |
Single-phase direct-to-chip loops with water and glycol remain the default for GPU racks, and their share falls only to 70.2% by 2035. DC Market Insights models fewer, larger manifolds per MW in immersion cooling, so its 6.2% share of manifold value is lower than its share of liquid-cooled capacity. Readers comparing cold plate approaches can see the Direct-to-Chip Liquid Cooling Market report.
By Data Center Type: Hyperscale Data Centers Lead with 47.8%
| Data center type | 2025 (USD million) | Share 2025 | 2035 (USD billion) | CAGR 2025-2035 |
|---|---|---|---|---|
| Hyperscale Data Centers | 447.22 | 47.8% | 1.71 | 14.36% |
| Colocation Data Centers | 211.45 | 22.6% | 1.02 | 17.03% |
| GPU and Neocloud Data Centers | 144.08 | 15.4% | 0.54 | 14.16% |
| Enterprise Data Centers | 57.07 | 6.1% | 0.24 | 15.56% |
| HPC and Research Data Centers | 64.56 | 6.9% | 0.19 | 11.58% |
| Edge Data Centers | 11.23 | 1.2% | 0.08 | 21.62% |
Edge data centers grow fastest from a small base at 21.62% a year, and colocation gains the most share. GPU and neocloud operators spent USD 144.08 million in 2025, while HPC and research centers grow slowest at 11.58% because HPC centers adopted liquid cooling earlier and add capacity in fewer, larger steps.
By Material: Stainless Steel Leads with 57.4%
Stainless steel manifolds are worth USD 537.04 million in 2025 and USD 2.00 billion by 2035. Engineering plastics and composites hold 19.2% and reach 26.7% by 2035. Copper and brass hold 13.8% and grow slowest at 11.02%, while aluminum holds 9.6% and grows at 16.37% a year.
By Design: Multi-Circuit Manifolds Lead with 44.9%
Multi-circuit manifolds are worth USD 420.08 million in 2025 because AI racks split supply across compute trays and switch trays. Modular manifolds grow fastest at 17.57% a year and reach USD 1.45 billion by 2035, as colocation operators add branches hall by hall. Custom engineered manifolds, the custom cooling system manifolds built for specific data center infrastructure such as HPC halls, hold 12.6% and single-circuit manifolds 11.7%.
By Installation: New Builds Lead with 73.5%
New builds (greenfield) take USD 687.57 million in 2025 and USD 2.62 billion by 2035. Retrofits of existing halls take USD 217.13 million, and replacement and expansion grows fastest at 36.71% a year as the installed base ages through GPU generations.
DC Exclusive: The Manifold Content per MW Model and Manifold Type × Data Center Type Matrix
At USD 225.11 million in 2025, in-rack manifolds in hyperscale data centers are the single largest cell of the matrix and 24.1% of all manifold spending. The matrix cross-tabulates what is bought against who buys it.
| 2025, USD million | In-Rack | Row-Based | Facility-Level (TCS) | Total |
|---|---|---|---|---|
| Hyperscale Data Centers | 225.11 | 143.04 | 79.07 | 447.22 |
| Colocation Data Centers | 91.68 | 69.85 | 49.92 | 211.45 |
| GPU and Neocloud Data Centers | 81.14 | 43.15 | 19.79 | 144.08 |
| Enterprise Data Centers | 27.04 | 16.56 | 13.47 | 57.07 |
| HPC and Research Data Centers | 29.29 | 20.03 | 15.24 | 64.56 |
| Edge Data Centers | 7.00 | 3.02 | 1.21 | 11.23 |
| Total | 461.26 | 295.65 | 178.70 | 935.61 |
GPU and neocloud operators spend 56.3% of their manifold budget on in-rack manifolds, the highest of the large buyers, because they buy complete liquid-cooled racks from server makers. Colocation operators spend 23.6% on facility-level manifolds, more than any other large buyer, because they build the TCS loop before tenants arrive. A supplier strong only in rack manifolds is selling mainly to hyperscale and GPU cloud buyers through server makers; a supplier of row and facility manifolds sells directly to colocation and mechanical contractors.
The matrix is a DC Market Insights model, not a shipment count. It is built from 61 inputs: 16 annual cohorts of new liquid-cooled capacity (2020 to 2035), 16 annual values of manifold content per MW, 16 replacement-rate values, 6 data center type rows and 3 manifold type columns, plus 4 supplier disclosures used as a cross-check. The model and its assumptions are explained on our research methodology page.
Regional Insights: Which Region Leads the Data Center Liquid Cooling Manifolds Market?
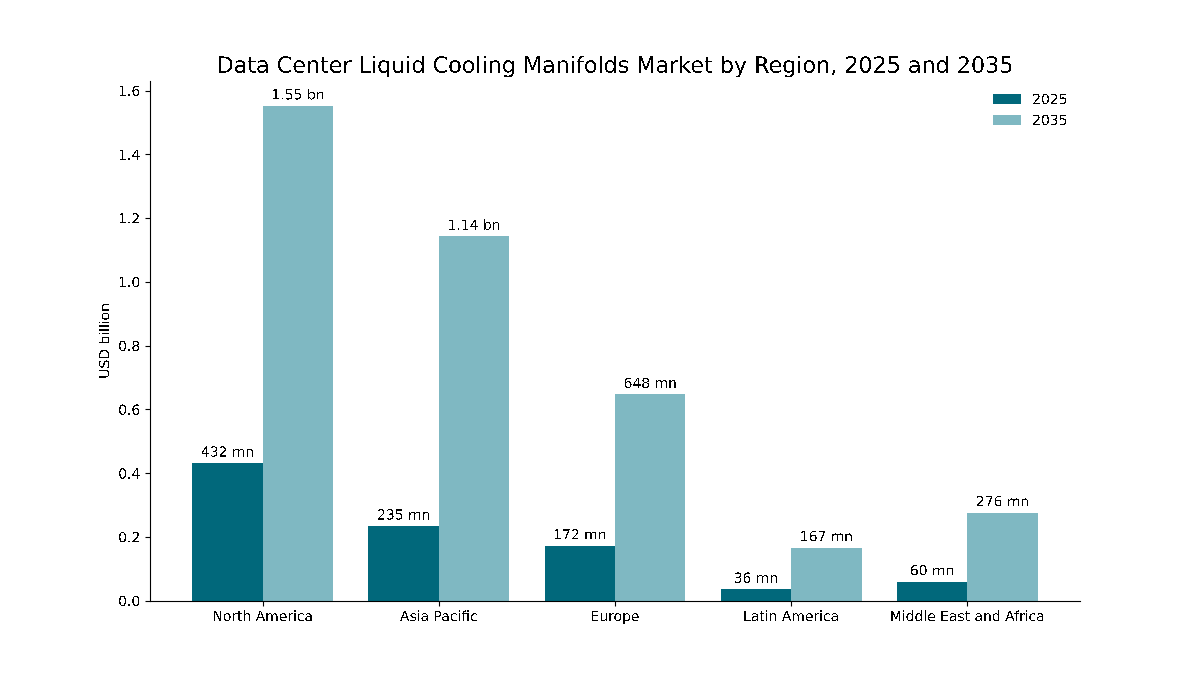
North America leads the Data Center Liquid Cooling Manifolds Market with 46.2% of 2025 value, and Asia Pacific is the fastest-growing region at 17.15% a year, because China, India and Malaysia are building liquid-cooled AI capacity from the start.
North America Leads with 46.2% Share
North American operators spent USD 432.25 million on liquid cooling manifolds in 2025, and the region is forecast to reach USD 1.55 billion by 2035, a CAGR of 13.64%. The United States alone accounts for USD 392.02 million. nVent has deployed more than 2 GW of liquid cooling and is leasing a second 160,000 square foot site in Blaine, Minnesota for liquid cooling. North America loses 5.2 points of share by 2035 as other regions catch up, not because its volume slows.
Asia Pacific Holds 25.1% Share
Asia Pacific is worth USD 234.84 million in 2025 and USD 1.14 billion by 2035. China is the second-largest country market at USD 104.79 million, and India grows fastest of any large country at 21.49% a year. The eight NVIDIA MGX rack manifold makers counted at GTC 2025 include Foxconn, Delta, Cooler Master, AVC and Auras. Asia Pacific gains 5.1 points of share, the largest gain of any region.
Europe Holds 18.4% Share
Europe is worth USD 172.15 million in 2025 and USD 647.57 million by 2035, a CAGR of 14.17%. The United Kingdom, Germany and France are the largest markets, and Danfoss and Stäubli make UQD and blind-mate couplings for liquid cooling.
Middle East and Africa Holds 6.4% Share
The Middle East and Africa is worth USD 59.88 million in 2025 and USD 276.45 million by 2035, a CAGR of 16.53%, led by Saudi Arabia and the United Arab Emirates, where new AI halls are designed for liquid cooling from the start.
Latin America Holds 3.9% Share
Latin America is worth USD 36.49 million in 2025 and USD 166.63 million by 2035, a CAGR of 16.40%, led by Brazil, Mexico and Chile.
Country Analysis: Which Countries Buy the Most Liquid Cooling Manifolds?
The United States is the largest country market for liquid cooling manifolds at USD 392.02 million in 2025, 41.9% of global value, followed by China at USD 104.79 million (11.2%). The 12 largest countries account for 81.8% of 2025 spending.
| Rank | Country | Region | 2025 (USD million) | Share 2025 | 2035 (USD billion) | CAGR 2025-2035 |
|---|---|---|---|---|---|---|
| 1 | United States | North America | 392.02 | 41.9% | 1.39 | 13.46% |
| 2 | China | Asia Pacific | 104.79 | 11.2% | 0.48 | 16.37% |
| 3 | United Kingdom | Europe | 38.36 | 4.1% | 0.13 | 13.20% |
| 4 | Canada | North America | 37.42 | 4.0% | 0.15 | 14.72% |
| 5 | Germany | Europe | 33.68 | 3.6% | 0.12 | 13.66% |
| 6 | Japan | Asia Pacific | 31.81 | 3.4% | 0.12 | 14.66% |
| 7 | India | Asia Pacific | 24.33 | 2.6% | 0.17 | 21.49% |
| 8 | Saudi Arabia | Middle East and Africa | 22.45 | 2.4% | 0.11 | 17.21% |
| 9 | Malaysia | Asia Pacific | 21.52 | 2.3% | 0.11 | 18.10% |
| 10 | France | Europe | 20.58 | 2.2% | 0.08 | 15.01% |
| 11 | United Arab Emirates | Middle East and Africa | 19.65 | 2.1% | 0.09 | 16.55% |
| 12 | Australia | Asia Pacific | 18.71 | 2.0% | 0.09 | 16.63% |
India is the fastest-growing country market at 21.49% a year, ahead of Malaysia at 18.10%, as AI halls outside the established hubs are designed for liquid cooling from day one. The country figures are a DC Market Insights allocation of the regional totals, weighted by each country’s estimated share of installed and new liquid-cooled capacity.
Forecast Scenarios: How Could the 2035 Forecast Change?
The Data Center Liquid Cooling Manifolds Market reaches USD 3.79 billion by 2035 in the base case, with a range of USD 2.84 billion to USD 4.58 billion across the low and high scenarios.
| Scenario | Assumption from 2026 | 2035 (USD billion) | CAGR 2025-2035 |
|---|---|---|---|
| Low | New liquid-cooled capacity 18% below base; content per MW falls 4.5% a year | 2.84 | 11.73% |
| Base | New capacity rises to 20,400 MW a year; content per MW falls 3.6% a year | 3.79 | 15.01% |
| High | New capacity 15% above base; content per MW falls 3.1% a year | 4.58 | 17.21% |
The low case is what a pause in AI capital spending looks like, combined with faster price erosion from the UQD standard. The high case assumes grid connections keep pace with announced AI campuses. Two-phase cooling is the main technical swing factor: it moves value from water manifolds to refrigerant manifolds with higher pressure ratings, which affects the mix more than the total.
Competitive Insights: Who Leads the Data Center Liquid Cooling Manifolds Market?
- Vertiv
- CoolIT Systems
- Schneider Electric (Motivair)
- nVent
- Delta Electronics
- Supermicro
- Parker Hannifin
- Danfoss
- Stäubli
- CPC
- Boyd
- Cooler Master
- Foxconn
- Auras
- AVC
- Flex (JetCool)
DC Market Insights estimates that the five largest suppliers, Vertiv, CoolIT Systems, Schneider Electric (Motivair), nVent and Delta Electronics, together held about 38% of the Data Center Liquid Cooling Manifolds Market in 2025, and that no single supplier held more than 11% (DC Market Insights estimate, built from manifold content in each supplier’s disclosed liquid cooling revenue and capacity). Ecolab completed its USD 4.75 billion acquisition of CoolIT Systems on July 2, 2026; when it agreed the deal in March 2026, Ecolab said CoolIT, whose products include CDUs, cold plates, liquid loops and rack manifolds, was expected to generate about USD 550.00 million of sales over the next 12 months (Source: Ecolab filing with the US Securities and Exchange Commission). Schneider Electric bought an initial 75% controlling stake in Motivair, whose products include in-rack manifolds, and expects to buy the remaining 25% in 2028. nVent reported second-quarter 2026 sales of USD 1.50 billion, up 53%, with significant data center growth and new products contributing more than 30 points to sales growth. Flex acquired JetCool, whose CDU provides cooling for racks up to 300 kW. Parker Hannifin, Danfoss, Stäubli and CPC make UQD couplings of the kind mounted on manifolds, with CPC adding a 3/8-inch Everis UQD06 size in July 2025, while Foxconn, Delta, Cooler Master, Auras and AVC build rack manifolds for GPU server platforms.
Recent Developments
- In August 2025, Danfoss completed its range of OCP-compliant blind-mate couplings for direct connection between servers and manifolds, made of 303 stainless steel (Source: Danfoss news release).
- In November 2025, Vertiv announced it would acquire PurgeRite for about USD 1.00 billion in cash at closing plus up to USD 250.00 million tied to 2026 performance; the deal closed in December 2025 (Source: Vertiv press release).
- In January 2026, Motivair, a Schneider Electric company, launched a 2.5 MW CDU alongside a product line that includes in-rack manifolds (Source: Data Center Dynamics news report).
- In July 2026, Ecolab completed its acquisition of CoolIT Systems, agreed in March 2026 for about USD 4.75 billion in cash (Source: Ecolab SEC filing).
- In August 2026, nVent said it had deployed more than 2 GW of liquid cooling and was leasing a second 160,000 square foot site in Blaine, Minnesota for liquid cooling (Source: Data Center Dynamics news report).
We follow these deals, launches and capacity announcements as they happen in our data center industry updates.
Methodology: How We Built the Data Center Liquid Cooling Manifolds Market Model
DC Market Insights built this market bottom-up from 16 annual cohorts of new liquid-cooled IT capacity (2020 to 2035), each priced with a manifold content per MW that falls from USD 0.262 million in 2020 to USD 0.151 million in 2035. Replacement and expansion spending was added on the installed liquid-cooled base at 2.1% of content per MW a year in 2020, rising 0.09 points a year. The total was split by 3 manifold types, 4 cooling technologies, 6 data center types, 4 materials, 4 designs, 3 installation types and 5 regions, and every split sums to the market total. The result was checked top-down against 4 supplier disclosures (Vertiv, Ecolab for CoolIT, nVent and Supermicro) and against IEA electricity demand estimates. Country values allocate each regional total by country weights for installed and new liquid-cooled capacity. The analyst named on this page built the model, and the reviewer checked the arithmetic, the sources and the dates before publication.
Table of contents
- 01Introduction
- 1.1Market Definition and Scope
- 1.2Manifold Types, Technologies, Buyers and Regions Covered
- 1.3Currency, Base Year and Forecast Period
- 1.4Key Questions Answered
- 02Research Methodology
- 2.1Manifold Content per MW Model
- 2.2Liquid-Cooled Capacity Cohorts, 2020-2035
- 2.3Replacement and Expansion Model
- 2.4Top-Down Check Against Supplier Disclosures
- 2.5Assumptions and Limitations
- 03Executive Summary
- 3.1Market at a Glance, 2020-2035
- 3.2Key Findings
- 3.3Analyst Recommendations by Buyer Type
- 04Market Dynamics
- 4.1Drivers
- 4.2Challenges and Restraints
- 4.3Opportunities
- 4.4Trends
- 4.5Impact Analysis of Drivers and Challenges, 2025-2035
- 05Pricing and Cost Analysis
- 5.1Manifold Content per MW, 2020-2035
- 5.2In-Rack Manifold Cost per Rack, 2025
- 5.3Quick Disconnect Price Trends
- 5.4Price Outlook by Manifold Type, 2026-2030
- 06Standards and Regulation
- 6.1OCP Universal Quick Disconnect (UQD) 2.0.0
- 6.2OCP ORV3 Blind-Mate Quick Connector
- 6.3ASHRAE TC 9.9 Liquid Cooling Classes
- 6.4GPU Platform Vendor Approval Lists
- 07Supply Chain and Value Chain Analysis
- 7.1Stainless Steel, Polymer and Coupling Supply
- 7.2Rack Manifold Manufacturing
- 7.3CDU and Liquid Cooling System Integrators
- 7.4Mechanical Contractors and Commissioning Services
- 08Global Data Center Liquid Cooling Manifolds Market Size and Forecast
- 8.1Market Size, 2020-2024
- 8.2Market Size, 2025
- 8.3Market Forecast, 2026-2035
- 8.4New-Build vs Replacement Spending
- 09Market by Manifold Type
- 9.1In-Rack Manifolds
- 9.2Row-Based Manifolds
- 9.3Facility-Level (TCS) Manifolds
- 10Market by Cooling Technology
- 10.1Single-Phase Direct-to-Chip
- 10.2Two-Phase Direct-to-Chip
- 10.3Immersion Cooling
- 10.4Hybrid and Rear-Door Liquid Cooling
- 11Market by Data Center Type
- 11.1Hyperscale Data Centers
- 11.2Colocation Data Centers
- 11.3GPU and Neocloud Data Centers
- 11.4Enterprise Data Centers
- 11.5HPC and Research Data Centers
- 11.6Edge Data Centers
- 12Market by Material
- 12.1Stainless Steel
- 12.2Copper and Brass
- 12.3Aluminum
- 12.4Engineering Plastics and Composites
- 13Market by Design
- 13.1Single-Circuit Manifolds
- 13.2Multi-Circuit Manifolds
- 13.3Modular Manifolds
- 13.4Custom Engineered Manifolds
- 14Market by Installation
- 14.1New Builds (Greenfield)
- 14.2Retrofit of Existing Halls
- 14.3Replacement and Expansion
- 15DC Exclusive: Manifold Type × Data Center Type Matrix
- 15.1Manifold Type × Data Center Type Matrix, 2025
- 15.2Manifold Content per MW Model
- 15.3Implications for Suppliers
- 16Market by Region
- 16.1North America (United States, Canada, Mexico)
- 16.2Europe (United Kingdom, Germany, France, Netherlands, Ireland, Nordics, Italy, Spain, Rest of Europe)
- 16.3Asia Pacific (China, Japan, India, Malaysia, Australia, South Korea, Singapore, Taiwan, Rest of Asia Pacific)
- 16.4Latin America (Brazil, Mexico, Chile, Rest of Latin America)
- 16.5Middle East and Africa (Saudi Arabia, United Arab Emirates, Israel, South Africa, Rest of Middle East and Africa)
- 16.6Top 12 Countries, 2025 and 2035
- 17Regional Cross-Sections
- 17.1Region × Manifold Type, 2025 and 2035
- 17.2Region × Data Center Type, 2025 and 2035
- 18Forecast Scenarios
- 18.1Base, Low and High Cases to 2035
- 18.2Sensitivity to New Liquid-Cooled Capacity
- 18.3Sensitivity to Manifold Content per MW
- 18.4Two-Phase Cooling and the Manifold Mix
- 19Competitive Landscape
- 19.1Top-Five Supplier Concentration, 2025
- 19.2Mergers and Acquisitions, 2024-2026
- 19.3Product Launches and Standards Participation
- 20Company Profiles
- 20.1Vertiv
- 20.2CoolIT Systems
- 20.3Schneider Electric (Motivair)
- 20.4nVent
- 20.5Delta Electronics
- 20.6Supermicro
- 20.7Parker Hannifin
- 20.8Danfoss
- 20.9Stäubli
- 20.10CPC
- 20.11Boyd
- 20.12Cooler Master
- 20.13Foxconn
- 20.14Auras
- 20.15AVC
- 20.16Flex (JetCool)
- 21Analyst Recommendations
- 21.1For Manifold and Coupling Suppliers
- 21.2For Hyperscale and Colocation Operators
- 21.3For Investors
- Fig. 1Data Center Liquid Cooling Manifolds Market Size, 2020-2035
- Fig. 2New Liquid-Cooled Capacity per Year, 2020-2035
- Fig. 3Manifold Content per MW, 2020-2035
- Fig. 4New-Build vs Replacement Spending, 2020-2035
- Fig. 5Market Share by Manifold Type, 2025 and 2035
- Fig. 6Market Share by Cooling Technology, 2025 and 2035
- Fig. 7Market Share by Data Center Type, 2025 and 2035
- Fig. 8Manifold Type × Data Center Type Matrix, 2025
- Fig. 9Market by Region, 2025 and 2035
- Fig. 10Top 12 Countries, 2025
- Fig. 11Forecast Scenarios, 2025-2035
- Table 1Report Attributes
- Table 2Manifold Content per MW, 2020-2035
- Table 3Market by Manifold Type, 2025 and 2035
- Table 4Market by Cooling Technology, 2025 and 2035
- Table 5Market by Data Center Type, 2025 and 2035
- Table 6Market by Material, 2025 and 2035
- Table 7Market by Design, 2025 and 2035
- Table 8Market by Installation, 2025 and 2035
- Table 9Manifold Type × Data Center Type Matrix, 2025
- Table 10Market by Region, 2025 and 2035
- Table 11Top 12 Countries, 2025 and 2035
- Table 12Forecast Scenarios, 2035
- Table 13Mergers and Acquisitions, 2024-2026
- Table 14Company Profiles: Products and Data Center Focus
About this report
Written by Satyabrat Rajawat and reviewed by Deepti Agrawal, Senior Editor, Research. Figures are built top-down and bottom-up and reconciled before publication, with 2025 as the base year.
Read our methodologyHow we built this
- Historical period2020-2024
- Base year2025
- Forecast period2026-2035
- Sizing approachTop-down + bottom-up
Need more than the report?
Advisory on this market
Due diligence, site selection and market entry work, by the analysts who wrote this report.
See consulting servicesFrequently asked questions
USD 935.61 million in 2025, rising to USD 3.79 billion by 2035, a CAGR of 15.01%. DC Market Insights estimates the market at USD 88.92 million in 2020.
A liquid cooling manifold splits and collects coolant between the CDU and the cold plates or tanks. In-rack manifolds lead with 49.3% of 2025 value, ahead of row-based manifolds at 31.6% and facility-level manifolds at 19.1%.
About USD 0.218 million per MW of liquid-cooled IT load in 2025, falling to USD 0.151 million by 2035, according to DC Market Insights estimates covering in-rack, row and facility manifolds.
Stainless steel, with 57.4% of 2025 value. Vertiv row manifolds use 304L stainless steel and nVent’s rack manifold uses extruded stainless steel; engineering plastics grow fastest at 18.86% a year.
No supplier holds more than 11%: DC Market Insights estimates the top five, including Vertiv, CoolIT and Schneider Electric (Motivair), held about 38% in 2025. Ecolab said in March 2026 that CoolIT was expected to generate about USD 550.00 million of sales over the next 12 months.
North America, with USD 432.25 million or 46.2% of 2025 value. Asia Pacific grows fastest at 17.15% a year.
USD 217.13 million in 2025, or 23.2% of the market, growing 7.85% a year as operators convert only the zones of air-cooled halls that host AI racks.
Two-phase direct-to-chip cooling, at 28.77% a year from USD 29.00 million in 2025. Single-phase direct-to-chip still leads with 78.4%.
Licences, delivery and payment
Which licence should I choose?
Single User is a view-only PDF for one person. Multi User adds a printable PDF and the Excel data for unlimited users at one location. Enterprise covers your whole company and includes 100 free analyst hours.
How and when will I receive the report?
By email, within 24–48 business hours of payment, in the formats of your licence.
How can I pay?
Securely through PayPal: with a PayPal account, a debit or credit card, or PayPal Pay Later where available. Prices are in US dollars.
Can I see a sample first?
Yes. Request a free sample and we will email it to you.
Can the report be tailored to my needs?
Yes. We can add countries, segments or data cuts. Talk to an analyst about the scope you need.
Can I get an invoice or pay against a purchase order?
Write to sales@dcmarketinsights.com and our team will help.