
Submarine Cable Systems Market Size, Share & Forecast to 2035
Market at a glance
The Submarine Cable Systems market was worth USD 5,700.0 million in 2025 and is forecast to reach USD 10.32 billion by 2035, growing at a 6.11% CAGR. Asia Pacific accounts for 33.4% of the market.
 By Amit Jain, Senior Consultant, ICT & Emerging Technologies
 Reviewed by Deepti Agrawal
Last updated 8 Oct 2026
Base year 2025 PDF + Excel
Reviewed by Deepti Agrawal
Last updated 8 Oct 2026
Base year 2025 PDF + Excel
Source: DC Market Insights analysis
Key findings
Cloud Providers Lift Their Spend to USD 5.41 Billion by 2035
Systems with 17 or More Fiber Pairs Grow at 15.84% a Year
About 200 Faults a Year Strain the Repair Fleet
India and the Global South Open New Routes
What is inside the report
- 01Introduction
- 02Research Methodology
- 03Executive Summary
- 04Market Dynamics
- 05Pricing Analysis
- 06Standards and Regulation
- 07Supply Chain Analysis
- 08Market Size and Forecast
- 09Market by Offering
- 10Market by System Type
- 21chapters
- 2020-2024Historical period
- 2026-2035Forecast period
- 15Companies profiled
Regional insights
- Asia Pacific33.4%
- North America23.9%
- Europe20.6%
- Middle East and Africa13.8%
- Latin America8.3%
Segmentation
Companies profiled
- SubCom
- Alcatel Submarine Networks (ASN)
- NEC
- HMN Technologies
- Hengtong Group
- Ciena
- Nokia
- Orange
- Global Marine Group
- OMS Group
- Meta
- Amazon Web Services
- Microsoft
- Southern Cross Cables
Recent developments
Meta announced Project Waterworth, a 24 fiber pair system of more than 50,000 km connecting the United States, India, Brazil, South Africa and other regions (Source: Meta engineering blog).
the AUG East consortium, whose members include Amazon Web Services and Microsoft, signed with NEC for an 8,900 km system between Singapore and Japan targeted for completion by the third quarter of 2029 (Source: W.Media news report).
Amazon announced Fastnet between Maryland and County Cork, its first solo private subsea cable, with more than 320 Tbps of capacity when operational in 2028 (Source: Data Center Dynamics news report).
OMS Group signed contracts with Ulstein for two SX252 cable-laying vessels with up to 6,500 tonnes of cable capacity each (Source: Data Center Dynamics news report).
the European Commission allocated EUR 347 million to strategic submarine cable projects and proposed a Cable Security Toolbox (Source: European Commission announcement).
Meta's plans for Petal, a cable between the United States and France using two-core fiber in a 24 fiber pair system, equivalent to 48 fiber pairs, were reported (Source: Data Center Dynamics news report).
Full analysis
The Submarine Cable Systems Market covers the fiber optic telecommunications cables laid on the seabed together with their repeaters, branching units, marine survey and installation, landing-station equipment, capacity upgrades and maintenance and repair services. DC Market Insights values the global Submarine Cable Systems Market at USD 5.70 billion in 2025 and forecasts USD 10.32 billion by 2035, a CAGR of 6.11%. The 2025 value is built from the build itself: about 118,400 km of new system work at roughly USD 31,500 per km gives USD 3.73 billion of new-system spend, upgrades on an installed base of about 1.70 million km add USD 936.70 million, and maintenance agreements plus about 175 repairs add USD 1.04 billion. Capacity upgrades are the fastest-growing offering at 8.07% a year because cloud traffic fills existing fiber pairs faster than new cables can be laid, and the Middle East and Africa is the fastest-growing region at 7.41% a year as new systems around Africa and through the Gulf add alternatives to routes exposed to Red Sea cuts.
Executive Summary
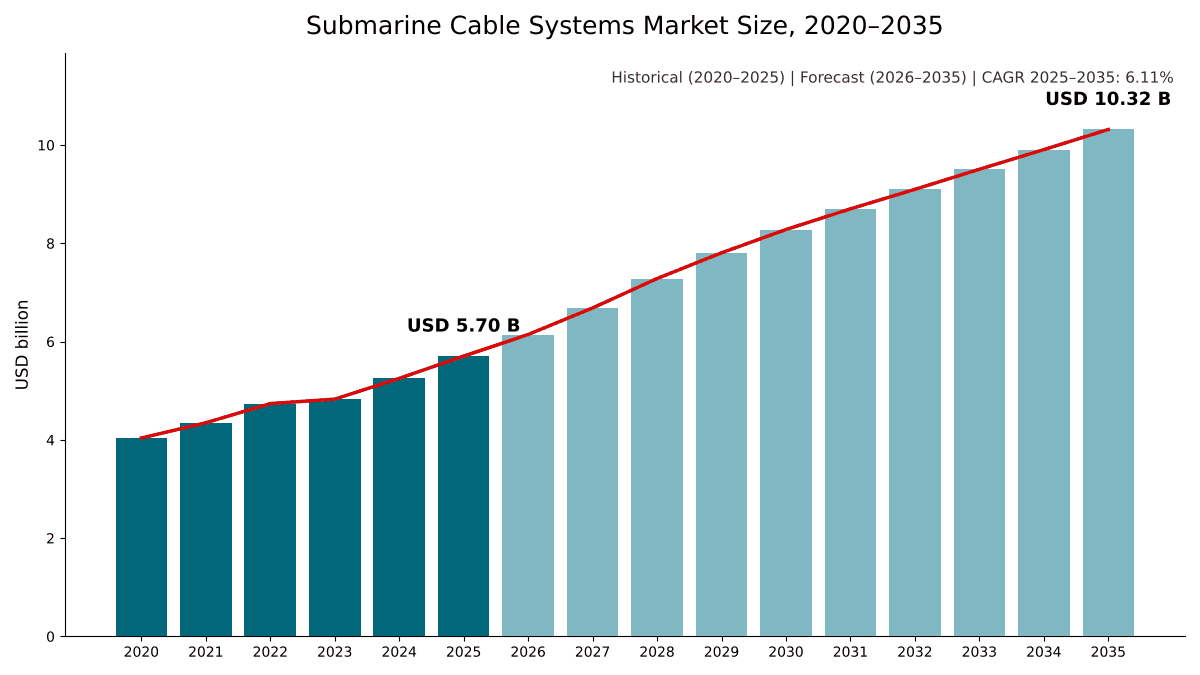
The Global Submarine Cable Systems Market size was valued at USD 4.04 billion in 2020, reached USD 5.70 billion in 2025, and is anticipated to reach USD 10.32 billion by 2035, at a CAGR of 6.11% during the forecast period.
| Report attribute | Details |
|---|---|
| Historical Period | 2020-2024 |
| Base Year | 2025 |
| Forecast Period | 2026-2035 |
| Submarine Cable Systems Market Size 2025 | USD 5.70 Billion |
| Submarine Cable Systems Market, CAGR | 6.11% |
| Submarine Cable Systems Market Size 2035 | USD 10.32 Billion |
The market grew at 7.16% a year between 2020 and 2025, and 2025 alone added 8.6% over 2024 as cloud and content providers moved from buying capacity on consortium cables to funding their own systems. Growth eases to 6.11% a year to 2035 because factories and cable ships, not demand, set the pace of new routes. DC Market Insights models new-system work rising from 118,400 km in 2025 to 176,000 km in 2035, lifting the installed base to about 2.61 million km.
Market Scope: What Does the Submarine Cable Systems Market Cover?
The Submarine Cable Systems Market covers spending on fiber optic telecommunications systems that cross seas and oceans, valued at first sale in current US dollars, with 2025 as the base year and forecasts to 2035. DC Market Insights sizes it at USD 5.70 billion in 2025.
Included. Wet plant equipment (submarine cable, optical repeaters, branching units and equalizers), marine route survey, cable laying and burial, dry plant at the landing station (submarine line terminal equipment, power feed equipment and network management), capacity upgrades of the terminal equipment on systems already in service, and maintenance agreements, standby cable ships and individual repairs.
Excluded. Submarine power cables and interconnectors, which are covered in our Submarine Power Cable Market report; sales and leases of bandwidth or indefeasible rights of use on finished cables; terrestrial backhaul from the landing station to inland data centers; and construction of the landing-station building.
How the segments fit together. The offering split divides the full USD 5.70 billion into new-system supply (wet plant, marine work and dry plant), upgrades and maintenance. The system-type, owner and application splits re-cut the same total. The fiber-pair split covers only new-system supply, worth USD 3.73 billion in 2025.
Market Drivers: What Drives the Submarine Cable Systems Market?
Three drivers explain most of the growth in the Submarine Cable Systems Market: content and cloud providers that now fund whole systems, a 50% jump in fiber pairs per cable from 16 to 24, and a public push for resilience after a run of cable cuts that the International Telecommunication Union (ITU) puts at about 200 faults a year.
Cloud Providers Lift Their Spend to USD 5.41 Billion by 2035
Content and cloud providers spent USD 2.44 billion on submarine cable systems in 2025, 42.7% of the market, and DC Market Insights forecasts USD 5.41 billion by 2035, growing at 8.30% a year. The shift is visible in their own announcements. Meta says it has developed more than 20 subsea cables and describes Project Waterworth, a system of more than 50,000 km, as a multi-billion dollar, multi-year investment. In November 2025 Amazon Web Services announced Fastnet between Maryland and County Cork, its first solo private subsea cable, offering more than 320 Tbps when it starts operating in 2028. Ciena’s annual report notes that cloud providers are significant purchasers of capacity on service provider submarine and wireline networks. Subsea demand follows the inter-region traffic covered in our Data Center Interconnect Market report.
Fiber Pairs per Cable Rise from 16 to 24
Space-division multiplexing (SDM) adds fiber pairs instead of pushing more wavelengths through each pair. Google’s Dunant cable was the first long-haul subsea cable with a 12 fiber pair SDM design and 250 terabits per second (Tbps) of capacity, NEC qualified a 24 fiber pair system in 2021 that it called a 50% improvement on the 16 fiber pair systems then generally available, and Meta is building Waterworth as the longest 24 fiber pair cable project in the world. More fiber pairs raise cost per km: DC Market Insights models the average turnkey cost of new systems rising from USD 31,500 per km in 2025 to about USD 36,200 per km in 2035.
Resilience Policy Puts Public Money Behind New Routes
Governments now treat subsea cables as critical infrastructure. ITU states that more than 99% of international data traffic is carried by subsea cables. The European Commission presented its cable security action plan in February 2025 and in February 2026 allocated EUR 347 million to strategic submarine cable projects, including a EUR 20 million call to enhance Europe’s repair capacity (Source: European Commission announcement). The Commission also reported EUR 420 million invested, as of October 2025, through the Connecting Europe Facility (CEF) Digital program in 51 Global Gateway projects. DC Market Insights counts government and development-bank owned systems at USD 633.10 million in 2025.
Market Trends: How Are Submarine Cable Systems Changing?
The Submarine Cable Systems Market is shifting toward high-fiber-count designs, more upgrade spending per km and renewed cable ship fleets.
Systems with 17 or More Fiber Pairs Grow at 15.84% a Year
New systems with 17 or more fiber pairs were worth USD 660.14 million in 2025, 17.7% of new-system supply, and DC Market Insights forecasts USD 2.87 billion by 2035, the fastest-growing fiber-pair class at 15.84% a year. Meta’s Petal cable goes further: it uses two-core fiber in a 24 fiber pair system, equivalent to 48 fiber pairs. Systems with up to 8 fiber pairs decline 3.71% a year.
Upgrades Take a Larger Share of Spend
Capacity upgrades, which replace the terminal equipment at each landing station without touching the wet plant, are worth USD 936.70 million in 2025 and reach USD 2.04 billion in 2035, growing at 8.07% a year against 5.59% for wet plant equipment. On 2Africa, for example, Meta reports 21 Tbps per fiber pair with 8 fiber pairs on the trunk of the West segment. DC Market Insights models upgrade spend at about USD 551 per km of installed cable in 2025, rising to about USD 780 per km by 2035.
Cable Ship Fleets Are Being Renewed
Marine capacity is now a strategic asset. In March 2025 Keppel announced that Keppel Infrastructure Fund had acquired Global Marine Group, which operates a fleet of six vessels. In November 2025 Orange said it would build two new subsea cable ships to replace part of its aging fleet, with delivery expected in 2028 and 2029. In January 2026 OMS Group signed contracts with Ulstein for two SX252 cable-laying vessels with a capacity of up to 6,500 tonnes of cable each.
Market Challenges: What Holds the Submarine Cable Systems Market Back?
Cable damage that outpaces repair capacity and geopolitical restrictions on suppliers and routes are the two constraints that DC Market Insights expects to slow the Submarine Cable Systems Market.
About 200 Faults a Year Strain the Repair Fleet
ITU reports around 200 faults on submarine cables each year, over 80% of them caused by fishing and anchoring, and the International Cable Protection Committee (ICPC) reported over 170 cable repairs worldwide in 2025. An ITU advisory body found that the average repair response time more than doubled between 2012 and 2024, from less than 20 days to more than 50 days, and that there is only one permanent and wholly dedicated cable repair vessel in the whole of Africa. In September 2025, failures on the SMW4 and IMEWE systems near Jeddah disrupted internet access across the Middle East and South Asia. Repairs typically cost millions of dollars and take 10 to 20 days depending on location, weather and depth. DC Market Insights models an average of about USD 2.41 million per repair in 2025.
Security Rules Narrow the Supplier and Route Choice
In August 2025 the US Federal Communications Commission (FCC) adopted rules that streamline submarine cable landing licenses but require that licensed systems not use equipment or services on the Commission’s Covered List, and that presume denial where an applicant seeks to land a cable in a foreign adversary country. Baltic Sea incidents, a fault on the C-Lion1 cable between Finland and Germany in November 2024 and damage to EstLink 2 and four other cables in December 2024, pushed European buyers toward route diversity. Suppliers face their own risks: NEC recorded JPY 34.0 billion of expenses in its fiscal year to March 2025 for quality issue resolution for submarine systems.
Market Opportunities: Where Are the New Revenue Pools?
The two largest new revenue pools in the Submarine Cable Systems Market are the 24 fiber pair systems that cloud providers are ordering, and maintenance and repair services, which grow to USD 1.91 billion by 2035.
India and the Global South Open New Routes
Waterworth will connect the United States, India, Brazil, South Africa and other regions. In February 2026 Google announced America-India Connect, which will establish a new international subsea gateway in Visakhapatnam (Vizag) and three new subsea paths connecting India to Singapore, South Africa and Australia. DC Market Insights forecasts India to be the fastest-growing country market at 9.69% a year, from USD 215.27 million in 2025 to USD 542.58 million in 2035. Inland, the same routes need long-haul fiber to reach data center clusters, a market covered in our Dark Fiber Market report.
Maintenance and Repair Grows to USD 1.91 Billion by 2035
Maintenance agreements and repairs are worth USD 1.04 billion in 2025, 18.2% of the market, and DC Market Insights forecasts USD 1.91 billion by 2035 at 6.30% a year. The European Union’s second CEF Digital call on cable repair capacity invests a further EUR 40 million and asks applicants to identify at least three vessels pre-configured for repair modules.
Pricing: How Much Does a Submarine Cable Cost per km?
A new submarine cable system costs about USD 31,500 per km on average in 2025, according to DC Market Insights estimates covering wet plant, marine work and initial landing-station equipment. Disclosed project values show a wide range, from about USD 20,000 per km on long trans-Pacific routes to more than USD 80,000 per km on an Arctic route.
| System | Disclosed value | Length (km) | Value per km |
|---|---|---|---|
| Hawaiki (Australia, New Zealand, US) | USD 300.00 million | 15,000 | USD 20,000 |
| Southern Cross NEXT | USD 350.00 million | 15,840 | USD 22,096 |
| Humboldt (Chile, Australia), estimate by Chilean officials | USD 300.00 million to USD 550.00 million | 14,000 | USD 21,429 to USD 39,286 |
| SEA-ME-WE 6, SubCom bid | About USD 600.00 million | 19,200 | USD 31,250 |
| East Micronesia Cable | USD 95.00 million | 2,250 | USD 42,222 |
| Medusa (Mediterranean) | EUR 342.00 million | 7,100 | EUR 48,169 |
| Far North Fiber (Arctic) | About USD 1.15 billion | 14,000 | USD 82,143 |
Cost per km falls with length and rises with landings, burial and fiber count. DC Market Insights models the average turnkey cost per km at USD 29,000 in 2020, USD 31,500 in 2025, USD 33,770 in 2030 and USD 36,200 in 2035, rising about 1.4% a year as fiber-pair counts grow.
Standards and Regulation: Which Rules Shape Submarine Cable Systems?
Three sets of rules shape submarine cable systems: ITU Telecommunication Standardization Sector (ITU-T) Recommendations, landing licenses and cable security frameworks.
ITU-T G.977 and G.977.1. G.977 sets the characteristics of optically amplified optical fibre submarine cable systems, and G.977.1 (10/20) covers transverse compatible dense wavelength division multiplexing applications for repeatered systems, the basis for buying terminal equipment from a supplier other than the wet plant supplier.
ITU-T G.654. The G.654 Recommendation, revised in August 2024, covers cut-off shifted single-mode optical fibre and cable, the low-loss fiber family used on long repeatered spans.
FCC Report and Order FCC 25-49. Adopted on August 7, 2025, the FCC submarine cable Report and Order streamlines and modernizes landing license rules while barring Covered List equipment from licensed systems.
European Union cable security framework. The February 2025 action plan prioritises funding for new and smart cables and aims to increase repair capacity. In February 2026 the Commission proposed a Cable Security Toolbox and a list of Cable Projects of European Interest (CPEIs), areas to be prioritised for public funding.
International resilience bodies. ITU and ICPC formed the International Advisory Body for Submarine Cable Resilience in November 2024. The second International Submarine Cable Resilience Summit, held in Porto in February 2026, brought together participants from more than 70 countries (Source: ITU press release).
Market Segmentation: Which Segment Leads the Submarine Cable Systems Market?
Wet plant equipment leads the Submarine Cable Systems Market with 37.9% of 2025 value, repeatered transoceanic systems lead system types with 51.6%, and telecom carriers and consortia remain the largest owner group with 46.2%. Among offerings, capacity upgrades are the fastest-growing segment at 8.07% a year, against 6.30% for maintenance and repair and 5.59% for wet plant, because every new generation of terminal optics adds capacity to cables already in service.
By Offering: Wet Plant Equipment Leads with 37.9%
| Offering | 2025 (USD billion) | Share 2025 | 2035 (USD billion) | CAGR 2025-2035 |
|---|---|---|---|---|
| Wet Plant Equipment | 2.16 | 37.9% | 3.73 | 5.59% |
| Marine Survey and Installation | 1.01 | 17.7% | 1.67 | 5.18% |
| Dry Plant and Landing Station Equipment | 0.56 | 9.8% | 0.97 | 5.71% |
| Capacity Upgrades | 0.94 | 16.4% | 2.04 | 8.07% |
| Maintenance and Repair | 1.04 | 18.2% | 1.91 | 6.30% |
New-system supply, the first three rows, is worth USD 3.73 billion in 2025, 65.4% of the market. Its share falls to 61.8% by 2035.
By System Type: Repeatered Transoceanic Systems Lead with 51.6%
| System type | 2025 (USD billion) | Share 2025 | 2035 (USD billion) | CAGR 2025-2035 |
|---|---|---|---|---|
| Repeatered Transoceanic Systems | 2.94 | 51.6% | 5.69 | 6.82% |
| Repeatered Regional Systems | 2.01 | 35.3% | 3.48 | 5.61% |
| Unrepeatered Systems | 0.75 | 13.1% | 1.15 | 4.36% |
Transoceanic systems gain share because the largest cloud-funded projects cross oceans; unrepeatered links to islands and coastal cities grow more slowly.
By Owner: Telecom Carriers and Consortia Lead with 46.2%
| Owner | 2025 (USD billion) | Share 2025 | 2035 (USD billion) | CAGR 2025-2035 |
|---|---|---|---|---|
| Telecom Carriers and Consortia | 2.64 | 46.2% | 3.91 | 4.03% |
| Content and Cloud Providers | 2.44 | 42.7% | 5.41 | 8.30% |
| Governments and Other Owners | 0.63 | 11.1% | 1.00 | 4.69% |
DC Market Insights forecasts content and cloud providers to overtake carriers before 2030 and to reach 52.4% of the market by 2035. The AUG East consortium that chose NEC for an 8,900 km Singapore to Japan system includes Amazon Web Services and Microsoft alongside carriers.
By Application: International Internet and Cloud Traffic Leads with 63.4%
International internet and cloud traffic accounts for USD 3.62 billion (63.4%) of 2025 spend and reaches USD 7.01 billion by 2035, growing at 6.84% a year. Domestic and island connectivity is worth USD 1.02 billion (17.8%), offshore energy platforms USD 581.77 million (10.2%), and enterprise, research and defense networks USD 490.51 million (8.6%), growing 6.35% a year.
By Fiber Pair Count: 9 to 16 Fiber Pairs Lead New Systems with 50.9%
New-system supply is worth USD 3.73 billion in 2025. Systems with 9 to 16 fiber pairs lead with USD 1.90 billion (50.9%), systems with up to 8 fiber pairs hold USD 1.17 billion (31.4%), and systems with 17 or more fiber pairs hold USD 660.14 million (17.7%). DC Market Insights forecasts the 17-plus class to reach 45.1% of new-system value in 2035.
| Fiber pair count (new systems) | 2025 (USD billion) | Share 2025 | 2035 (USD billion) | CAGR 2025-2035 |
|---|---|---|---|---|
| Up to 8 Fiber Pairs | 1.17 | 31.4% | 0.80 | -3.71% |
| 9 to 16 Fiber Pairs | 1.90 | 50.9% | 2.69 | 3.57% |
| 17 Fiber Pairs and Above | 0.66 | 17.7% | 2.87 | 15.84% |
DC Exclusive: The Cost per km Model and Owner × System Type Matrix
At USD 1.69 billion in 2025, transoceanic systems funded by content and cloud providers are the single largest cell of the matrix and 29.6% of all submarine cable system spending. The matrix is a DC Market Insights model, not a contract count: it is built from 16 annual cohorts of new-system km (2020 to 2035) priced with a turnkey cost per km, an installed-base model for upgrades and maintenance, and owner and system-type splits. In all, the model is built from 59 inputs: 16 km cohorts, 16 cost-per-km values, an installed base, a retirement rate, 3 upgrade and maintenance rate curves, a repair count and repair cost, 6 owner and system-type shares, 5 regional splits, 7 disclosed project costs and 2 supplier disclosures used as cross-checks.
| 2025, USD billion | Transoceanic | Regional | Unrepeatered | Total |
|---|---|---|---|---|
| Telecom Carriers and Consortia | 1.12 | 1.06 | 0.46 | 2.64 |
| Content and Cloud Providers | 1.69 | 0.67 | 0.07 | 2.44 |
| Governments and Other Owners | 0.14 | 0.28 | 0.21 | 0.63 |
| Total | 2.94 | 2.01 | 0.75 | 5.70 |
Content and cloud providers put 69% of their submarine spend into transoceanic systems, while carriers split theirs almost evenly between transoceanic and regional routes. Governments and other owners spend a third of their budget on unrepeatered links to islands and coastal regions; a supplier strong in unrepeatered systems is selling mainly to carriers and the public sector. Multiplying new-system km (118,400 km in 2025) by the average cost per km (USD 31,500) gives new-system spend; adding upgrade and maintenance spend on the installed base gives the market. The model and its assumptions are explained on our research methodology page.
Regional Insights: Which Region Leads the Submarine Cable Systems Market?
Asia Pacific leads the Submarine Cable Systems Market with 33.4% of 2025 value, and the Middle East and Africa is the fastest-growing region at 7.41% a year, because new routes around Africa and through the Gulf add diversity to a corridor exposed to cable cuts in the Red Sea. Regional values allocate each system’s spending to the landing countries of its owners and route.
Asia Pacific Leads with 33.4% Share
Asia Pacific spent USD 1.91 billion on submarine cable systems in 2025 and is forecast to reach USD 3.57 billion in 2035, a CAGR of 6.48%. Intra-Asian routes such as AUG East, targeted for completion by the third quarter of 2029, and new paths into India drive most of the growth.
North America Holds 23.9% Share
North America is worth USD 1.36 billion in 2025 and USD 2.24 billion by 2035, a CAGR of 5.09%. Cloud providers based in the United States fund most new transatlantic and transpacific systems, including Fastnet and Google’s Sol cable, which links Palm Coast in Florida with Bermuda, the Azores and Spain. North America loses 2.2 points of share by 2035 as more spending lands at the far end of each route.
Europe Holds 20.6% Share
Europe is worth USD 1.17 billion in 2025 and USD 1.98 billion by 2035, a CAGR of 5.36%. Public funding through CEF Digital and repair-capacity calls supports Europe’s share.
Middle East and Africa Holds 13.8% Share
The Middle East and Africa is worth USD 787.10 million in 2025 and USD 1.61 billion by 2035, the fastest regional growth at 7.41% a year. In November 2025 Meta announced completion of the core of 2Africa, a 45,000 km open access system; follow-on branches, Gulf routes and repair capacity drive further spend.
Latin America Holds 8.3% Share
Latin America is worth USD 473.40 million in 2025 and USD 918.19 million by 2035, a CAGR of 6.85%, led by Brazil and by Chile’s Humboldt route to Australia.
Country Analysis: Which Countries Spend the Most on Submarine Cable Systems?
The United States is the largest country market for submarine cable systems at USD 1.17 billion in 2025, 20.6% of global value, followed by China at USD 407.67 million (7.1%) and Japan at USD 306.71 million (5.4%). The 12 largest countries account for 61.8% of 2025 spending.
| Rank | Country | Region | 2025 (USD billion) | Share 2025 | 2035 (USD billion) | CAGR 2025-2035 |
|---|---|---|---|---|---|---|
| 1 | United States | North America | 1.17 | 20.6% | 1.91 | 4.98% |
| 2 | China | Asia Pacific | 0.41 | 7.1% | 0.67 | 5.11% |
| 3 | Japan | Asia Pacific | 0.31 | 5.4% | 0.54 | 5.73% |
| 4 | Singapore | Asia Pacific | 0.26 | 4.6% | 0.47 | 5.93% |
| 5 | United Kingdom | Europe | 0.24 | 4.2% | 0.38 | 4.67% |
| 6 | France | Europe | 0.22 | 3.9% | 0.36 | 5.02% |
| 7 | India | Asia Pacific | 0.22 | 3.8% | 0.54 | 9.69% |
| 8 | Brazil | Latin America | 0.21 | 3.8% | 0.43 | 7.22% |
| 9 | Saudi Arabia | Middle East and Africa | 0.14 | 2.4% | 0.29 | 7.96% |
| 10 | Australia | Asia Pacific | 0.14 | 2.4% | 0.26 | 6.63% |
| 11 | Indonesia | Asia Pacific | 0.12 | 2.1% | 0.25 | 7.59% |
| 12 | Portugal | Europe | 0.10 | 1.7% | 0.18 | 6.83% |
India is the fastest-growing large country market at 9.69% a year, ahead of Saudi Arabia at 7.96% and Indonesia at 7.59%, as new gateways reduce dependence on a few landing hubs. The country figures are a DC Market Insights allocation of the regional totals, weighted by each country’s estimated share of landing points and owner spending on systems in service and under construction.
Forecast Scenarios: How Could the 2035 Forecast Change?
The Submarine Cable Systems Market reaches USD 10.32 billion by 2035 in the base case, with a range of USD 8.69 billion to USD 11.90 billion across the low and high scenarios.
| Scenario | Assumption from 2026 | 2035 (USD billion) | CAGR 2025-2035 |
|---|---|---|---|
| Low | New-system km about 20% below base by 2035; slower upgrade cycle | 8.69 | 4.30% |
| Base | New-system work rises to 176,000 km a year; cost per km rises 1.4% a year | 10.32 | 6.11% |
| High | New-system km about 20% above base by 2035 as announced cloud programs proceed; repair fleet expands faster | 11.90 | 7.63% |
The low case reflects a pause in cloud capital spending; the high case assumes factory and ship capacity keep pace with announced programs. Multicore fiber is the main technical swing factor: it raises capacity per cable faster than cost, which can lower the number of new systems needed per Tbps.
Competitive Insights: Who Leads the Submarine Cable Systems Market?
- SubCom
- Alcatel Submarine Networks (ASN)
- NEC
- HMN Technologies
- Hengtong Group
- Ciena
- Nokia
- Orange
- Global Marine Group
- OMS Group
- Meta
- Amazon Web Services
- Microsoft
- Southern Cross Cables
Three system suppliers, SubCom, Alcatel Submarine Networks and NEC, together supply about 70% of new-system value in 2025 (DC Market Insights estimate, based on disclosed contract awards and factory capacity). Alcatel Submarine Networks reported net sales of EUR 1.06 billion in 2024 within Nokia’s accounts, which at an assumed USD 1.08 per euro is about 21.8% of the 2024 market, and has more than 750,000 km of optical submarine cable deployed worldwide. The French State completed its acquisition of ASN from Nokia on 31 December 2024. SubCom’s plant in Newington, New Hampshire, produces 58,000 km of cable a year, and in April 2026 Cerberus closed a continuation vehicle for SubCom with approximately USD 2.30 billion in commitments. NEC supplies the AUG East system, and Hengtong reports that it is the first enterprise in China to complete the laying of 40,000 km of submarine optical cables. Ciena and Nokia compete for terminal equipment and upgrades; Orange, Global Marine Group and OMS Group operate installation and repair ships; and Southern Cross Cables ordered SX Tasman Express, a 16 fiber pair system between Sydney and Auckland supplied by ASN with marine installation by OMS Group.
Recent Developments
- In February 2025, Meta announced Project Waterworth, a 24 fiber pair system of more than 50,000 km connecting the United States, India, Brazil, South Africa and other regions (Source: Meta engineering blog).
- In July 2025, the AUG East consortium, whose members include Amazon Web Services and Microsoft, signed with NEC for an 8,900 km system between Singapore and Japan targeted for completion by the third quarter of 2029 (Source: W.Media news report).
- In November 2025, Amazon announced Fastnet between Maryland and County Cork, its first solo private subsea cable, with more than 320 Tbps of capacity when operational in 2028 (Source: Data Center Dynamics news report).
- In January 2026, OMS Group signed contracts with Ulstein for two SX252 cable-laying vessels with up to 6,500 tonnes of cable capacity each (Source: Data Center Dynamics news report).
- In February 2026, the European Commission allocated EUR 347 million to strategic submarine cable projects and proposed a Cable Security Toolbox (Source: European Commission announcement).
- In September 2026, Meta’s plans for Petal, a cable between the United States and France using two-core fiber in a 24 fiber pair system, equivalent to 48 fiber pairs, were reported (Source: Data Center Dynamics news report).
We follow these contracts, cable launches and repair-capacity programs as they happen in our data center industry updates.
Methodology: How We Built the Submarine Cable Systems Market Model
DC Market Insights built this market bottom-up from 16 annual cohorts of new-system km (2020 to 2035), each priced with a turnkey cost per km that starts at USD 29,000 in 2020 and reaches USD 36,200 in 2035. The 2025 cost of USD 31,500 per km sits inside the range of 7 disclosed project values, from about USD 20,000 to about USD 82,000 per km. Upgrade spending was added on an installed base of 1.70 million km in 2025, in line with the more than 1.7 million km that ITU reports for about 500 cables, at about USD 551 per km; maintenance was added at about USD 362 per km plus 175 repairs at about USD 2.41 million each, in line with the more than 170 repairs that ICPC reported for 2025. The base retires 3.2% a year. Every split sums to the market total; the fiber-pair split divides new-system supply only. The result was checked against 2 bounds: ASN’s 2024 net sales of EUR 1.06 billion equal about 21.8% of the modeled 2024 market, consistent with one of three leading suppliers, and SubCom’s 58,000 km a year of cable output equals about 49% of the modeled 2025 km, consistent with its position as one of the largest suppliers. The analyst named on this page built the model, and the reviewer checked the arithmetic, the sources and the dates before publication.
Table of contents
- 01Introduction
- 1.1Market Definition and Scope
- 1.2Research Objectives
- 1.3Currency, Units and Assumptions
- 1.4Stakeholders
- 02Research Methodology
- 2.1Bottom-Up Cost per km Model
- 2.2Installed Base, Upgrade and Maintenance Model
- 2.3Top-Down Supplier Cross-Checks
- 2.4Data Sources and Validation
- 03Executive Summary
- 3.1Market Snapshot, 2025 and 2035
- 3.2Key Findings
- 3.3Analyst Viewpoint
- 04Market Dynamics
- 4.1Market Drivers
- 4.2Market Trends
- 4.3Market Challenges
- 4.4Market Opportunities
- 05Pricing Analysis
- 5.1Disclosed Project Values per km
- 5.2Turnkey Cost per km, 2020 to 2035
- 5.3Repair Cost and Duration
- 06Standards and Regulation
- 6.1ITU-T G.977 and G.977.1
- 6.2ITU-T G.654 Fiber
- 6.3FCC Submarine Cable Licensing Rules
- 6.4European Union Cable Security Framework
- 6.5International Cable Resilience Bodies
- 07Supply Chain Analysis
- 7.1Cable and Repeater Manufacturing
- 7.2Marine Survey, Installation and Cable Ships
- 7.3Terminal Equipment and Upgrades
- 7.4Maintenance Agreements and Repair
- 08Market Size and Forecast
- 8.1Market Size, 2020 to 2035
- 8.2New-System km and Installed Base
- 8.3Year-on-Year Growth
- 09Market by Offering
- 9.1Wet Plant Equipment
- 9.2Marine Survey and Installation
- 9.3Dry Plant and Landing Station Equipment
- 9.4Capacity Upgrades
- 9.5Maintenance and Repair
- 10Market by System Type
- 10.1Repeatered Transoceanic Systems
- 10.2Repeatered Regional Systems
- 10.3Unrepeatered Systems
- 11Market by Fiber Pair Count
- 11.1Up to 8 Fiber Pairs
- 11.29 to 16 Fiber Pairs
- 11.317 Fiber Pairs and Above
- 12Market by Owner
- 12.1Telecom Carriers and Consortia
- 12.2Content and Cloud Providers
- 12.3Governments and Other Owners
- 13Market by Application
- 13.1International Internet and Cloud Traffic
- 13.2Domestic and Island Connectivity
- 13.3Enterprise, Research and Defense Networks
- 13.4Offshore Energy Platforms
- 14DC Exclusive: Cost per km Model and Owner × System Type Matrix
- 14.1Model Structure and Inputs
- 14.2Owner × System Type Matrix, 2025
- 14.3Key Takeaways
- 15Market by Region
- 15.1North America (United States, Rest of North America)
- 15.2Europe (United Kingdom, France, Portugal, Rest of Europe)
- 15.3Asia Pacific (China, Japan, Singapore, India, Australia, Indonesia, Rest of Asia Pacific)
- 15.4Latin America (Brazil, Rest of Latin America)
- 15.5Middle East and Africa (Saudi Arabia, Rest of Middle East and Africa)
- 16Country Analysis
- 16.1Top 12 Countries, 2025 and 2035
- 16.2Fastest-Growing Countries
- 17Regional Cross-Sections
- 17.1Region by Offering, 2025 and 2035
- 17.2Region by Owner, 2025 and 2035
- 18Forecast Scenarios
- 18.1Low Scenario
- 18.2Base Scenario
- 18.3High Scenario
- 19Competitive Landscape
- 19.1Market Structure and Concentration
- 19.2Supplier Positioning
- 19.3Recent Developments
- 20Company Profiles
- 20.1SubCom
- 20.2Alcatel Submarine Networks (ASN)
- 20.3NEC
- 20.4HMN Technologies
- 20.5Hengtong Group
- 20.6Ciena
- 20.7Nokia
- 20.8Orange
- 20.9Global Marine Group
- 20.10OMS Group
- 20.11Meta
- 20.12Google
- 20.13Amazon Web Services
- 20.14Microsoft
- 20.15Southern Cross Cables
- 21Analyst Recommendations
- 21.1Recommendations for System Suppliers
- 21.2Recommendations for Cable Owners
- 21.3Recommendations for Investors
- Fig. 1Submarine Cable Systems Market Size, 2020–2035
- Fig. 2Submarine Cable Systems Market by Offering, 2025
- Fig. 3Submarine Cable Systems Market by Region, 2025 and 2035
- Fig. 4Turnkey Cost per km, 2020 to 2035
- Fig. 5Installed Base of Submarine Cable, 2020 to 2035
- Fig. 6Market Share by System Type, 2025 and 2035
- Fig. 7Market Share by Owner, 2025 and 2035
- Fig. 8Owner × System Type Matrix, 2025
- Fig. 9Top 12 Countries, 2025
- Fig. 10Forecast Scenarios, 2035
- Table 1Report Attributes
- Table 2Disclosed Project Values per km
- Table 3Market by Offering, 2025 and 2035
- Table 4Market by System Type, 2025 and 2035
- Table 5Market by Owner, 2025 and 2035
- Table 6Market by Application, 2025 and 2035
- Table 7Market by Fiber Pair Count, 2025 and 2035
- Table 8Owner × System Type Matrix, 2025
- Table 9Market by Region, 2025 and 2035
- Table 10Top 12 Countries, 2025 and 2035
- Table 11Forecast Scenarios, 2035
- Table 12Recent Developments
About this report
Written by Amit Jain and reviewed by Deepti Agrawal, Senior Editor, Research. Figures are built top-down and bottom-up and reconciled before publication, with 2025 as the base year.
Read our methodologyHow we built this
- Historical period2020-2024
- Base year2025
- Forecast period2026-2035
- Sizing approachTop-down + bottom-up
Need more than the report?
Advisory on this market
Due diligence, site selection and market entry work, by the analysts who wrote this report.
See consulting servicesFrequently asked questions
USD 5.70 billion in 2025, rising to USD 10.32 billion by 2035. DC Market Insights estimates the market at USD 4.04 billion in 2020.
6.11% a year from 2025 to 2035. Growth was 7.16% a year between 2020 and 2025, as content and cloud providers began funding their own systems.
Wet plant equipment, with USD 2.16 billion or 37.9% of the market in 2025. Capacity upgrades are the fastest-growing offering at 8.07% a year.
About USD 31,500 per km on average in 2025, according to DC Market Insights estimates. Disclosed projects range from about USD 20,000 per km on long trans-Pacific routes to more than USD 80,000 per km on an Arctic route.
Asia Pacific, with USD 1.91 billion or 33.4% of 2025 value. The Middle East and Africa grows fastest at 7.41% a year.
SubCom, Alcatel Submarine Networks and NEC together supply about 70% of new-system value in 2025 (DC Market Insights estimate). HMN Technologies, Hengtong Group, Ciena, Nokia, Orange, Global Marine Group and OMS Group also compete, and Meta, Google, Amazon Web Services and Microsoft are major owners.
Telecom carriers and consortia, with USD 2.64 billion or 46.2% of 2025 spending. Content and cloud providers grow fastest at 8.30% a year and reach USD 5.41 billion by 2035.
USD 1.17 billion in the United States, or 20.6% of 2025 spending, followed by China at USD 407.67 million. India grows fastest among large country markets at 9.69% a year (DC Market Insights estimate).
Licences, delivery and payment
Which licence should I choose?
Single User is a view-only PDF for one person. Multi User adds a printable PDF and the Excel data for unlimited users at one location. Enterprise covers your whole company and includes 100 free analyst hours.
How and when will I receive the report?
By email, within 24–48 business hours of payment, in the formats of your licence.
How can I pay?
Securely through PayPal: with a PayPal account, a debit or credit card, or PayPal Pay Later where available. Prices are in US dollars.
Can I see a sample first?
Yes. Request a free sample and we will email it to you.
Can the report be tailored to my needs?
Yes. We can add countries, segments or data cuts. Talk to an analyst about the scope you need.
Can I get an invoice or pay against a purchase order?
Write to sales@dcmarketinsights.com and our team will help.