
Data Center Rack Power Distribution Unit Market Size, Share & Forecast to 2035
Market at a glance
The Data Center Rack Power Distribution Unit market was worth USD 4,210.0 million in 2025 and is forecast to reach USD 9,760.0 million by 2035, growing at a 8.78% CAGR. North America accounts for 41.86% of the market.
 By Amit Jain, Senior Consultant, ICT & Emerging Technologies
 Reviewed by Deepti Agrawal
Last updated 15 Oct 2026
Base year 2025 PDF + Excel
Reviewed by Deepti Agrawal
Last updated 15 Oct 2026
Base year 2025 PDF + Excel
Source: DC Market Insights analysis
Key findings
Data center electricity use doubles by 2030
800 VDC architectures for 1 MW racks
AI racks need fewer PDU dollars per MW
Units above 30 kW: the fastest-growing pool
What is inside the report
- 01Introduction
- 02Executive Summary
- 03Market Scope and Estimate Comparison
- 04Market Dynamics
- 05Pricing Analysis
- 06Standards and Regulation
- 07Market Segmentation
- 08DC Exclusive
- 09Regional Insights
- 10Country Analysis
- 13chapters
- 2020-2024Historical period
- 2026-2035Forecast period
- 16Companies profiled
Regional insights
- North America41.86%
- Asia Pacific29.67%
- Europe20.71%
- Middle East and Africa4.37%
- Latin America3.39%
Segmentation
Companies profiled
- Vertiv (Geist, PowerIT)
- Schneider Electric (APC NetShelter)
- Eaton (ePDU, Tripp Lite)
- Legrand (Raritan, Server Technology)
- nVent
- Panduit
- Hewlett Packard Enterprise
- Delta Electronics
- ABB
- Rittal
- Cyber Power Systems
- Chatsworth Products
- Enlogic
- Austin Hughes
- Hubbell
- Huawei
Recent developments
nVent agreed to acquire Maverick Power, a maker of data center power distribution, for USD 1.75 billion (Source: nVent press release).
Legrand reported EUR 2.4 billion of data center sales for 2025 and announced the acquisition of Kratos Industries (Source: Legrand annual results).
nVent showed next-generation intelligent PDUs at SC25 with a control platform shared with its CDUs (Source: nVent press release).
Nvidia named ABB, Eaton, Schneider Electric, Siemens and Vertiv among its 800 VDC power system partners (Source: Nvidia blog).
Eaton unveiled an 800 VDC reference architecture for AI data centers (Source: Eaton press release).
Vertiv expanded its PowerIT rack PDU range to ratings of up to 57.6 kW (Source: Vertiv press release).
Full analysis
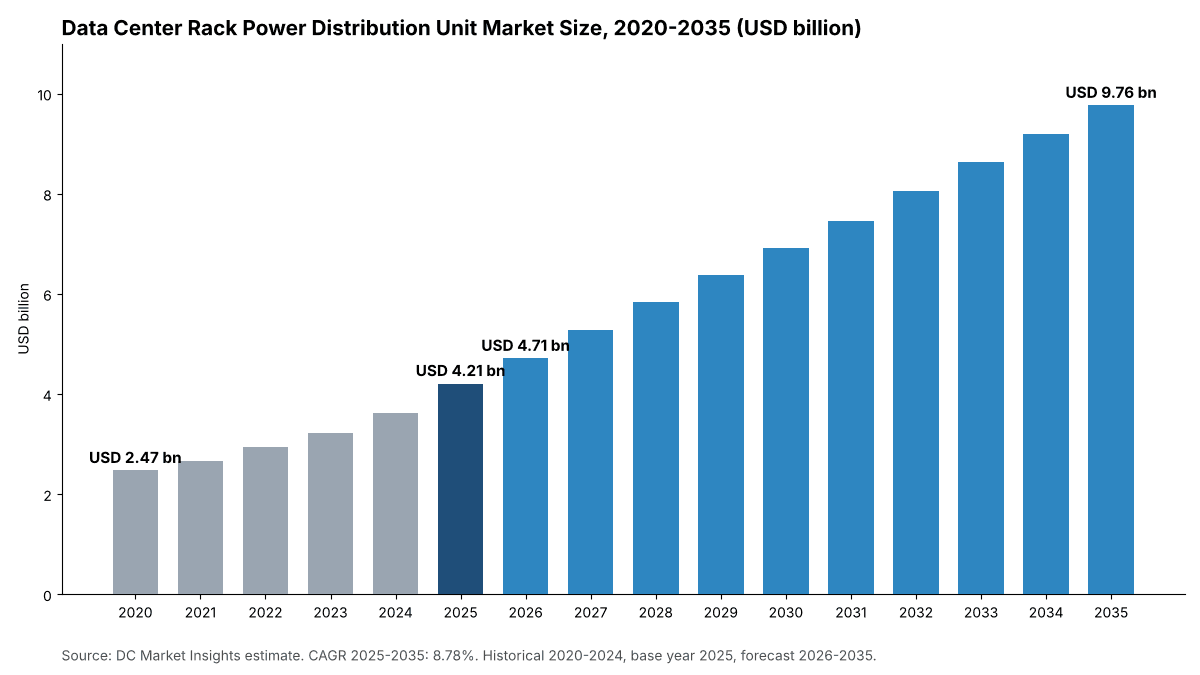
The Data Center Rack Power Distribution Unit Market is valued at USD 4.71 billion in 2026 and is projected to reach USD 9.76 billion by 2035, up from USD 4.21 billion in 2025, a CAGR of 8.78% from 2025 to 2035 (DC Market Insights estimate). The market covers the rack-mounted power distribution units (PDUs) that take power from a branch circuit, busway tap or remote power panel and feed it to the servers, storage and network equipment in a data center rack: basic, metered, monitored and outlet-metered, and switched units in single-phase and three-phase versions. The 2025 build receipt is 12,000 megawatts (MW) of new IT capacity, of which 7,800 MW of conventional halls x USD 0.205 million of rack PDUs per MW = USD 1.60 billion and 4,200 MW of artificial intelligence (AI) halls x USD 0.194 million per MW = USD 814.80 million, plus USD 1.80 billion of refresh and additions on the installed base. Units rated above 30 kilowatts (kW) are the fastest-growing segment at 15.75% a year because AI racks draw 60 kW to 132 kW, and the Middle East and Africa is the fastest-growing region at 10.62% a year as Gulf AI campuses are built. Rack PDUs are the last link of the power chain sized in the Data Center Power Market report.
Key Market Statistics: How Big Is the Data Center Rack Power Distribution Unit Market in 2026?
DC Market Insights values the Data Center Rack Power Distribution Unit Market at USD 4.71 billion in 2026, 11.94% above the USD 4.21 billion of 2025, as new IT capacity and the share of high-density AI racks both rise.
- Market size 2025: USD 4.21 billion
- Market size 2026: USD 4.71 billion
- Market size 2030: USD 6.91 billion
- Market size 2035: USD 9.76 billion
- CAGR 2025-2035: 8.78% (low case 7.63%, high case 9.80%)
- Largest product type: Switched PDUs, 34.03% of 2025 revenue (USD 1.43 billion)
- Fastest segment: units rated Above 30 kW, 15.75% a year (USD 606.70 million in 2025 to USD 2.62 billion by 2035)
- Fastest product type: Monitored and Outlet-Metered PDUs, 10.44% a year
- Fastest buyer type: Edge data centers, 10.64% a year, just ahead of Hyperscale at 9.77%
- Leading region: North America, 41.86% of 2025 revenue; fastest-growing region: Middle East and Africa, 10.62%
- Largest country: United States, USD 1.60 billion in 2025
- Market leader: Vertiv, about 17% of 2025 revenue (DC Market Insights assessment)
Executive Summary: How Large Was the Data Center Rack Power Distribution Unit Market in 2025?
Data center operators spent USD 4.21 billion on rack PDUs in 2025. The Global Data Center Rack Power Distribution Unit Market size was valued at USD 2.47 billion in 2020, reached USD 4.21 billion in 2025, and is anticipated to reach USD 9.76 billion by 2035, at a CAGR of 8.78% during the forecast period. Between 2020 and 2025 the market grew 11.23% a year as new IT capacity rose from 6,200 MW to 12,000 MW a year and AI halls moved buyers to three-phase, high-current units.
| Report attribute | Details |
|---|---|
| Historical Period | 2020-2024 |
| Base Year | 2025 |
| Forecast Period | 2026-2035 |
| Data Center Rack Power Distribution Unit Market Size 2025 | USD 4.21 billion |
| Data Center Rack Power Distribution Unit Market Size 2026 | USD 4.71 billion |
| Data Center Rack Power Distribution Unit Market CAGR (2025-2035) | 8.78% |
| Data Center Rack Power Distribution Unit Market Size 2035 | USD 9.76 billion |
Growth after 2025 is slower than the 2020-2025 pace for one reason: content per MW falls. A conventional rack of about 9 kW needs two PDUs worth about USD 1,840 together, while an AI rack averaging 60 kW in 2025 needs about three high-current units worth about USD 11,600, so each AI MW carries fewer PDU dollars than a conventional MW. New IT capacity still climbs from 12,000 MW in 2025 to 27,000 MW in 2035, and the installed base grows from 116,000 MW to 314,368 MW, so refresh and additions become the largest source of demand at USD 5.45 billion by 2035. Global investment in data centers is expected to reach USD 580 billion in 2025 (Source: IEA World Energy Outlook 2025).
Key takeaways:
- USD 4.21 billion in 2025, USD 4.71 billion in 2026 and USD 9.76 billion by 2035, an 8.78% CAGR.
- Switched PDUs are the largest product type at 34.03% because hyperscale and colocation operators want remote outlet control.
- Three-phase units already take 57.40% of revenue and reach 67.89% by 2035.
- North America takes 41.86% of 2025 revenue; the Middle East and Africa grows fastest at 10.62%.
- Rack power is moving to higher voltage: Nvidia plans 800 volts direct current (VDC) for 1 MW racks from 2027, which shifts part of the AI rack budget from AC rack PDUs to busbars and sidecar power racks (Source: Nvidia, May 2025).
Market Scope: What Does the Data Center Rack Power Distribution Unit Market Cover?
The Data Center Rack Power Distribution Unit Market is the annual factory revenue from rack-mounted PDUs sold for data centers worldwide, USD 4.21 billion in 2025 across about 116,000 MW of installed IT capacity (DC Market Insights estimate).
Included. Basic PDUs (power strips with circuit protection), metered PDUs (inlet current display and network reading), monitored and outlet-metered PDUs (per-outlet energy data), switched PDUs (remote on, off and reboot per outlet, often with outlet metering), single-phase and three-phase units, vertical (0U) and horizontal (1U and 2U) formats, high-current units of 30 kW and above for AI racks, and the environmental sensors, network cards and firmware sold with the PDU.
Excluded. Floor-standing power distribution units and remote power panels, busway and tap boxes, uninterruptible power supply (UPS) systems, Open Rack power shelves and the power supply units inside servers, rack frames, cables sold separately, and installation labor.
How the segments fit together. Every split in this report sums to the same total: four product types, two phases, three power ratings, four data center types, three demand sources and five regions. In 2025 Switched PDUs are USD 1.43 billion, Metered PDUs USD 1.10 billion, Monitored and Outlet-Metered PDUs USD 896.87 million and Basic PDUs USD 779.32 million. Busway, which feeds rows of PDUs from above, is sized separately in the Data Center Busway Market report.
Why Do Data Center Rack Power Distribution Unit Market Estimates Differ?
DC Market Insights values the Data Center Rack Power Distribution Unit Market at USD 4.71 billion in 2026, and published estimates differ mainly because some count every kind of PDU while this report counts only rack-mounted units sold into data centers.
| Element | In this report | Why |
|---|---|---|
| Rack PDUs in new halls | Yes, USD 2.41 billion (2025) | New IT MW x PDU content per MW |
| Refresh and additions on installed racks | Yes, USD 1.80 billion (2025) | Replacement every 8 to 10 years and rack moves |
| Floor PDUs and remote power panels | No | Room-level distribution, part of the Data Center Power Market |
| Open Rack power shelves and server power supplies | No | Conversion equipment, not distribution |
| PDUs for telecom closets, labs and offices | No | Not data center demand |
Market Drivers: What Drives the Data Center Rack Power Distribution Unit Market?
Three drivers lift the Data Center Rack Power Distribution Unit Market from USD 4.21 billion in 2025 to USD 9.76 billion by 2035: more new IT capacity each year, higher rack power density and a fast-growing installed base that needs refresh.
Data center electricity use doubles by 2030
Data centers used about 415 terawatt-hours (TWh) of electricity in 2024, around 1.5% of world consumption, and the International Energy Agency (IEA) expects that to more than double to about 945 TWh by 2030 (Source: IEA Energy and AI, April 2025). In the United States, data center use rose from 58 TWh in 2014 to 176 TWh in 2023 and could reach 325 to 580 TWh by 2028 (Source: US Department of Energy, December 2024). DC Market Insights turns this into new IT capacity of 12,000 MW in 2025, 19,400 MW in 2030 and 27,000 MW in 2035. Every new MW of 9 kW conventional racks needs about 111 racks and 222 rack PDUs, so new-build demand alone is USD 2.41 billion in 2025.
Rack density moves PDUs to three-phase and higher current
The average modal rack density in the Uptime Institute 2025 survey reached almost 9 kW, up from 8.3 kW the year before, while more than 80% of operators still had no racks above 30 kW (Source: Uptime Institute, July 2025). AI racks are far denser: an Nvidia GB200 NVL72 rack has a nominal design power of 132 kW (Source: Hewlett Packard Enterprise, September 2026). Vertiv expanded its PowerIT rack PDUs to ratings of up to 57.6 kW in September 2025 for AI and high-performance computing (HPC) racks (Source: Vertiv press release). DC Market Insights expects three-phase units to rise from 57.40% of revenue in 2025 to 67.89% by 2035, and units rated Above 30 kW to grow 15.75% a year.
An installed base of 116,000 MW that needs refresh
Installed IT capacity rises from about 116,000 MW in 2025 to 207,091 MW in 2030 and 314,368 MW in 2035 (DC Market Insights Capacity model). Rack PDUs are replaced every 8 to 10 years, when racks are re-cabled for new servers, or when operators upgrade from basic to metered units to meet energy reporting rules. DC Market Insights puts refresh and additions at USD 17,600 per installed MW a year in 2025, or USD 1.80 billion, growing at 11.74% a year to USD 5.45 billion by 2035.
Market Trends: How Is Rack Power Distribution Changing?
Three trends change what a rack PDU is: 800 VDC power for AI racks, intelligent PDUs that share a control platform with cooling, and bigger suppliers built through acquisitions.
800 VDC architectures for 1 MW racks
Nvidia plans 800 VDC power distribution to support 1 MW IT racks starting in 2027, because a single 1 MW rack at 54 VDC would need up to 200 kilograms of copper busbar (Source: Nvidia technical blog, May 2025). Eaton unveiled an 800 VDC reference architecture in October 2025, with busbar distribution in the Open Rack Version 3 (ORV3) design (Source: Eaton press release, October 2025). DC Market Insights lowers AI PDU content from USD 0.194 million per MW in 2025 to USD 0.149 million by 2035 to reflect this shift, which is why New AI Racks grow 12.54% a year rather than at the pace of AI capacity.
Intelligent PDUs join the cooling control layer
nVent showed next-generation intelligent PDUs at the SC25 supercomputing conference in November 2025, sharing a common control platform with its new coolant distribution units (CDUs) (Source: nVent press release, November 2025). Schneider Electric updated its APC NetShelter Rack PDU Advanced range for the high-current needs of AI servers in June 2025 (Source: Schneider Electric press release, June 2025). Monitored and Outlet-Metered PDUs are the fastest-growing product type at 10.44% a year in DC Market Insights estimates.
Suppliers buy scale in data center power
nVent agreed in August 2026 to buy Maverick Power, a maker of engineered power distribution for data centers, for USD 1.75 billion, with about USD 700 million of expected 2026 revenue (Source: nVent press release, August 2026). Legrand added Avtron Power Solutions and Linkk Busway Systems in 2025 and announced Kratos Industries in February 2026 (Source: Legrand 2025 annual results). The top three suppliers hold about 47% of the market in DC Market Insights estimates.
Market Challenges: What Holds the Data Center Rack Power Distribution Unit Market Back?
Two challenges limit growth: falling PDU content per MW in AI halls, and the low price of basic units in the large enterprise and refresh market.
AI racks need fewer PDU dollars per MW
A 9 kW conventional rack carries about USD 205,000 of rack PDUs per MW, but a 60 kW AI rack carries about USD 194,000 per MW in 2025 and, as 800 VDC sidecars arrive, about USD 149,000 by 2035 (DC Market Insights estimate). New Conventional Racks spend stays almost flat, from USD 1.60 billion in 2025 to USD 1.66 billion by 2035, because the conventional share of new MW falls from 65% to 34%. If 800 VDC arrives faster than expected, the low case of USD 8.78 billion in 2035 applies.
Price pressure on basic units
A basic 1U 15-amp PDU sells for about USD 136 at a US reseller (Source: SHI listing, October 2026), so Basic PDUs grow only 5.79% a year and fall from 18.52% of revenue in 2025 to 14.02% by 2035. Enterprise data centers, where basic units are common, grow at 5.62% a year, the slowest buyer type.
Market Opportunities: Where Are the New Revenue Pools?
The two largest new revenue pools are high-current units for AI racks, USD 2.62 billion by 2035, and refresh of an installed base that nearly triples, USD 5.45 billion by 2035.
Units above 30 kW: the fastest-growing pool
Units rated Above 30 kW grow from USD 606.70 million in 2025 to USD 2.62 billion by 2035 (DC Market Insights estimate). Suppliers that can deliver 50 kW to 60 kW three-phase units with outlet metering, hot-swappable network cards and locking C19 outlets gain most. Rack and containment demand for the same halls is covered in the U.S. Data Center Racks Market report.
Refresh to metered and switched units
EU rules require operators of data centers with at least 500 kW of IT power to measure and report IT energy use every year (Source: Delegated Regulation (EU) 2024/1364), and a Commission act of September 2026 sets up an EU data center rating scheme with labels from August 2027 (Source: European Commission, September 2026). Operators that still run basic strips upgrade to metered or outlet-metered units at refresh, worth USD 5.45 billion a year by 2035 across all regions.
Pricing: How Much Do Rack PDUs Cost per MW?
Rack PDUs cost about USD 0.205 million per MW of conventional IT capacity and USD 0.194 million per MW of AI capacity in 2025 (DC Market Insights estimate), or about USD 920 per unit for a two-PDU conventional rack and USD 3,880 per unit for a three-PDU AI rack.
| Year | Conventional racks (USD million per MW) | AI racks (USD million per MW) | Refresh per installed MW a year (USD) |
|---|---|---|---|
| 2020 | 0.214 | 0.226 | 16,800 |
| 2025 | 0.205 | 0.194 | 17,600 |
| 2030 | 0.192 | 0.168 | 18,100 |
| 2035 | 0.181 | 0.149 | 18,600 |
Public price anchors:
- A Tripp Lite basic 120 volt (V), 1.8 kW, 13-outlet 1U PDU lists at USD 136 (Source: SHI reseller listing, October 2026).
- An APC NetShelter Switched Rack PDU APDU9941 (30 amp, 208 V, 24 outlets) lists at USD 2,025 (Source: B&H Photo listing, October 2026).
- A Server Technology PRO4X switched PDU, 415 V three-phase, 11.5 kW and 36 outlets, lists at USD 4,496 (Source: SHI reseller listing, October 2026).
The model’s unit values are labelled DC Market Insights estimates; content per MW falls slowly because rack density rises faster than the price of each unit.
Standards and Regulation: Which Rules Shape Rack PDUs?
Three sets of rules shape rack PDU design and demand: product safety standards, connector standards and EU energy reporting.
Product safety. UL 62368-1 replaced UL 60950-1 for information technology equipment, with a UL effective date of 20 December 2020 (Source: UL Solutions, November 2022). New rack PDU models are certified to UL 62368-1 or IEC 62368-1.
Connectors. Three-phase rack PDUs use International Electrotechnical Commission (IEC) 60309 inlets, as on the Server Technology PRO4X 415 V unit (Source: SHI reseller listing, October 2026), and C13 and C19 outlets under IEC 60320.
EU energy reporting. Commission Delegated Regulation (EU) 2024/1364 requires operators of data centers with at least 500 kW of installed IT power to report key performance indicators each year, including the measured energy use of IT equipment, by 15 May each year from 2025. Outlet-metered PDUs are one of the cheapest ways to produce those numbers.
Market Segmentation: Which Segment Leads the Data Center Rack Power Distribution Unit Market?
Switched PDUs lead the Data Center Rack Power Distribution Unit Market with 34.03% of 2025 revenue (USD 1.43 billion), and units rated Above 30 kW are the fastest-growing segment at 15.75% a year to 2035 (DC Market Insights estimate).
By Product Type: Switched PDUs Lead with 34.03%
Switched units cost two to three times a metered unit but let operators reboot a hung server without a site visit, which hyperscale and colocation operators value most.
| Product type | 2025 (USD million) | Share 2025 | 2035 (USD million) | CAGR 2025-2035 |
|---|---|---|---|---|
| Switched PDUs | 1,432.15 | 34.03% | 3,678.40 | 9.89% |
| Metered PDUs | 1,100.66 | 26.15% | 2,297.37 | 7.64% |
| Monitored and Outlet-Metered PDUs | 896.87 | 21.31% | 2,420.48 | 10.44% |
| Basic PDUs | 779.32 | 18.52% | 1,368.68 | 5.79% |
By Phase: Three-Phase Leads with 57.40%
Three-phase units deliver more power per cord, so nearly all AI racks and most new hyperscale racks use them.
| Phase | 2025 (USD million) | Share 2025 | 2035 (USD million) | CAGR 2025-2035 |
|---|---|---|---|---|
| Three-Phase | 2,415.95 | 57.40% | 6,629.42 | 10.62% |
| Single-Phase | 1,793.05 | 42.60% | 3,135.52 | 5.75% |
By Power Rating: Up to 10 kW Leads with 50.39%
Most installed racks still draw under 10 kW, but the Above 30 kW class gains share fastest.
| Power rating | 2025 (USD million) | Share 2025 | 2035 (USD million) | CAGR 2025-2035 |
|---|---|---|---|---|
| Up to 10 kW | 2,120.71 | 50.39% | 3,524.23 | 5.21% |
| 10-30 kW | 1,481.60 | 35.20% | 3,622.13 | 9.35% |
| Above 30 kW | 606.70 | 14.41% | 2,618.57 | 15.75% |
By Data Center Type: Colocation Leads with 35.75%
Colocation operators buy PDUs for every tenant cage and often specify metered units for billing; hyperscale buyers follow closely. Enterprise demand comes mainly from the IT & telecom sector, banking, financial services and insurance (BFSI) firms, government and healthcare, which run their own data centers and server rooms; BFSI buyers favor switched and outlet-metered units for audit trails.
| Data center type | 2025 (USD million) | Share 2025 | 2035 (USD million) | CAGR 2025-2035 |
|---|---|---|---|---|
| Colocation | 1,504.82 | 35.75% | 3,646.26 | 9.25% |
| Hyperscale | 1,438.94 | 34.19% | 3,655.10 | 9.77% |
| Enterprise | 993.39 | 23.60% | 1,716.11 | 5.62% |
| Edge | 271.84 | 6.46% | 747.46 | 10.64% |
By Demand Source: Replacement and Upgrades Lead with 42.65%
New AI Racks grow fastest, but refresh of the installed base is the largest and steadiest pool.
| Demand source | 2025 (USD million) | Share 2025 | 2035 (USD million) | CAGR 2025-2035 |
|---|---|---|---|---|
| Replacement and Upgrades | 1,795.20 | 42.65% | 5,448.17 | 11.74% |
| New Conventional Racks | 1,599.00 | 37.99% | 1,661.58 | 0.38% |
| New AI Racks | 814.80 | 19.36% | 2,655.18 | 12.54% |
DC Exclusive: The Rack PDU Content Model and Region x Product Type Matrix
The largest cell of the market is North America Switched PDUs, USD 644.28 million in 2025. This is a DC Market Insights model built from 14 inputs (new IT MW by year, installed MW, AI share of new MW, four content values per MW for each of conventional and AI racks, four refresh rates and rack density) and tested against 3 bound checks, listed under Methodology.
| Rack type (2025) | Rack power | PDUs per rack | Average price per PDU | Content per MW |
|---|---|---|---|---|
| Conventional rack | 9 kW | 2 (A and B feeds) | About USD 920 | USD 0.205 million |
| AI rack (mixed H100 and GB200 class) | 60 kW average | 3 | About USD 3,880 | USD 0.194 million |
| AI rack, GB200 NVL72 | 132 kW nominal | Feeds eight 33 kW power shelves | Project priced | Falls with 800 VDC |
The matrix below splits the 2025 market by region and product type; rows and columns sum to the totals above.
| Region (USD million, 2025) | Basic | Metered | Monitored and Outlet-Metered | Switched | Total |
|---|---|---|---|---|---|
| North America | 284.25 | 444.08 | 389.28 | 644.28 | 1,761.89 |
| Asia Pacific | 272.89 | 335.74 | 253.60 | 386.58 | 1,248.81 |
| Europe | 151.91 | 236.08 | 187.70 | 295.99 | 871.68 |
| Middle East and Africa | 37.23 | 47.59 | 37.74 | 61.37 | 183.93 |
| Latin America | 33.04 | 37.17 | 28.55 | 43.93 | 142.69 |
| Total | 779.32 | 1,100.66 | 896.87 | 1,432.15 | 4,209.00 |
Regional Insights: Which Region Leads the Data Center Rack Power Distribution Unit Market?
North America leads with 41.86% of 2025 revenue (USD 1.76 billion), and the Middle East and Africa is the fastest-growing region at 10.62% a year to USD 504.85 million by 2035 (DC Market Insights estimate).
| Region | 2025 (USD million) | Share 2025 | 2035 (USD million) | CAGR 2025-2035 |
|---|---|---|---|---|
| North America | 1,761.89 | 41.86% | 3,878.63 | 8.21% |
| Asia Pacific | 1,248.81 | 29.67% | 3,304.45 | 10.22% |
| Europe | 871.68 | 20.71% | 1,760.62 | 7.28% |
| Middle East and Africa | 183.93 | 4.37% | 504.85 | 10.62% |
| Latin America | 142.69 | 3.39% | 316.38 | 8.29% |
North America Leads with 41.86% Share
The United States alone is USD 1.60 billion in 2025, because US data center electricity use reached 176 TWh in 2023 (Source: US Department of Energy, December 2024) and most AI capacity is built there. Vertiv generated USD 6.39 billion of its USD 10.23 billion 2025 sales in the Americas (Source: Vertiv fourth-quarter 2025 results, February 2026). North America grows at 8.21% a year.
Asia Pacific Holds 29.67% Share
Asia Pacific grows at 10.22% a year to USD 3.30 billion by 2035, led by China, Japan and India; India is the fastest-growing large country at 14.47% a year as hyperscale campuses expand in Mumbai and Chennai (DC Market Insights estimate).
Europe Holds 20.71% Share
Europe grows at 7.28% a year, slower than the global market because grid limits in Frankfurt, London, Amsterdam and Dublin slow new builds, but EU energy reporting pushes refresh to metered units (Source: Delegated Regulation (EU) 2024/1364).
Middle East and Africa Holds 4.37% Share
The Middle East and Africa is the fastest-growing region at 10.62% a year because Saudi Arabia and the United Arab Emirates are building gigawatt-scale AI campuses; Saudi Arabia grows 13.91% a year in DC Market Insights estimates, and the Gulf Cooperation Council (GCC) countries together take most of the region’s 2025 spend; South Africa leads the rest of Africa.
Latin America Holds 3.39% Share
Latin America grows at 8.29% a year to USD 316.38 million by 2035, led by Brazil, Mexico and Chile, where colocation operators buy most units; Colombia, Argentina, Peru and the rest of South America make up the remaining demand (DC Market Insights estimate).
Country Analysis: Which Countries Spend the Most on Rack PDUs?
The United States leads with USD 1.60 billion in 2025, and India is the fastest-growing country in the top 12 at 14.47% a year (DC Market Insights estimate). The 12 countries below hold 77.15% of 2025 revenue.
| Rank | Country | Region | 2025 (USD million) | Share 2025 | 2035 (USD million) | CAGR |
|---|---|---|---|---|---|---|
| 1 | United States | North America | 1,596.47 | 37.93% | 3,477.29 | 8.10% |
| 2 | China | Asia Pacific | 510.97 | 12.14% | 1,276.28 | 9.59% |
| 3 | Japan | Asia Pacific | 184.35 | 4.38% | 418.92 | 8.55% |
| 4 | Germany | Europe | 175.52 | 4.17% | 343.73 | 6.95% |
| 5 | United Kingdom | Europe | 166.68 | 3.96% | 320.29 | 6.75% |
| 6 | India | Asia Pacific | 119.54 | 2.84% | 461.88 | 14.47% |
| 7 | Canada | North America | 109.85 | 2.61% | 272.44 | 9.51% |
| 8 | Australia | Asia Pacific | 99.75 | 2.37% | 245.10 | 9.41% |
| 9 | France | Europe | 92.18 | 2.19% | 181.63 | 7.02% |
| 10 | Ireland | Europe | 72.39 | 1.72% | 127.92 | 5.86% |
| 11 | Singapore | Asia Pacific | 69.87 | 1.66% | 138.66 | 7.09% |
| 12 | Saudi Arabia | Middle East and Africa | 49.67 | 1.18% | 182.60 | 13.91% |
Canada and France are the second-largest markets in their regions after the United States and Germany. The next five countries, just outside the top 12, are shown below; Spain and South Korea grow fastest of these because hyperscale campuses are being built around Madrid, Seoul and Busan, while Russia grows slowest because imports of Western equipment are restricted.
| Country | Region | 2025 (USD million) | 2035 (USD million) | CAGR |
|---|---|---|---|---|
| South Korea | Asia Pacific | 47.85 | 114.53 | 9.12% |
| Italy | Europe | 41.62 | 88.53 | 7.84% |
| Spain | Europe | 33.18 | 81.93 | 9.46% |
| Russia | Europe | 22.47 | 37.95 | 5.38% |
| Poland | Europe | 18.94 | 43.50 | 8.67% |
India moves from sixth place in 2025 to fourth by 2035, overtaking Germany and the United Kingdom, because its new capacity grows faster than any other large market.
Forecast Scenarios: How Could the 2035 Forecast Change?
The 2035 Data Center Rack Power Distribution Unit Market ranges from USD 8.78 billion to USD 10.72 billion around a base case of USD 9.76 billion, depending on how fast new capacity is built and how much AI rack power moves to 800 VDC.
| Scenario | Assumption from 2026 | 2035 value | CAGR 2025-2035 |
|---|---|---|---|
| Low | New capacity and AI share 15% below base (grid limits, faster 800 VDC) | USD 8.78 billion | 7.63% |
| Base | 27,000 MW of new IT in 2035; AI share 66% of new MW | USD 9.76 billion | 8.78% |
| High | New capacity and AI share 15% above base | USD 10.72 billion | 9.80% |
Competitive Insights: Who Leads the Data Center Rack Power Distribution Unit Market?
Vertiv leads with about 17% of 2025 revenue, and the three largest suppliers (Vertiv, Schneider Electric and Eaton) hold about 47% (DC Market Insights assessment).
- Vertiv (Geist, PowerIT)
- Schneider Electric (APC NetShelter)
- Eaton (ePDU, Tripp Lite)
- Legrand (Raritan, Server Technology)
- nVent
- Panduit
- Hewlett Packard Enterprise
- Delta Electronics
- ABB
- Rittal
- Cyber Power Systems
- Chatsworth Products
- Enlogic
- Austin Hughes
- Hubbell
- Huawei
Vertiv’s advantage is breadth and AI focus: its 2025 net sales were USD 10.23 billion with a USD 15.0 billion backlog (Source: Vertiv results, February 2026), and its PowerIT range reaches 57.6 kW per PDU. Schneider Electric’s revenue passed EUR 40 billion in 2025, and demand in its pure data center segment grew at triple digits in the fourth quarter (Source: Schneider Electric full-year 2025 results). Eaton reported record 2025 sales of USD 27.4 billion, with orders driven by data centers (Source: Eaton results, February 2026). Legrand’s data center business reached EUR 2.4 billion, 26% of group sales, in 2025 (Source: Legrand 2025 annual results).
Recent Developments
- In August 2026, nVent agreed to acquire Maverick Power, a maker of data center power distribution, for USD 1.75 billion (Source: nVent press release).
- In February 2026, Legrand reported EUR 2.4 billion of data center sales for 2025 and announced the acquisition of Kratos Industries (Source: Legrand annual results).
- In November 2025, nVent showed next-generation intelligent PDUs at SC25 with a control platform shared with its CDUs (Source: nVent press release).
- In October 2025, Nvidia named ABB, Eaton, Schneider Electric, Siemens and Vertiv among its 800 VDC power system partners (Source: Nvidia blog).
- In October 2025, Eaton unveiled an 800 VDC reference architecture for AI data centers (Source: Eaton press release).
- In September 2025, Vertiv expanded its PowerIT rack PDU range to ratings of up to 57.6 kW (Source: Vertiv press release).
More power and equipment reports are listed under DC Market Insights industry reports; feeder distribution above the rack is covered in the Data Center Busway Market report and rack frames in the U.S. Data Center Racks Market report.
Methodology: How We Built the Data Center Rack Power Distribution Unit Market Model
The model multiplies new IT capacity by rack PDU content per MW and adds refresh on the installed base. New IT capacity is 6,200 MW in 2020, 12,000 MW in 2025, 19,400 MW in 2030 and 27,000 MW in 2035; installed capacity is 70,500 MW in 2020, 116,000 MW in 2025, 207,091 MW in 2030 and 314,368 MW in 2035, in line with the DC Market Insights Capacity model. The AI share of new MW rises from 4% in 2020 and 35% in 2025 to 66% in 2035. Content per MW is USD 0.214 million (2020), 0.205 (2025), 0.192 (2030) and 0.181 (2035) for conventional racks and 0.226, 0.194, 0.168 and 0.149 for AI racks; refresh is USD 16,800 to USD 18,600 per installed MW a year. Segment shares are set separately for new conventional, new AI and refresh demand, so every split sums to the total.
Three bound checks:
- Ceiling 1: USD 4.21 billion is 0.73% of the USD 580 billion the world invests in data centers in 2025 (Source: IEA World Energy Outlook 2025).
- Ceiling 2: Legrand’s whole data center business, EUR 2.4 billion in 2025, is larger than its estimated rack PDU revenue of about USD 0.55 billion (13% of USD 4.21 billion), so the share is consistent with its total sales (Source: Legrand annual results).
- Floor: 866,667 new conventional racks in 2025 x 2 PDUs x USD 136 for the cheapest basic unit gives USD 235.73 million, below the model’s USD 1.60 billion for new conventional racks.
Full approach: DC Market Insights research methodology. The analyst named on this page built the model, and the reviewer checked the arithmetic, the sources and the dates before publication.
Table of contents
- 01Introduction
- 1.1Market Definition and Scope
- 1.2Research Methodology
- 1.3Key Market Statistics
- 02Executive Summary
- 2.1Market Size 2020-2035
- 2.2Key Takeaways
- 03Market Scope and Estimate Comparison
- 3.1Included and Excluded
- 3.2Why Estimates Differ
- 04Market Dynamics
- 4.1Market Drivers
- 4.2Market Trends
- 4.3Market Challenges
- 4.4Market Opportunities
- 05Pricing Analysis
- 5.1Rack PDU Content per MW, 2020-2035
- 5.2Public Price Anchors
- 06Standards and Regulation
- 6.1Product Safety
- 6.2Connectors
- 6.3EU Energy Reporting
- 07Market Segmentation
- 7.1By Product Type
- 7.2By Phase
- 7.3By Power Rating
- 7.4By Data Center Type
- 7.5By Demand Source
- 08DC Exclusive
- 8.1Rack PDU Content Model
- 8.2Region x Product Type Matrix
- 09Regional Insights
- 9.1North America
- 9.2Asia Pacific
- 9.3Europe
- 9.4Middle East and Africa
- 9.5Latin America
- 10Country Analysis
- 10.1Top 12 Countries
- 11Forecast Scenarios
- 11.1Low, Base and High Cases
- 12Competitive Landscape
- 12.1Company List
- 12.2Market Share and Advantages
- 13Recent Developments
- Fig. 1Data Center Rack Power Distribution Unit Market Size, 2020-2035
- Table 1Report Attributes
- Table 2Scope Comparison
- Table 3Rack PDU Content per MW
- Table 4Segment Tables
- Table 5Rack PDU Content Model
- Table 6Region x Product Type Matrix
- Table 7Regional Split
- Table 8Top 12 Countries
- Table 9Forecast Scenarios
About this report
Written by Amit Jain and reviewed by Deepti Agrawal, Senior Editor, Research. Figures are built top-down and bottom-up and reconciled before publication, with 2025 as the base year.
Read our methodologyHow we built this
- Historical period2020-2024
- Base year2025
- Forecast period2026-2035
- Sizing approachTop-down + bottom-up
Need more than the report?
Advisory on this market
Due diligence, site selection and market entry work, by the analysts who wrote this report.
See consulting servicesFrequently asked questions
USD 4.71 billion in 2026, up 11.94% from USD 4.21 billion in 2025, according to DC Market Insights estimates. The market is projected to reach USD 9.76 billion by 2035, a CAGR of 8.78% from 2025 to 2035.
USD 4.21 billion in 2025 and USD 9.76 billion by 2035 (DC Market Insights estimate), after USD 2.47 billion in 2020. The 2025 figure covers rack PDUs for 12,000 MW of new IT capacity plus refresh on the installed base.
8.78% a year from 2025 to 2035 (DC Market Insights estimate), slower than the 11.23% of 2020-2025 because AI racks carry fewer PDU dollars per MW as 800 VDC power arrives.
USD 4.21 billion of 2025 revenue from rack-mounted power distribution units sold for data centers: basic, metered, monitored and outlet-metered, and switched units in single-phase and three-phase versions. Floor PDUs, busway and power shelves are excluded.
Switched PDUs, with 34.03% of 2025 revenue (USD 1.43 billion), because hyperscale and colocation operators want remote outlet control (DC Market Insights estimate).
Units rated Above 30 kW, at 15.75% a year from USD 606.70 million in 2025 to USD 2.62 billion by 2035 (DC Market Insights estimate), as AI racks draw 60 kW to 132 kW.
From about USD 136 for a basic 1U unit to USD 2,025 for an APC switched 24-outlet unit and USD 4,496 for a 415 V three-phase switched unit at US resellers. DC Market Insights puts content at USD 0.205 million per conventional MW in 2025.
North America, with 41.86% of 2025 revenue (USD 1.76 billion). The Middle East and Africa is the fastest-growing region at 10.62% a year as Gulf AI campuses are built (DC Market Insights estimate).
Vertiv leads with about 17% of 2025 revenue, and Vertiv, Schneider Electric and Eaton together hold about 47% (DC Market Insights assessment). Legrand, nVent, Panduit and Hewlett Packard Enterprise follow.
Colocation, with 35.75% of 2025 revenue (USD 1.50 billion), just ahead of Hyperscale at 34.19%, because operators fit metered or switched units in every tenant rack (DC Market Insights estimate).
It lowers PDU content in AI halls from USD 0.194 million per MW in 2025 to USD 0.149 million by 2035 (DC Market Insights estimate). Nvidia plans 800 VDC for 1 MW racks from 2027, shifting spend to busbars and sidecar power racks.
Asia Pacific adds the most new revenue outside North America, USD 2.06 billion between 2025 and 2035 at 10.22% a year, while the Middle East and Africa grows fastest at 10.62%. North America stays the largest pool at USD 3.88 billion by 2035 (DC Market Insights estimate).
Licences, delivery and payment
Which licence should I choose?
Single User is a view-only PDF for one person. Multi User adds a printable PDF and the Excel data for unlimited users at one location. Enterprise covers your whole company and includes 100 free analyst hours.
How and when will I receive the report?
By email, within 24–48 business hours of payment, in the formats of your licence.
How can I pay?
Securely through PayPal: with a PayPal account, a debit or credit card, or PayPal Pay Later where available. Prices are in US dollars.
Can I see a sample first?
Yes. Request a free sample and we will email it to you.
Can the report be tailored to my needs?
Yes. We can add countries, segments or data cuts. Talk to an analyst about the scope you need.
Can I get an invoice or pay against a purchase order?
Write to sales@dcmarketinsights.com and our team will help.