
AI Rack Factory Acceptance Testing Services Market Size, Share & Forecast to 2035
Market at a glance
The AI Rack Factory Acceptance Testing Services market was worth USD 672.3 million in 2025 and is forecast to reach USD 3,620.0 million by 2035, growing at a 18.35% CAGR. North America accounts for 61.37% of the market.
 By Amit Jain, Senior Consultant, ICT & Emerging Technologies
 Reviewed by Deepti Agrawal
Last updated 15 Oct 2026
Base year 2025 PDF + Excel
Reviewed by Deepti Agrawal
Last updated 15 Oct 2026
Base year 2025 PDF + Excel
Source: DC Market Insights analysis
What is inside the report
- 01Introduction
- 02Executive Summary
- 03Market Dynamics
- 04Pricing and Test Value per MW
- 05Standards and Regulation
- 06Market Segmentation
- 07DC Exclusive: Rack Type x Region Matrix
- 08Regional Insights
- 09Country Analysis
- 10Forecast Scenarios
- 11chapters
- 2020-2024Historical period
- 2026-2035Forecast period
- 17Companies profiled
Regional insights
- North America61.37%
- Asia Pacific21.64%
- Europe9.73%
- Middle East and Africa5.19%
- Latin America2.07%
Segmentation
Companies profiled
- Foxconn (Hon Hai)
- Quanta Computer
- Wistron
- Wiwynn
- Inventec
- Dell Technologies
- Hewlett Packard Enterprise
- Supermicro
- Lenovo
- ASUS
- Gigabyte
- Celestica
- Sanmina
- Jabil
- Flex
- Eaton
- Chroma ATE
Recent developments
Wiwynn said its Socorro, Texas plant, built with Amazon, will focus on rack-scale server production, with USD 1.6 billion invested (Source: Amazon news release).
Foxconn said its AI rack shipments are expected to more than double in 2026 (Source: Foxconn press release).
Wistron opened its USD 700 million D1 plant in Fort Worth, the first US site to mass produce GB300 (Source: Focus Taiwan).
Supermicro added its largest Silicon Valley campus for system design, manufacturing and testing (Source: Supermicro press release).
Sanmina completed its purchase of ZT Systems' data center infrastructure manufacturing business from AMD (Source: Sanmina press release).
NVIDIA said GB300 rack production had reached approximately 1,000 racks per week (Source: NVIDIA earnings call).
Full analysis
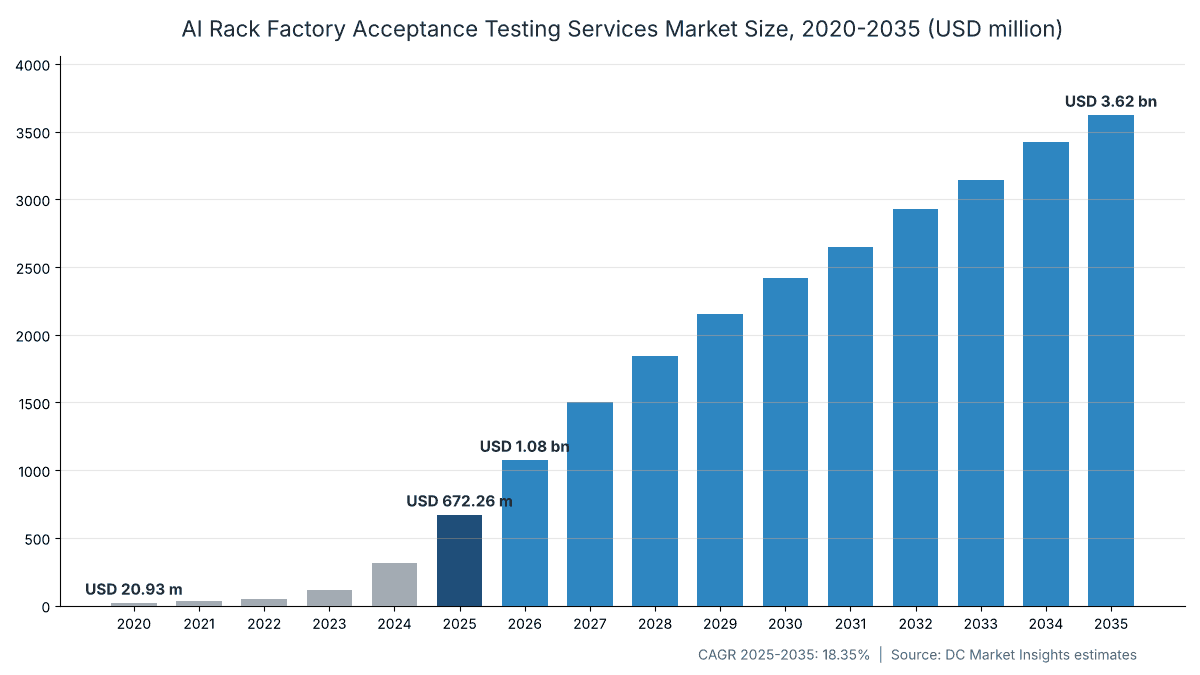
The AI Rack Factory Acceptance Testing Services Market is valued at USD 1.08 billion in 2026 and is projected to reach USD 3.62 billion by 2035, up from USD 672.26 million in 2025, a CAGR of 18.35% from 2025 to 2035 (DC Market Insights estimate). The market covers the rack-level acceptance testing that integrators perform before an AI rack leaves the factory: power-on and burn-in of the full rack, validation of the graphics processing unit (GPU) fabric and network, pressure and leak testing of the liquid cooling loop, power and thermal load tests, and the witness tests and records that a buyer signs before shipment. The build receipt: 4,255 MW of AI IT load tested at rack level in 2025 x USD 158 thousand of test work per MW = USD 672.26 million. Custom Accelerator Racks are the fastest-growing rack type because hyperscalers move more of their own chips into full racks, and the Middle East and Africa is the fastest-growing region, at 25.10% a year, because Gulf AI campuses buy racks that arrive fully tested. This report sits under the AI Data Center Market, which sizes the facilities these racks go into.
Key Market Statistics: How Big Is the AI Rack Factory Acceptance Testing Services Market in 2026?
The AI Rack Factory Acceptance Testing Services Market is worth USD 1.08 billion in 2026, 60.01% more than in 2025, as rack-scale GPU systems become the normal unit of AI purchase. The figures below are DC Market Insights estimates.
- Market size 2025: USD 672.26 million
- Market size 2026: USD 1.08 billion
- Market size 2030: USD 2.42 billion
- Market size 2035: USD 3.62 billion
- CAGR 2025-2035: 18.35% base case, 16.11% low case, 20.23% high case
- Largest test type: Functional, Burn-in and Stress Testing, 34.17% of 2025 value
- Fastest test type: Liquid Cooling Pressure and Leak Testing, 21.36% a year
- Fastest buyer type: Enterprise and Sovereign AI, 20.44% a year
- Leading region: North America, 61.37% of 2025 value
- Fastest region: Middle East and Africa, 25.10% a year
- Largest country: United States, 58.71% of 2025 value
- Market leader: Foxconn (Hon Hai), DC Market Insights assessment
Key takeaways.
- AI rack factory acceptance testing is now a standard step for every liquid-cooled GPU rack before shipment.
- Liquid cooling and fabric checks gain share from basic burn-in as rack power rises.
- Test lines are moving from Taiwan to Mexico and Texas, closer to US buyers.
- The Middle East and Africa is the fastest-growing region; North America stays the largest.
Executive Summary
The Global AI Rack Factory Acceptance Testing Services Market size was valued at USD 20.93 million in 2020, reached USD 672.26 million in 2025, and is anticipated to reach USD 3.62 billion by 2035, at a CAGR of 18.35% during the forecast period.
| Report attribute | Details |
|---|---|
| Historical Period | 2020-2024 |
| Base Year | 2025 |
| Forecast Period | 2026-2035 |
| AI Rack Factory Acceptance Testing Services Market Size 2025 | USD 672.26 million |
| AI Rack Factory Acceptance Testing Services Market Size 2026 | USD 1.08 billion |
| AI Rack Factory Acceptance Testing Services Market, CAGR | 18.35% |
| AI Rack Factory Acceptance Testing Services Market Size 2035 | USD 3.62 billion |
Growth from 2020 to 2025 ran at 100.15% a year because the unit of sale changed. In 2020 most AI servers shipped as single nodes and were cabled on site, so only about 38% of AI capacity went through a rack-level test line. By 2025 the share was about 82%, because a liquid-cooled rack with 72 GPUs joined by one copper fabric cannot be split into parts and checked later. NVIDIA describes the GB300 NVL72 as a fully liquid-cooled rack-scale system with 72 Blackwell Ultra GPUs and 36 Grace central processing units (CPUs) (Source: NVIDIA Corporation (NVIDIA) product page). The forecast slows to 18.35% because the share of racks tested at the factory is already high, and because test lines automate as volumes rise, which lowers the test cost per MW from 2026.
Market Scope: What Does AI Rack Factory Acceptance Testing Cover?
The market covers paid and in-house test work done on complete AI racks at the integration site before shipment, valued at the cost a buyer pays for it inside the rack price or as a separate service.
Included. Level 11 (L11) full-rack testing and the rack-level part of Level 12 (L12) cluster testing; burn-in and stress runs; NVLink, InfiniBand and Ethernet fabric checks; coolant loop pressure, flow and leak tests; power shelf and thermal load tests; customer witness testing, test reports and sign-off; rack emulator and load bank services used to test racks and coolant distribution units (CDUs) before IT gear is fitted.
Excluded. Chip and wafer test, Level 10 (L10) single-node test when it is not part of a rack line, site acceptance testing (SAT) after delivery, data hall commissioning, and the sale of test equipment itself. Those belong to semiconductor test and commissioning markets.
How the segments fit together. Each tested rack is counted once by test type, once by provider, once by rack type and once by buyer, and each dimension sums to the total. Regions follow where the racks are deployed, not where they are tested, so a rack tested in Mexico for a Texas campus counts in North America.
Supply side, product life cycle and test site map. On the supply side, AI rack factory acceptance testing is run by the integrators that build the racks, plus a small group of independent labs and emulator suppliers. Across the product life cycle, test work peaks at new product introduction, when each rack generation gets a fresh test plan, and then falls per rack as mass production automates. The map of test sites follows the plants: Taiwan, Mexico, Texas, Wisconsin and Malaysia hold most rack test bays today.
Why Do AI Rack Factory Acceptance Testing Services Market Estimates Differ?
Estimates differ mainly because some count the whole value of rack integration, while this report counts only the test work inside it, which keeps the 2025 figure at USD 672.26 million.
| Element | In this report | Why |
|---|---|---|
| Rack assembly and cabling labor | Excluded | Assembly is integration, not acceptance testing |
| In-house test lines at original design manufacturers (ODMs) and original equipment manufacturers (OEMs) | Included at imputed cost | Most AI rack testing never appears as a separate invoice |
| Test equipment sales | Excluded | Counted once, as the cost of the test service |
| Site acceptance and commissioning | Excluded | Done at the data center, after shipment |
| Regional split | By deployment region | Testing is concentrated in Mexico, Taiwan and the United States |
What Drives Spending on Testing AI Racks Before They Ship?
Three forces drive AI rack factory acceptance testing: rack volumes that more than double, racks that cannot be fixed easily once installed, and buyers who demand proof before they accept a rack worth millions.
Rack-scale volumes are surging
On its Q2 fiscal 2026 call in August 2025, NVIDIA said GB300 production was back at full speed, producing approximately 1,000 racks per week (Source: NVIDIA earnings call transcript). In November 2025, Foxconn chairman Young Liu said the company could make 1,000 AI racks per week (Source: Reuters). Foxconn said in August 2026 that its AI rack shipments are expected to more than double in 2026 (Source: Foxconn press release). NVIDIA reported fiscal 2026 Data Center revenue of a record USD 193.7 billion, up 68% (Source: NVIDIA results release filed with the U.S. Securities and Exchange Commission). Each of those racks passes a full-rack test before it ships, so test hours rise in step with rack output.
A failed rack is costly to fix on site
During the GB200 ramp, engineers reported software bugs, inter-chip connectivity problems and leaking liquid cooling systems, and suppliers responded by increasing the number of testing protocols before shipment (Source: DatacenterDynamics, May 2025). Early in 2025, Reuters reported overheating and chip connection glitches in the first Blackwell racks. A rack that fails in the data hall idles 72 GPUs and a share of a training cluster, so buyers would rather pay for longer burn-in at the factory than lose days on site.
Rack power and liquid cooling add test steps
Supermicro lists the operating power of its GB200 NVL72 rack at 125 kW to 135 kW, fed by eight 33 kW power shelves (Source: Supermicro datasheet). Flex says rack power is moving from about 125 kW to up to 880 kW on a future GPU platform (Source: Flex press release, March 2026). Each step up in power adds coolant loop, power shelf and thermal tests, and the test bay must supply that power and remove that heat. That is why the liquid cooling and power test segments together hold close to two fifths of the market in 2035.
How Is AI Rack Testing Moving From Taiwan to North America?
AI rack factory acceptance testing is moving closer to the buyer, becoming automated, and starting earlier in the design cycle, as integrators build test lines in North America and use emulators to test cooling before GPUs arrive.
New test lines in Texas, Mexico and Wisconsin
In April 2025 NVIDIA said it is building supercomputer manufacturing plants in Texas with Foxconn in Houston and Wistron in Dallas (Source: NVIDIA blog). Wistron opened its USD 700 million D1 plant in Fort Worth in July 2026, the first US site to mass produce GB300 (Source: Focus Taiwan). Wiwynn has invested USD 1.6 billion in a rack-scale plant in Socorro, Texas, built with Amazon, and Mexico holds 70% of its capacity (Source: Taipei Times, September 2026). Each plant adds full-rack test bays with megawatt-scale power feeds.
Rack emulators test cooling before the GPUs arrive
Eaton, which now includes Boyd Thermal, sells a rack emulator rated at up to 250 kW at 480 VAC that simulates the heat load and pressure drop of an IT rack, so CDUs can be tested before IT gear is installed (Source: Eaton product page). Chroma says its 63200A direct current (DC) load can run up to 60 units in parallel for 1.44 MW and covers testing from the power supply unit (PSU) to the power rack (Source: Chroma, January 2026). These tools let independent labs sell test time that used to sit only inside original design manufacturer plants.
Layered validation becomes the norm
ASUSTeK Computer (ASUS) describes a six-layer validation framework from L10 single-node testing to L11 full-rack testing for the Vera Rubin NVL72, covering hardware, basic input/output system (BIOS), baseboard management controller (BMC), power cycling and stress, NVIDIA validation tools and performance tests, and any failed item blocks the next stage (Source: ASUS, August 2026). Dell says its Integrated Rack Scalable Systems combine L11 factory integration with L12 solution testing (Source: Dell blog). Fabric checks therefore grow faster than basic burn-in through 2035.
What Holds Back Spending on Factory Testing of AI Racks?
Two limits hold back AI rack factory acceptance testing: automation that cuts the cost of each test, and test bays that need scarce power and floor space.
Automation lowers the cost per tested MW
As lines mature, scripts replace engineers and the same bay tests denser racks. DC Market Insights models the test value per MW falling from about USD 158 thousand in 2025 to about USD 119 thousand in 2035. Supermicro says it ships racks that are tested and then delivered in shock and vibration tested crates, a sign that testing is becoming a standard line step rather than a custom service (Source: Supermicro, July 2026).
Test bays need power, water and space
A rack drawing 132 kW must run at full load during burn-in, so a plant testing 1,000 racks a week needs many megawatts of test power and a heat rejection loop. Supermicro’s new Silicon Valley campus spans about 32.8 acres and more than 714,000 square feet for design, manufacturing and testing (Source: Supermicro, April 2026). Plants that cannot add power queue racks or cut burn-in time, which caps test spend.
Where Are the New Revenue Pools in AI Rack Testing?
The two largest new pools in AI rack factory acceptance testing are liquid cooling validation and testing for independent buyers outside the hyperscale channel.
Liquid cooling validation
Liquid cooling pressure and leak testing grows from USD 115.36 million in 2025 to USD 799.67 million by 2035. Each new rack generation adds manifolds, quick disconnects and cold plates that must hold pressure before shipment.
Independent labs for neoclouds and sovereign buyers
Independent test labs and emulator services grow from USD 39.19 million in 2025 to USD 256.53 million by 2035. GPU cloud providers and sovereign AI programs often buy from several vendors and want a neutral witness test, unlike hyperscalers that run their own acceptance teams inside ODM plants.
Pricing: How Much Does It Cost to Test an AI Rack per MW?
AI rack factory acceptance testing costs about USD 158 thousand per MW of AI rack load in 2025, or roughly USD 20.9 thousand for a 132 kW rack, according to DC Market Insights unit values.
| Year | Test value per MW (USD thousand) | Share of AI capacity tested at rack level | Per 132 kW rack equivalent (USD thousand) |
|---|---|---|---|
| 2020 | 85 | 38% | 11.2 |
| 2025 | 158 | 82% | 20.9 |
| 2030 | 137 | 92% | 18.1 |
| 2035 | 119 | 95% | 15.7 |
The values above are DC Market Insights unit estimates. Public anchors frame the cost. Supermicro rates a GB200 NVL72 rack at 125 kW to 135 kW, so a 48 hour burn-in uses about 6.3 MWh of power, a small share of the cost. Most of the value is test bay capacity, engineer time, fabric test gear and rework of failed trays. Eaton rates its rack emulator at up to 250 kW per unit, and Chroma’s DC load scales to 1.44 MW, which shows the size of the power gear a test bay must hold.
Standards and Regulation: Which Rules Shape AI Rack Acceptance Tests?
No law requires AI rack factory acceptance testing, so the rules come from general acceptance test standards, open rack specifications and the chip vendor’s own validation tools.
IEC 62381. IEC 62381:2024 defines requirements and checklists for the factory acceptance test (FAT), the site acceptance test (SAT) and the site integration test (SIT) (Source: International Electrotechnical Commission (IEC) publication record). AI rack buyers borrow its structure for test plans, punch lists and sign-off.
Open Rack V3. Open Compute Project (OCP) listed Open Rack V3 (ORv3) products use a 48 V DC busbar, and the Rittal ORv3 listing rates its busbar at 18 kW and prepares it for direct liquid cooling (Source: OCP marketplace). Busbar and power shelf checks are part of every ORv3 rack test.
Vendor validation suites. Integrators run NVIDIA validation tools such as NVQual, NVSSVT, partner diagnostics and the Data Center GPU Manager (DCGM) before release, according to ASUS. Passing them is a condition for shipping a certified rack.
Market Segmentation: Which Test Type and Rack Type Lead AI Rack Acceptance Testing?
In AI rack factory acceptance testing, Functional, Burn-in and Stress Testing leads with 34.17% of 2025 value, while Liquid Cooling Pressure and Leak Testing grows fastest at 21.36% a year. All values in the tables below are DC Market Insights estimates.
By Test Type: Functional, Burn-in and Stress Testing Leads with 34.17%
Functional, Burn-in and Stress Testing holds the largest share, and Liquid Cooling Pressure and Leak Testing grows fastest at 21.36% a year, because every rack runs power-on, burn-in and stress tests before any other check, while fabric validation gains as NVLink domains grow from 72 GPUs to larger scale-up groups.
| Segment | 2025 (USD million) | Share 2025 | 2035 (USD million) | CAGR 2025-2035 |
|---|---|---|---|---|
| Functional, Burn-in and Stress Testing | 229.71 | 34.17% | 1,048.24 | 16.39% |
| Fabric and Network Validation | 150.45 | 22.38% | 898.95 | 19.57% |
| Liquid Cooling Pressure and Leak Testing | 115.36 | 17.16% | 799.67 | 21.36% |
| Power and Thermal Load Testing | 97.61 | 14.52% | 574.66 | 19.40% |
| Customer Witness Testing and Documentation | 79.13 | 11.77% | 301.83 | 14.33% |
By Provider: ODM In-house Test Lines Leads with 61.24%
ODM In-house Test Lines holds the largest share, and EMS Rack Integrators grows fastest at 22.75% a year, because Foxconn, Quanta and the Wistron group build most AI racks and test them on their own lines, while electronics manufacturing services (EMS) integrators such as Celestica, Sanmina, Jabil and Flex gain as AMD and custom chip racks spread.
| Segment | 2025 (USD million) | Share 2025 | 2035 (USD million) | CAGR 2025-2035 |
|---|---|---|---|---|
| ODM In-house Test Lines | 411.69 | 61.24% | 2,060.60 | 17.47% |
| OEM Factory Integration Centers | 155.36 | 23.11% | 793.51 | 17.71% |
| EMS Rack Integrators | 66.02 | 9.82% | 512.70 | 22.75% |
| Independent Test Labs and Emulator Services | 39.19 | 5.83% | 256.53 | 20.67% |
By Rack Type: GPU Rack-scale Systems Leads with 54.86%
GPU Rack-scale Systems holds the largest share, and Custom Accelerator Racks grows fastest at 21.30% a year, because NVL72-class racks carry the deepest test plan, while custom accelerator racks gain as hyperscalers deploy their own chips at rack scale.
| Segment | 2025 (USD million) | Share 2025 | 2035 (USD million) | CAGR 2025-2035 |
|---|---|---|---|---|
| GPU Rack-scale Systems | 368.80 | 54.86% | 2,308.80 | 20.13% |
| 8-GPU Server Racks | 193.14 | 28.73% | 554.01 | 11.11% |
| Custom Accelerator Racks | 110.32 | 16.41% | 760.54 | 21.30% |
By End User: Hyperscale Cloud Providers Leads with 59.38%
Hyperscale Cloud Providers holds the largest share, and Enterprise and Sovereign AI grows fastest at 20.44% a year, because the four largest cloud providers buy most AI racks, while enterprise and sovereign AI buyers grow fastest as governments and large firms build their own AI capacity.
| Segment | 2025 (USD million) | Share 2025 | 2035 (USD million) | CAGR 2025-2035 |
|---|---|---|---|---|
| Hyperscale Cloud Providers | 399.19 | 59.38% | 1,889.94 | 16.82% |
| AI and GPU Cloud Providers | 151.73 | 22.57% | 954.39 | 20.19% |
| Enterprise and Sovereign AI | 121.34 | 18.05% | 779.02 | 20.44% |
DC Exclusive: The Tested-MW Model and Rack Type x Region Matrix
The largest cell in AI rack factory acceptance testing is GPU Rack-scale Systems in North America, at USD 240.31 million in 2025. This is a DC Market Insights model built from 9 inputs and tested against 3 bound checks: it links AI capacity added and refreshed each year to the share tested at rack level and the test value per MW.
| Rack type (2025, USD million) | North America | Asia Pacific | Europe | Middle East and Africa | Latin America | Total |
|---|---|---|---|---|---|---|
| GPU Rack-scale Systems | 240.31 | 66.96 | 33.13 | 22.13 | 6.27 | 368.80 |
| 8-GPU Server Racks | 105.90 | 52.08 | 21.13 | 8.63 | 5.40 | 193.14 |
| Custom Accelerator Racks | 66.35 | 26.44 | 11.15 | 4.13 | 2.25 | 110.32 |
Regional Insights: Which Region Leads AI Rack Acceptance Testing?
North America leads AI rack factory acceptance testing with 61.37% of 2025 value because most AI racks are deployed in US hyperscale campuses. The Middle East and Africa is the fastest-growing region, at 25.10% a year, because Gulf AI campuses buy racks that arrive fully tested.
North America Leads with 61.37% Share
North America accounts for 61.37% of 2025 value and grows at 16.58% a year to 2035. US hyperscalers take the bulk of NVL72-class racks, and new test plants in Houston, Fort Worth and Socorro shorten the trip from test bay to data hall. Meta expects 2026 capital expenditures of USD 130 billion to USD 145 billion (Source: Meta results release, July 2026).
Asia Pacific Holds 21.64% Share
Asia Pacific accounts for 21.64% of 2025 value and grows at 19.88% a year to 2035. China, Japan, South Korea, India and Malaysia add AI capacity, and Taiwan’s ODMs run large test lines for the region. Taiwan’s exports reached a record USD 87.22 billion in September 2026 (Source: Ministry of Finance via Focus Taiwan).
Europe Holds 9.73% Share
Europe accounts for 9.73% of 2025 value and grows at 19.45% a year to 2035. Germany, the United Kingdom and France lead European AI deployments, and sovereign AI projects ask for witness tests and full records before they accept racks.
Middle East and Africa Holds 5.19% Share
Middle East and Africa accounts for 5.19% of 2025 value and grows at 25.10% a year to 2035. The United Arab Emirates and Saudi Arabia build large AI campuses far from the test plants, so buyers insist on fully tested racks and longer burn-in before shipment.
Latin America Holds 2.07% Share
Latin America accounts for 2.07% of 2025 value and grows at 22.28% a year to 2035. Mexico hosts major test lines but deploys few AI racks itself; Brazil and Mexico lead the small regional demand.
Country Analysis: Which Countries Spend the Most on Testing AI Racks?
The United States spends the most on AI rack factory acceptance testing, with 58.71% of 2025 value, followed by China and Japan; India and the United Arab Emirates grow fastest among the top 12. Values are DC Market Insights estimates by deployment country.
| Rank | Country | Region | 2025 (USD million) | Share 2025 | 2035 (USD million) | CAGR 2025-2035 |
|---|---|---|---|---|---|---|
| 1 | United States | North America | 394.68 | 58.71% | 1,812.76 | 16.47% |
| 2 | China | Asia Pacific | 63.73 | 9.48% | 326.46 | 17.75% |
| 3 | Japan | Asia Pacific | 19.56 | 2.91% | 102.90 | 18.06% |
| 4 | Canada | North America | 17.88 | 2.66% | 100.00 | 18.78% |
| 5 | Germany | Europe | 17.61 | 2.62% | 90.22 | 17.75% |
| 6 | United Arab Emirates | Middle East and Africa | 16.60 | 2.47% | 144.21 | 24.13% |
| 7 | United Kingdom | Europe | 16.40 | 2.44% | 94.93 | 19.19% |
| 8 | Malaysia | Asia Pacific | 16.20 | 2.41% | 115.58 | 21.71% |
| 9 | South Korea | Asia Pacific | 15.87 | 2.36% | 94.93 | 19.59% |
| 10 | India | Asia Pacific | 14.39 | 2.14% | 144.21 | 25.92% |
| 11 | Saudi Arabia | Middle East and Africa | 14.32 | 2.13% | 127.18 | 24.41% |
| 12 | Singapore | Asia Pacific | 12.57 | 1.87% | 55.44 | 16.00% |
AI rack factory acceptance testing outside the top 12 is led by France, which holds 1.51% of 2025 value and grows 20.97% a year as sovereign AI clusters near Paris add liquid-cooled racks. Saudi Arabia holds 2.13% of 2025 value and grows 24.41% a year, and South Korea holds 2.36% and grows 19.59% a year as its chipmakers and cloud providers add GPU halls. These shares are DC Market Insights estimates.
Forecast Scenarios: What Could Change the 2035 AI Rack Testing Forecast?
The 2035 value of AI rack factory acceptance testing ranges from USD 2.99 billion in the low case to USD 4.24 billion in the high case, around a base of USD 3.62 billion.
| Scenario | Assumption from 2026 | 2035 value | CAGR 2025-2035 |
|---|---|---|---|
| Low | AI capacity additions about 15% below base and faster test automation | USD 2.99 billion | 16.11% |
| Base | DC Market Insights capacity model, test value per MW falling to USD 119 thousand | USD 3.62 billion | 18.35% |
| High | AI capacity additions about 15% above base and longer burn-in for racks above 500 kW | USD 4.24 billion | 20.23% |
Competitive Insights: Who Leads AI Rack Factory Acceptance Testing?
Foxconn (Hon Hai) leads AI rack factory acceptance testing because it builds and tests the largest number of AI racks, followed by Quanta and the Wistron group.
- Foxconn (Hon Hai)
- Quanta Computer
- Wistron
- Wiwynn
- Inventec
- Dell Technologies
- Hewlett Packard Enterprise
- Supermicro
- Lenovo
- ASUS
- Gigabyte
- Celestica
- Sanmina
- Jabil
- Flex
- Eaton
- Chroma ATE
The top three hold about 61% of 2025 value. That share is a DC Market Insights assessment. Foxconn’s rotating CEO said the company holds more than 40 percent of the global AI server market (Source: Focus Taiwan, October 2026), and its test lines run in Mexico, Texas, Wisconsin and Taiwan. Quanta tests racks for several hyperscalers in Taiwan and the United States. The Wistron group pairs Wistron’s GB300 plant in Fort Worth with Wiwynn, whose 2025 revenue reached NT$950.663 billion with AI products above half of it (Source: Wiwynn results release). Dell, Hewlett Packard Enterprise and Supermicro sell factory-tested racks under their own brands, and Sanmina became AMD’s preferred new product introduction partner for rack-scale AI after buying ZT Systems’ manufacturing business (Source: Sanmina release, October 2025).
Recent Developments
These are the latest moves in AI rack factory acceptance testing capacity.
- In September 2026, Wiwynn said its Socorro, Texas plant, built with Amazon, will focus on rack-scale server production, with USD 1.6 billion invested (Source: Amazon news release).
- In August 2026, Foxconn said its AI rack shipments are expected to more than double in 2026 (Source: Foxconn press release).
- In July 2026, Wistron opened its USD 700 million D1 plant in Fort Worth, the first US site to mass produce GB300 (Source: Focus Taiwan).
- In April 2026, Supermicro added its largest Silicon Valley campus for system design, manufacturing and testing (Source: Supermicro press release).
- In October 2025, Sanmina completed its purchase of ZT Systems’ data center infrastructure manufacturing business from AMD (Source: Sanmina press release).
- In August 2025, NVIDIA said GB300 rack production had reached approximately 1,000 racks per week (Source: NVIDIA earnings call).
More reports on AI hardware sit in our industry directory, including the Data Center Rack Power Distribution Unit Market and the Direct-to-Chip Liquid Cooling Market.
Methodology: How We Built the AI Rack Testing Model
We built the AI rack factory acceptance testing model bottom-up from AI capacity. AI IT load deployed each year equals new AI capacity (completed capacity of 12,000 MW in 2025 times an AI share of 35%) plus a 12% yearly refresh of the installed AI base, which gives about 5,189 MW in 2025 and 32,051 MW in 2035.
The share of that load tested at rack level rises from 38% in 2020 to 82% in 2025 and 95% in 2035. The test value per MW rises from USD 85 thousand in 2020 to USD 158 thousand in 2025 as liquid cooling and fabric tests are added, then falls to USD 119 thousand by 2035 with automation. Splits by test type, provider, rack type and buyer come from rack mix and channel evidence in company releases.
Three bound checks hold. First, the 2025 value is about 0.35% of NVIDIA’s fiscal 2026 Data Center revenue of USD 193.7 billion, a ceiling no test cost should approach. Second, the GPU rack-scale segment implies about 17,700 tested NVL72-class racks in 2025, below NVIDIA’s run rate of about 1,000 racks a week. Third, as a floor, 18,000 racks at a minimum test value of USD 10 thousand each give about USD 180 million, well under the model. Full rules are on our research methodology page. The analyst named on this page built the model, and the reviewer checked the arithmetic, the sources and the dates before publication.
Table of contents
- 01Introduction
- 1.1Market Definition and Scope
- 1.2Research Methodology
- 1.3Base Year, Forecast Period and Units
- 02Executive Summary
- 2.1Key Market Statistics
- 2.2Market Size 2020-2035
- 03Market Dynamics
- 3.1Market Drivers
- 3.2Market Trends
- 3.3Market Challenges
- 3.4Market Opportunities
- 04Pricing and Test Value per MW
- 05Standards and Regulation
- 06Market Segmentation
- 6.1By Test Type
- 6.2By Provider
- 6.3By Rack Type
- 6.4By End User
- 07DC Exclusive: Rack Type x Region Matrix
- 08Regional Insights
- 8.1North America
- 8.2Asia Pacific
- 8.3Europe
- 8.4Middle East and Africa
- 8.5Latin America
- 09Country Analysis
- 10Forecast Scenarios
- 11Competitive Landscape
- 11.1Company List
- 11.2Recent Developments
- Fig. 1AI Rack Factory Acceptance Testing Services Market Size, 2020-2035
- Table 1Report Attributes
- Table 2Scope Comparison
- Table 3Test Value per MW
- Table 4Tables 4-7. Segment Values by Dimension
- Table 8Rack Type x Region Matrix
- Table 9Top 12 Countries
- Table 10Forecast Scenarios
About this report
Written by Amit Jain and reviewed by Deepti Agrawal, Senior Editor, Research. Figures are built top-down and bottom-up and reconciled before publication, with 2025 as the base year.
Read our methodologyHow we built this
- Historical period2020-2024
- Base year2025
- Forecast period2026-2035
- Sizing approachTop-down + bottom-up
Need more than the report?
Advisory on this market
Due diligence, site selection and market entry work, by the analysts who wrote this report.
See consulting servicesFrequently asked questions
USD 1.08 billion in 2026, up 60.01% from USD 672.26 million in 2025, according to DC Market Insights estimates. The market is projected to reach USD 3.62 billion by 2035, a CAGR of 18.35%.
USD 3.62 billion by 2035, up from USD 672.26 million in 2025, according to DC Market Insights estimates. The market was USD 20.93 million in 2020.
It is the test work done on complete AI racks before they ship, worth USD 672.26 million in 2025: burn-in, fabric checks, liquid cooling leak tests, power and thermal tests and customer witness tests. Site commissioning and chip test are excluded.
18.35% a year from 2025 to 2035, slower than 100.15% from 2020 to 2025, because most AI racks are already tested at rack level and automation lowers the cost per MW.
Functional, Burn-in and Stress Testing, with 34.17% of 2025 value, because every rack runs power-on, burn-in and stress tests first.
Liquid Cooling Pressure and Leak Testing, at 21.36% a year from 2025 to 2035, as each rack generation adds manifolds, quick disconnects and cold plates that must hold pressure.
About USD 158 thousand per MW of rack load in 2025, or roughly USD 20.9 thousand for a 132 kW rack, according to DC Market Insights unit values.
North America, with 61.37% of 2025 value. The Middle East and Africa grows fastest at 25.10% a year as Gulf AI campuses buy fully tested racks.
Foxconn (Hon Hai), Quanta and the Wistron group lead, with about 61% of 2025 value together (DC Market Insights assessment). Dell, Hewlett Packard Enterprise, Supermicro, Celestica and Sanmina also compete.
Hyperscale Cloud Providers, with 59.38% of 2025 value. Enterprise and Sovereign AI grow fastest at 20.44% a year.
Because a failed rack idles 72 GPUs on site. During the GB200 ramp, engineers reported connectivity problems and coolant leaks, and suppliers added testing protocols before shipment (Source: DatacenterDynamics, May 2025).
GPU Rack-scale Systems rated at 125 kW to 135 kW per rack lead, with 54.86% of 2025 value, because NVL72-class racks carry the deepest test plan. Racks above 500 kW drive the high scenario later in the decade.
Testing bundled into the rack contract leads: ODM in-house test lines hold 61.24% of 2025 value. Independent test labs and emulator services, often bought under separate witness-test contracts, hold 5.83%.
Licences, delivery and payment
Which licence should I choose?
Single User is a view-only PDF for one person. Multi User adds a printable PDF and the Excel data for unlimited users at one location. Enterprise covers your whole company and includes 100 free analyst hours.
How and when will I receive the report?
By email, within 24–48 business hours of payment, in the formats of your licence.
How can I pay?
Securely through PayPal: with a PayPal account, a debit or credit card, or PayPal Pay Later where available. Prices are in US dollars.
Can I see a sample first?
Yes. Request a free sample and we will email it to you.
Can the report be tailored to my needs?
Yes. We can add countries, segments or data cuts. Talk to an analyst about the scope you need.
Can I get an invoice or pay against a purchase order?
Write to sales@dcmarketinsights.com and our team will help.