
Oslo Data Center Market Size, Share & Forecast to 2035
Market at a glance
The Oslo Data Center market was worth USD 423.9 million in 2025 and is forecast to reach USD 1,050.0 million by 2035, growing at a 9.45% CAGR. Akershus accounts for 44.36% of the market.
 By Amit Jain, Senior Consultant, ICT & Emerging Technologies
 Reviewed by Deepti Agrawal
Last updated 16 Oct 2026
Base year 2025 actual capacity, 2026 current year PDF + Excel
Reviewed by Deepti Agrawal
Last updated 16 Oct 2026
Base year 2025 actual capacity, 2026 current year PDF + Excel
Source: DC Market Insights analysis
Key findings
A Grid Queue Far Larger Than Installed Capacity
Liquid-Ready Halls for AI Racks
Grid Connections Take Years
AI and GPU Cloud Halls
What is inside the report
- 01Introduction
- 02Executive Summary
- 03Market Dynamics
- 04Pricing and Regulation
- 05Oslo Data Center Market, By Component
- 06Oslo Data Center Market, By Data Center Type
- 07Oslo Data Center Market, By End Use
- 08DC Exclusive: Type x Component Matrix
- 09Oslo Data Center Market, By Area
- 10Forecast Scenarios
- 11chapters
- 2020-2024Historical period
- 2026-2035Forecast period
- 17Companies profiled
Regional insights
- Akershus44.36%
- Oslo Municipality28.79%
- Hamar and Innlandet12.63%
- Østfold8.17%
- Buskerud6.05%
Segmentation
Companies profiled
- Green Mountain
- STACK Infrastructure
- Skygard
- Bulk Infrastructure
- Digital Realty
- Microsoft
- Telenor
- Hafslund
- Basefarm
- Tietoevry
- Atea
- Schneider Electric
- ABB
- Vertiv
- Eaton
- Caverion
- Coromatic
Recent developments
Statistics Norway reported 794 MW of data center capacity in use and 6,833 MW in Statnett's queue (Source: Statistics Norway).
104 data centers were registered with Nkom, including 26 internal sites (Source: Statistics Norway, April 2026).
Statistics Norway reported that service industries paid 62.5 øre per kWh for electricity in 2025, up 13% (Source: Statistics Norway).
the government's data center strategy listed 2,691 MW reserved and 4,390 MW queued for data centers (Source: Government of Norway).
38 operators had registered 58 data centers with Nkom by the deadline (Source: Altinget).
Bulk Infrastructure doubled its Oslo Internet Exchange facility to 14 MW (Source: DatacenterDynamics).
Full analysis
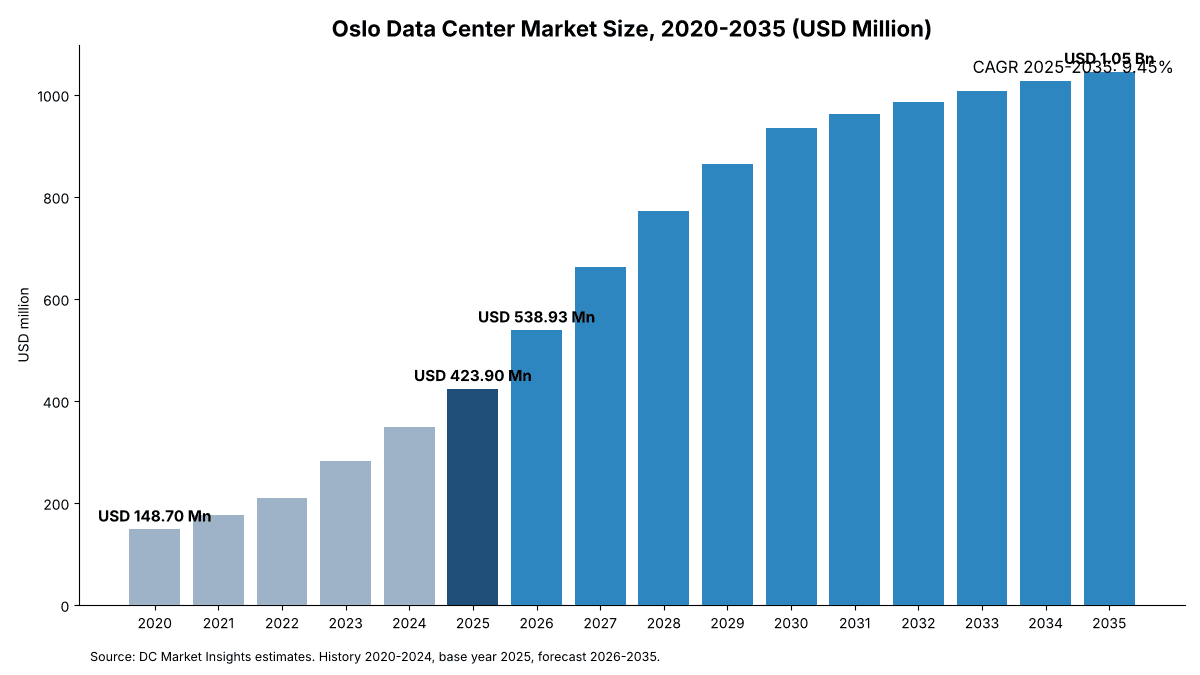
The Oslo Data Center Market is valued at USD 538.93 million in 2026 and is projected to reach USD 1.05 billion by 2035, up from USD 423.90 million in 2025, a CAGR of 9.45% from 2025 to 2035 (DC Market Insights estimate). The market covers what owners and tenants spend each year to build, equip and run data centers in the Oslo region: Oslo municipality plus the campuses in Akershus, Østfold, Buskerud and the Hamar area that operators sell as Oslo capacity. The build receipt for 2025 is 30 MW (megawatts) of new information technology (IT) load x USD 10.05 million per MW = USD 301.44 million of construction and fit-out, plus 175 MW of operating capacity x USD 0.70 million per MW = USD 122.46 million of operations and maintenance spend. AI and GPU cloud halls are the fastest growing segment at 23.88% a year, and Hamar and Innlandet is the fastest growing area at 15.44% a year because new campuses there have grid power that central Oslo lacks. The Oslo region holds about 40% of the Norway Data Center Market, which is valued at USD 1.06 billion in 2025.
Key Market Statistics: How Big Is the Oslo Data Center Market in 2026?
The Oslo Data Center Market is worth USD 538.93 million in 2026, a 27.14% rise on 2025 as Oslo region campuses add record capacity (DC Market Insights estimate).
- Market size 2025: USD 423.90 million
- Market size 2026: USD 538.93 million
- Market size 2030: USD 935.25 million
- Market size 2035: USD 1.05 billion
- CAGR 2025-2035 base case: 9.45%; low case 7.91%; high case 10.83%
- Largest component: operations and maintenance services, 28.89% of 2025 spend
- Fastest growing segment: AI and GPU cloud halls, 23.88% a year
- Fastest growing buyer type: AI developers and research, 12.23% a year
- Leading area: Akershus, 44.36% of 2025 spend
- Fastest growing area: Hamar and Innlandet, 15.44% a year
- Largest municipality: Oslo, 28.79% of 2025 spend
- Market leader: Green Mountain (DC Market Insights assessment)
Executive Summary
The Oslo Data Center Market size was valued at USD 148.70 million in 2020, reached USD 423.90 million in 2025, and is anticipated to reach USD 1.05 billion by 2035, at a CAGR of 9.45% during the forecast period.
| Report attribute | Details |
|---|---|
| Historical Period | 2020-2024 |
| Base Year | 2025 |
| Forecast Period | 2026-2035 |
| Oslo Data Center Market Size 2025 | USD 423.90 million |
| Oslo Data Center Market Size 2026 | USD 538.93 million |
| Oslo Data Center Market, CAGR | 9.45% |
| Oslo Data Center Market Size 2035 | USD 1.05 billion |
Spend grew 23.31% a year from 2020 to 2025 because the Oslo region went from about 97 MW to 205 MW of operating IT load in five years (DC Market Insights estimate), led by colocation campuses at Enebakk, east Oslo and the Oslo Internet Exchange. Growth slows to 9.45% a year after 2025 for two reasons. First, the yearly build peaks at about 58 MW in 2030 and then eases as the best grid connections near Oslo are used up. Second, the operating base grows large, so steady service spend, not one-off construction, becomes the biggest line. Norway as a whole had 794 MW of data center capacity in use in April 2026, with another 6,833 MW waiting in the grid queue (Source: Statistics Norway, April 2026), so demand for Oslo region sites is not the limit; power and land are.
Market Scope: What Does the Oslo Data Center Market Cover?
The Oslo Data Center Market covers yearly spend on building, fitting out and running data centers in the Oslo region, USD 423.90 million in 2025 (DC Market Insights estimate).
Included. Electrical systems (grid connection, transformers, switchgear, uninterruptible power supply (UPS) and generators), mechanical and cooling plant, buildings and civil works, white space fit-out (racks, containment, cabling and data center infrastructure management (DCIM) software), and operations and maintenance services on the installed base, whether bought by a colocation operator, a cloud provider, a bank or a public agency. Oslo region data center sites in Oslo municipality, Akershus (including Enebakk, Nittedal, Lillestrøm, Lørenskog and Vestby), Østfold, Buskerud and the Hamar area are counted.
Excluded. Servers, storage and network equipment owned by tenants, software licences, electricity bills, land purchases and crypto mining sites. Data centers in western Norway, Telemark, Agder and northern Norway belong to the wider Norway report.
How the segments fit together. Every krone of the total sits once in each split: by component, by data center type, by end use and by area. The component split separates one-off construction (71.11% of 2025 spend) from recurring services (28.89%). Values are in US dollars at the yearly average exchange rate of the year spent; the DC Market Insights model converts NOK at about NOK 10.5 per US dollar for 2025.
Related segments and end use. Readers also ask about the Oslo colocation market, Oslo hyperscale data centers, Norway data center construction and Oslo data center power. Colocation is a type split inside this report, construction is the building and civil works component, and power appears as the electrical infrastructure component and in the challenges section.
Related topics buyers ask about. Utilized colocation capacity, measured as MW leased against MW built, drives the wholesale colocation segment. Heat offtake agreements monetising waste heat, such as reported district heating deals with Hafslund, sit in the mechanical and cooling component. Statnett grid connection fees, the Statnett upgrade backlog and local opposition to transformer stations are covered under challenges. Managed hosting providers such as Basefarm, part of Orange Business Services, are buyers in the cloud and IT services end use. A hyperscale demand spike after 2026 is the high scenario, and skilled labour scarcity in electrical trades is a cost driver inside the build cost per MW. Finland holds 0% of this market because it lies outside Norway; Finnish and Swedish campuses compete with Oslo for the same hyperscale tenants but are counted in their own country reports.
Why Do Oslo Data Center Market Estimates Differ?
Oslo estimates differ mainly because of where the boundary is drawn and whether tenant IT equipment is counted. This report counts facility spend only.
| Element | In this report | Why |
|---|---|---|
| Geography | Oslo municipality, Akershus, Østfold, Buskerud and the Hamar area | Operators sell Hamar and Enebakk campuses as Oslo region capacity; city-only counts miss over 70% of spend |
| Tenant IT | Excluded | Servers and storage are sold through separate channels and would double the figure |
| Colocation rent | Excluded; operator build and running costs counted instead | Counting both rent and build cost would count the same hall twice |
| Electricity | Excluded | Power bills follow spot prices, not data center activity |
| Crypto mining | Excluded | No crypto sites in the Oslo region are counted |
| Base year | 2025 actual capacity, 2026 current year | Uses the latest registered capacity data |
Market Drivers: What Pushes Oslo Data Center Spend Up?
Three forces drive Oslo region spend: a capacity build that doubles operating load by 2028, AI halls that cost more per MW, and public and financial buyers that must keep data in Norway.
A Grid Queue Far Larger Than Installed Capacity
Norwegian data centers had 4,350 MW of grid capacity allocated in April 2026, of which 794 MW was in use, with 6,833 MW more under review at the transmission operator Statnett (Source: Statistics Norway, April 2026). The Norwegian Water Resources and Energy Directorate (NVE) expects data center power use to rise from 2.5 terawatt hours (TWh) in 2024 to 6.0 TWh in 2030 (Source: Government of Norway, October 2025). The Oslo region is the main connectivity hub of the country, so a large share of that new demand looks for sites within reach of Oslo. The April 2026 Statistics Norway count is the anchor event for this report: it showed for the first time how far grid allocations (4,350 MW) run ahead of capacity in use (794 MW). In the DC Market Insights model the Oslo region adds 30 MW in 2025, 38 MW in 2026 and about 58 MW at the 2030 peak, which lifts operating load from 205 MW at the end of 2025 to 455 MW at the end of 2030.
Colocation Campuses Scale Up Around Oslo
Green Mountain began a new 10 MW building at Enebakk outside Oslo in November 2023, taking the campus to 41.5 MW, and an international technology company reserved close to 5 MW of it (Source: Green Mountain press release, 17 November 2023). STACK Infrastructure (STACK) designed its Holtskogen campus east of Oslo for three 6 MW buildings, 18 MW in total, at a design power usage effectiveness (PUE) of 1.12 (Source: STACK Infrastructure campus brochure). Bulk Infrastructure doubled its Oslo Internet Exchange (OS-IX) facility to 14 MW in May 2025, with halls for 40 to 50 kW racks for graphics processing unit (GPU) servers (Source: DatacenterDynamics, May 2025). Each new building turns into a wave of electrical, cooling and civil orders, which is why construction made up 71.11% of 2025 spend.
Data Residency for Banks and the Public Sector
Microsoft announced an Azure cloud region in Oslo in 2018, with services from late 2019, and a second region near Stavanger (Source: Microsoft News Centre Europe, June 2018). Banks, insurers and public agencies use in-country regions and colocation to meet supervision and security rules. Norway’s data center regulation now requires operators to register with the Norwegian Communications Authority (Nkom) and keep an appropriate security level; 38 operators had registered 58 data centers by the 1 July 2025 deadline (Source: Altinget, July 2025). These buyers account for 33.71% of 2025 spend through the BFSI and public sector end-use segments, and they favour sites close to Oslo for latency and staff access.
Market Trends: How Is Oslo Data Center Design Changing?
Oslo region data centers are moving to higher rack density, heat export into district heating, and campuses outside the city where grid power is still available.
Liquid-Ready Halls for AI Racks
The OS-IX expansion offers three hall densities, from 3 to 4 kW up to 40 to 50 kW per rack (Source: DatacenterDynamics, May 2025). In the DC Market Insights model AI and GPU halls take 20% of new Oslo region MW in 2025 and 50% by 2030. An AI MW costs about USD 12.60 million to build against USD 9.41 million for a conventional MW in 2025, mainly because of extra electrical and liquid cooling content, so the AI mix raises spend faster than megawatts.
Heat Export Becomes a Design Rule
Since 1 April 2025, new or upgraded data centers above 2 MW must carry out a cost-benefit analysis of using surplus heat, approved by NVE before construction (Source: Government of Norway, October 2025). Skygard, owned by Telenor, Hafslund and HitecVision, built its Hovinbyen site in Oslo to feed surplus heat into the Hafslund district heating network as part of a NOK 2.4 billion first phase (Source: DatacenterDynamics, March 2024). Heat pumps, heat exchangers and piping add about 3% to 5% to mechanical content per MW in DC Market Insights pricing.
Campuses Move to the Edge of the Region
Grid limits in central Oslo push large builds to Enebakk, Nittedal, Vestby and Hamar. Green Mountain’s Hamar campus is planned at 90 MW with NOK 9.7 billion of investment (Source: Statistics Norway, April 2026, citing Menon project figures). Oslo municipality’s share of Oslo region spend therefore falls from 28.79% in 2025 to 22.16% in 2035 while Hamar and Innlandet rises from 12.63% to 21.53%.
Market Challenges: What Holds Oslo Data Center Growth Back?
Grid capacity and power prices hold the Oslo Data Center Market back most, followed by local opposition to large energy users.
Grid Connections Take Years
Statnett had 2,691 MW reserved for new data centers and 4,390 MW of projects waiting in the queue in the government’s October 2025 strategy (Source: Government of Norway, October 2025). The Oslo region is among the most constrained areas, so a project that cannot secure power by 2028 moves to Hamar or out of the region. The DC Market Insights low case cuts new Oslo region MW by 15% from 2026, which gives a 2035 market of USD 907.48 million instead of USD 1.05 billion.
Higher Power Costs and Full Electricity Tax
Service industries paid an average of 62.5 øre per kilowatt hour for electricity in 2025 before taxes and grid rent, up 13% from 55.1 øre in 2024 (Source: Statistics Norway, February 2026). Data centers paid a reduced electricity tax from 2016 to 2022 and have paid the standard rate since 2023 (Source: Computer Weekly, July 2024). Higher running costs push operators toward efficient designs, but they also make Norway less of a price outlier against Sweden and Finland when hyperscalers pick sites.
Market Opportunities: Where Are the New Oslo Revenue Pools?
The two largest new revenue pools are AI hall fit-out and the service base that grows with every MW built.
AI and GPU Cloud Halls
AI and GPU cloud halls grow at 23.88% a year, from 8.01% of 2025 spend to 27.65% of 2035 spend, the fastest of any type (DC Market Insights estimate). Suppliers of liquid cooling, high-density power distribution and fast-build modular halls gain most, because every AI MW carries about USD 3 million more content than a conventional MW.
Operations and Maintenance on a Growing Base
Operations and maintenance services grow at 14.89% a year, the fastest component, as the operating base more than triples from 2025 to 2035. Facility management firms, electrical and cooling service contractors and DCIM software vendors can sell multi-year contracts to every new campus, and heat export systems add new maintenance scope.
Pricing: How Much Does an Oslo Data Center Cost per MW?
An Oslo region data center cost about USD 9.41 million per MW of IT load to build in 2025 for a conventional hall and USD 12.60 million for an AI hall (DC Market Insights estimate).
| Item (USD million per MW) | 2020 | 2025 | 2030 | 2035 |
|---|---|---|---|---|
| Conventional hall build and fit-out | 8.00 | 9.41 | 10.14 | 10.92 |
| AI and GPU hall build and fit-out | 12.60* | 12.60 | 12.29 | 11.98 |
| Operations and maintenance per operating MW per year | 0.62 | 0.70 | 0.72 | 0.74 |
*2020 AI hall cost shown at the 2025 level; the Oslo region built no AI halls that year. Public anchors match these model prices. Menon project figures put Green Mountain’s 27 MW Enebakk site at NOK 3,200 million, about NOK 118.5 million per MW, and its 90 MW Hamar campus at NOK 9,700 million, about NOK 107.8 million per MW, which is roughly USD 10 million to 11 million per MW at NOK 10.5 per dollar (Source: Statistics Norway, April 2026). Skygard’s NOK 2.4 billion first phase for a 40 MW program works out at about NOK 60 million per MW, lower because later phases reuse land and grid works (Source: DatacenterDynamics, March 2024).
Standards and Regulation: Which Rules Shape Oslo Data Centers?
Three Norwegian rules shape Oslo region data centers: registration with Nkom, the surplus heat analysis rule and the energy assessment duty.
Registration and security. The Regulations relating to data centres require operators to register with Nkom and to keep an appropriate level of security; the first deadline was 1 July 2025, and 104 data centers were registered by 20 March 2026, 26 of them internal to their owners (Source: Statistics Norway, April 2026).
Surplus heat. Data centers above 2 MW need an NVE-approved cost-benefit analysis of surplus heat use before they build or upgrade, in force from 1 April 2025 (Source: Government of Norway, October 2025).
Energy assessments. Companies that use more than 2.5 gigawatt hours (GWh) a year on average must carry out energy assessments, with the first due before 1 October 2026 (Source: Government of Norway, October 2025). Together these rules add design and reporting cost but favour efficient new builds over old server rooms, which supports replacement demand in the enterprise and public sector segment.
Market Segmentation: Which Segment Leads the Oslo Data Center Market?
Operations and maintenance services lead the Oslo Data Center Market by component with 28.89% of 2025 spend, while AI and GPU cloud halls grow fastest by type at 23.88% a year.
By Component: Operations and Maintenance Services Leads with 28.89%
Services lead because 175 MW was already running at the start of 2025; electrical infrastructure is close behind at 27.09% because grid connection, switchgear and UPS make up the largest share of every new MW.
| Segment | 2025 (USD million) | Share 2025 | 2035 (USD million) | CAGR 2025-2035 |
|---|---|---|---|---|
| Operations and Maintenance Services | 122.46 | 28.89% | 490.78 | 14.89% |
| Electrical Infrastructure | 114.85 | 27.09% | 217.49 | 6.59% |
| Building and Civil Works | 78.98 | 18.63% | 115.40 | 3.87% |
| Mechanical and Cooling Infrastructure | 71.44 | 16.85% | 148.69 | 7.61% |
| White Space and IT Infrastructure | 36.17 | 8.53% | 73.24 | 7.31% |
| Total | 423.90 | 100.00% | 1,045.59 | 9.45% |
By Data Center Type: Wholesale Colocation Leads with 36.37%
Wholesale colocation leads because most Oslo region campuses, from Enebakk to Holtskogen, are built for cloud and enterprise tenants who lease whole halls. Enterprise and public sector sites grow slowest at 2.48% a year as old server rooms move into colocation.
| Segment | 2025 (USD million) | Share 2025 | 2035 (USD million) | CAGR 2025-2035 |
|---|---|---|---|---|
| Wholesale Colocation | 154.17 | 36.37% | 354.87 | 8.69% |
| Enterprise and Public Sector | 93.81 | 22.13% | 119.83 | 2.48% |
| Hyperscale Cloud Self-Build | 81.86 | 19.31% | 178.59 | 8.11% |
| Retail Colocation and Interconnection | 60.11 | 14.18% | 103.20 | 5.55% |
| AI and GPU Cloud Halls | 33.95 | 8.01% | 289.11 | 23.88% |
| Total | 423.90 | 100.00% | 1,045.59 | 9.45% |
By End Use: Cloud and IT Services Leads with 34.66%
Cloud and IT service providers lead end use, and AI developers and research grow fastest at 12.23% a year.
| Segment | 2025 (USD million) | Share 2025 | 2035 (USD million) | CAGR 2025-2035 |
|---|---|---|---|---|
| Cloud and IT Services | 146.92 | 34.66% | 431.52 | 11.38% |
| Banking, Financial Services and Insurance (BFSI) | 73.08 | 17.24% | 144.81 | 7.08% |
| Public Sector and Defence | 69.82 | 16.47% | 156.63 | 8.42% |
| Telecom and Media | 55.62 | 13.12% | 101.63 | 6.21% |
| AI Developers and Research | 39.80 | 9.39% | 126.20 | 12.23% |
| Energy, Industry and Other | 38.66 | 9.12% | 84.80 | 8.17% |
| Total | 423.90 | 100.00% | 1,045.59 | 9.45% |
DC Exclusive: The Oslo Region Build Cost Model and Type x Component Matrix
The largest cell in 2025 is wholesale colocation operations and maintenance at USD 44.34 million. This matrix is a DC Market Insights model built from 14 inputs and tested against 3 bound checks.
The inputs are yearly new MW for 2020-2035, the AI share of new MW, conventional and AI cost per MW, service cost per operating MW, and the opening base of 85 MW at the end of 2019. Rows are data center types and columns are components, in USD million for 2025; each row and column sums to the totals in the segmentation tables.
| Type / Component | Electrical Infrastructure | Mechanical and Cooling Infrastructure | Building and Civil Works | White Space and IT Infrastructure | Operations and Maintenance Services | Total |
|---|---|---|---|---|---|---|
| Wholesale Colocation | 42.13 | 25.43 | 29.00 | 13.27 | 44.34 | 154.17 |
| Retail Colocation and Interconnection | 16.43 | 9.92 | 11.31 | 5.17 | 17.29 | 60.12 |
| Hyperscale Cloud Self-Build | 22.82 | 13.78 | 18.86 | 7.19 | 19.22 | 81.87 |
| Enterprise and Public Sector | 23.48 | 14.17 | 12.93 | 7.39 | 35.83 | 93.80 |
| AI and GPU Cloud Halls | 9.99 | 8.14 | 6.88 | 3.15 | 5.78 | 33.94 |
Regional Insights: Which Area Leads the Oslo Data Center Market?
Akershus leads the Oslo Data Center Market with 44.36% of 2025 spend. Hamar and Innlandet is the fastest growing region at 15.44% a year (DC Market Insights estimate).
Akershus Holds 44.36% Share
Akershus leads because Enebakk, Nittedal, Lillestrøm, Lørenskog and Vestby host most of the large colocation campuses within 40 km of Oslo. Spend grows at 8.81% a year to 2035.
Oslo Municipality Holds 28.79% Share
Oslo municipality holds the Oslo Internet Exchange, retail colocation and the Skygard Hovinbyen site. Its share falls because central grid capacity is scarce; spend grows at 6.62% a year.
Hamar and Innlandet Holds 12.63% Share
Hamar and Innlandet is the fastest growing region for the Oslo Data Center Market at 15.44% a year because the planned 90 MW Green Mountain campus in Hamar has grid power that central Oslo lacks.
Østfold Holds 8.17% Share
Østfold, around Fredrikstad, Sarpsborg and Halden, serves enterprise and disaster recovery sites on the route to Sweden and grows at 9.10% a year.
Buskerud Holds 6.05% Share
Buskerud, led by Drammen, hosts enterprise and edge sites west of Oslo and grows at 10.37% a year as smaller AI inference halls follow fiber routes.
Municipality Analysis: Which Municipalities Spend the Most on Oslo Data Centers?
Oslo municipality spends the most with 28.79% of 2025 spend, followed by Enebakk with 16.12%. Hamar grows fastest at 15.69% a year (DC Market Insights estimate).
| Rank | Municipality | Area | 2025 (USD million) | Share 2025 | 2035 (USD million) | CAGR 2025-2035 |
|---|---|---|---|---|---|---|
| 1 | Oslo | Oslo Municipality | 122.04 | 28.79% | 231.70 | 6.62% |
| 2 | Enebakk | Akershus | 68.33 | 16.12% | 134.57 | 7.01% |
| 3 | Hamar | Hamar and Innlandet | 46.80 | 11.04% | 201.07 | 15.69% |
| 4 | Lillestrøm | Akershus | 36.16 | 8.53% | 95.25 | 10.17% |
| 5 | Nittedal | Akershus | 26.15 | 6.17% | 73.40 | 10.87% |
| 6 | Fredrikstad | Østfold | 23.06 | 5.44% | 53.53 | 8.79% |
| 7 | Vestby | Akershus | 21.11 | 4.98% | 59.18 | 10.86% |
| 8 | Lørenskog | Akershus | 18.27 | 4.31% | 40.67 | 8.33% |
| 9 | Drammen | Buskerud | 16.49 | 3.89% | 44.02 | 10.32% |
| 10 | Other municipalities | All | 45.48 | 10.73% | 112.19 | 9.45% |
| Total | 423.90 | 100.00% | 1,045.59 | 9.45% |
Forecast Scenarios: What Could Change the 2035 Oslo Forecast?
The 2035 Oslo Data Center Market ranges from USD 907.48 million in the low case to USD 1.19 billion in the high case, around a base of USD 1.05 billion.
| Scenario | Assumption from 2026 | 2035 value | CAGR 2025-2035 |
|---|---|---|---|
| Low | New MW and AI share 15% below base because grid connections slip | USD 907.48 million | 7.91% |
| Base | About 38 MW added in 2026, peak of 58 MW in 2030, AI share 50% by 2030 | USD 1.05 billion | 9.45% |
| High | New MW and AI share 15% above base as Statnett clears the 6,833 MW queue reported by Statistics Norway in April 2026 faster | USD 1.19 billion | 10.83% |
Competitive Insights: Who Leads the Oslo Data Center Market?
Green Mountain leads the Oslo Data Center Market, and with STACK Infrastructure and Skygard holds about 38% of 2025 spend (DC Market Insights assessment). The operators that already hold grid allocations, the constraint the April 2026 Statistics Norway count exposed, keep this lead.
- Green Mountain
- STACK Infrastructure
- Skygard
- Bulk Infrastructure
- Digital Realty
- Microsoft
- Telenor
- Hafslund
- Basefarm
- Tietoevry
- Atea
- Schneider Electric
- ABB
- Vertiv
- Eaton
- Caverion
- Coromatic
Green Mountain holds about 18% through its Enebakk campus and the Hamar build, with an advantage in large single-tenant halls. STACK Infrastructure holds about 12% from its east Oslo campuses designed for low PUE. Skygard holds about 8% with a heat export model backed by Hafslund’s district heating network. Bulk Infrastructure leads interconnection at OS-IX, while equipment suppliers such as Schneider Electric, ABB, Vertiv and Eaton win the electrical and cooling orders across all operators.
Recent Developments
- In April 2026, Statistics Norway reported 794 MW of data center capacity in use and 6,833 MW in Statnett’s queue (Source: Statistics Norway).
- In March 2026, 104 data centers were registered with Nkom, including 26 internal sites (Source: Statistics Norway, April 2026).
- In February 2026, Statistics Norway reported that service industries paid 62.5 øre per kWh for electricity in 2025, up 13% (Source: Statistics Norway).
- In October 2025, the government’s data center strategy listed 2,691 MW reserved and 4,390 MW queued for data centers (Source: Government of Norway).
- In July 2025, 38 operators had registered 58 data centers with Nkom by the deadline (Source: Altinget).
- In May 2025, Bulk Infrastructure doubled its Oslo Internet Exchange facility to 14 MW (Source: DatacenterDynamics).
See all coverage on the industry page, and compare the Norway Data Center Colocation Market and the Norway Data Center Infrastructure Market.
Methodology: How We Built the Oslo Data Center Market Model
We built the Oslo Data Center Market model bottom up from yearly megawatt cohorts, cost per MW and service cost per operating MW.
The Oslo region started 2020 with about 85 MW of operating IT load and added 12 MW in 2020, rising to 30 MW in 2025, 58 MW in 2030 and 48 MW in 2035, for 715 MW of operating load by the end of 2035. Each year’s new MW is split into conventional and AI halls (AI share 20% in 2025, 50% in 2030, 60% in 2035) and multiplied by the cost per MW in the pricing table; the start-of-year operating base is multiplied by the service cost per MW. Splits by component, type, end use, area and municipality come from operator announcements, Nkom registration counts and the cost structure of public project budgets.
Three bound checks test the result. First, the Oslo region is 39.92% of the Norway Data Center Market in 2025 and 45.26% in 2035, below the 50% ceiling set by the share of Norwegian capacity in use near Oslo. Second, the 2025 construction spend of USD 301.44 million is below the ceiling implied by announced Oslo region project budgets. Third, as a floor, 205 MW of operating load x the lowest public service cost of about USD 0.5 million per MW gives at least USD 100 million of yearly service spend, which the model exceeds. Read more in our research methodology. The analyst named on this page built the model, and the reviewer checked the arithmetic, the sources and the dates before publication.
Table of contents
- 01Introduction
- 1.1Market Definition and Scope
- 1.2Research Methodology
- 1.3Key Market Statistics
- 02Executive Summary
- 2.1Oslo Data Center Market Size, 2020-2035
- 2.2Why Oslo Data Center Market Estimates Differ
- 03Market Dynamics
- 3.1Market Drivers
- 3.2Market Trends
- 3.3Market Challenges
- 3.4Market Opportunities
- 04Pricing and Regulation
- 4.1Build Cost per MW, 2020-2035
- 4.2Standards and Regulation in Norway
- 05Oslo Data Center Market, By Component
- 5.1Electrical Infrastructure
- 5.2Mechanical and Cooling Infrastructure
- 5.3Building and Civil Works
- 5.4White Space and IT Infrastructure
- 5.5Operations and Maintenance Services
- 06Oslo Data Center Market, By Data Center Type
- 6.1Wholesale Colocation
- 6.2Retail Colocation and Interconnection
- 6.3Hyperscale Cloud Self-Build
- 6.4Enterprise and Public Sector
- 6.5AI and GPU Cloud Halls
- 07Oslo Data Center Market, By End Use
- 7.1Cloud and IT Services
- 7.2Banking, Financial Services and Insurance
- 7.3Public Sector and Defence
- 7.4Telecom and Media
- 7.5Energy, Industry and Other
- 7.6AI Developers and Research
- 08DC Exclusive: Type x Component Matrix
- 09Oslo Data Center Market, By Area
- 9.1Akershus
- 9.2Oslo Municipality
- 9.3Hamar and Innlandet
- 9.4Østfold
- 9.5Buskerud
- 9.6Municipality Analysis
- 10Forecast Scenarios
- 11Competitive Landscape
- 11.1Company Shares and Advantages
- 11.2Recent Developments
- Fig. 1Oslo Data Center Market Size, 2020-2035
- Table 1Report Attributes
- Table 2Scope Comparison
- Table 3Build Cost per MW
- Table 4Segment Tables by Component, Type and End Use
- Table 5Type x Component Matrix
- Table 6Municipality Ranking
- Table 7Forecast Scenarios
About this report
Written by Amit Jain and reviewed by Deepti Agrawal, Senior Editor, Research. Figures are built top-down and bottom-up and reconciled before publication, with 2025 actual capacity, 2026 current year as the base year.
Read our methodologyHow we built this
- Historical period2020-2024
- Base year2025 actual capacity, 2026 current year
- Forecast period2026-2035
- Sizing approachTop-down + bottom-up
Need more than the report?
Advisory on this market
Due diligence, site selection and market entry work, by the analysts who wrote this report.
See consulting servicesFrequently asked questions
USD 538.93 million in 2026, up 27.14% from USD 423.90 million in 2025, according to DC Market Insights estimates. The market is projected to reach USD 1.05 billion by 2035, a CAGR of 9.45% from 2025 to 2035.
USD 423.90 million in 2025 and USD 1.05 billion by 2035 (DC Market Insights estimate). The market was USD 148.70 million in 2020.
USD 423.90 million of yearly spend in 2025 on building, fitting out and running data centers in Oslo, Akershus, Østfold, Buskerud and the Hamar area. Tenant servers, electricity bills and land are excluded.
9.45% a year from 2025 to 2035, down from 23.31% a year in 2020-2025, because the yearly build peaks at about 58 MW in 2030 and service spend on the operating base becomes the largest line (DC Market Insights estimate).
28.89% of 2025 spend goes to operations and maintenance services, the leading component, because 175 MW was already operating at the start of 2025. Electrical infrastructure follows with 27.09% (DC Market Insights estimate).
23.88% a year makes AI and GPU cloud halls the fastest growing segment, rising from 8.01% of 2025 spend to 27.65% of 2035 spend as liquid-ready halls for high-density racks spread (DC Market Insights estimate).
About USD 9.41 million per MW of IT load for a conventional hall and USD 12.60 million for an AI hall in 2025 (DC Market Insights estimate). Menon figures put the Enebakk campus at about NOK 118.5 million per MW.
44.36% of 2025 spend is in Akershus, the leading area, home to Enebakk, Nittedal and Vestby campuses. Hamar and Innlandet grows fastest at 15.44% a year because its campuses have grid power (DC Market Insights estimate).
About 38% of 2025 spend goes to the top three operators, led by Green Mountain at about 18%, then STACK Infrastructure and Skygard (DC Market Insights assessment). Bulk Infrastructure, Digital Realty, Microsoft and Telenor also compete.
794 MW was in use in April 2026, with 4,350 MW allocated and 6,833 MW in Statnett’s queue, according to Statistics Norway. The Oslo region had about 205 MW operating at the end of 2025 (DC Market Insights estimate).
28.79% of 2025 spend is in Oslo municipality, the largest, followed by Enebakk with 16.12%. Hamar grows fastest at 15.69% a year (DC Market Insights estimate).
Since 1 April 2025, data centers above 2 MW need an NVE-approved surplus heat analysis, and operators must register with Nkom; 104 data centers were registered by 20 March 2026, according to Statistics Norway.
Licences, delivery and payment
Which licence should I choose?
Single User is a view-only PDF for one person. Multi User adds a printable PDF and the Excel data for unlimited users at one location. Enterprise covers your whole company and includes 100 free analyst hours.
How and when will I receive the report?
By email, within 24–48 business hours of payment, in the formats of your licence.
How can I pay?
Securely through PayPal: with a PayPal account, a debit or credit card, or PayPal Pay Later where available. Prices are in US dollars.
Can I see a sample first?
Yes. Request a free sample and we will email it to you.
Can the report be tailored to my needs?
Yes. We can add countries, segments or data cuts. Talk to an analyst about the scope you need.
Can I get an invoice or pay against a purchase order?
Write to sales@dcmarketinsights.com and our team will help.