
Data Center Gas Turbine Market Size, Share & Forecast to 2035
Market at a glance
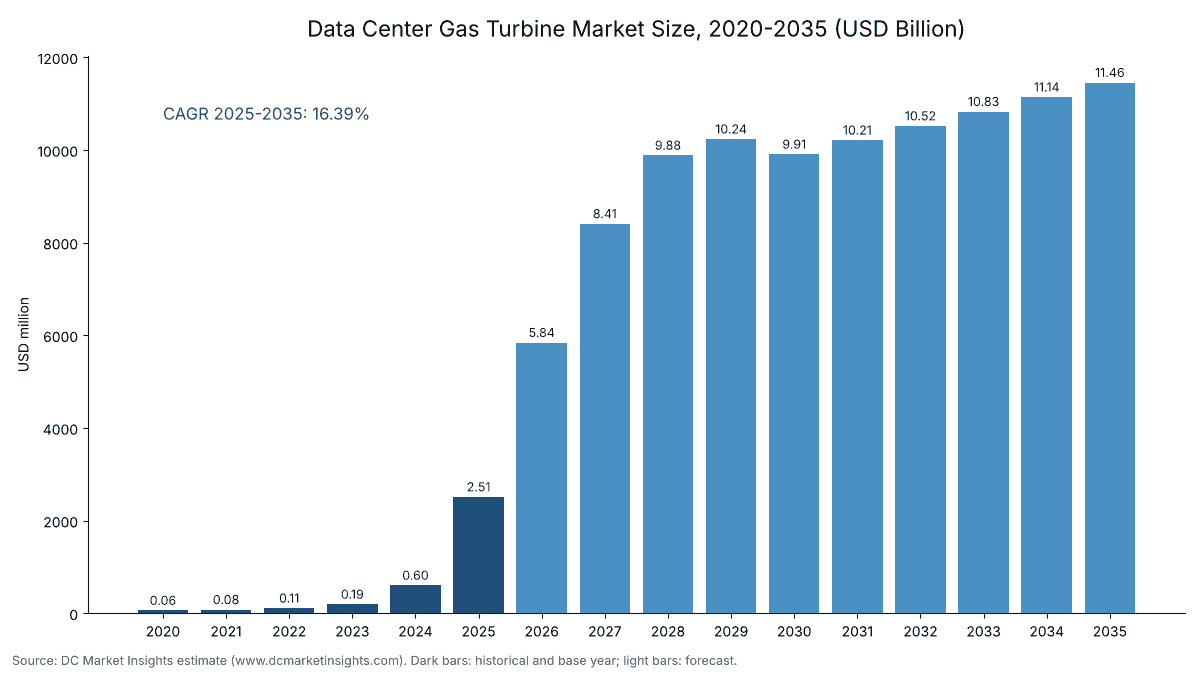
The Data Center Gas Turbine market was worth USD 2,510.0 million in 2025 and is forecast to reach USD 11.46 billion by 2035, growing at a 16.39% CAGR.
 By Amit Jain, Senior Consultant, ICT & Emerging Technologies
 Reviewed by Deepti Agrawal
Last updated 18 Oct 2026
Base year 2025 PDF + Excel
Reviewed by Deepti Agrawal
Last updated 18 Oct 2026
Base year 2025 PDF + Excel
Key findings
Aeroderivative Units Cost Twice as Much per kW as Frame Units
What is inside the report
- 01Introduction
- 02Research Methodology
- 03Executive Summary
- 04What Counts as a Data Center Gas Turbine?
- 05Why Do Data Center Gas Turbine Market Estimates Differ?
- 06Market Drivers
- 07Market Trends
- 08Market Restraints
- 09Market Opportunities
- 10Pricing Analysis: Data Center Gas Turbine Cost per kW
- 21chapters
- 2020-2024Historical period
- 2026-2035Forecast period
- —Companies profiled
Segmentation
Recent developments
the EPA final rule for stationary combustion turbines, 40 CFR 60 subpart KKKKa, took effect on 15 January (Source: Federal Register).
GE Vernova reported that Gas Power backlog and slot reservations grew from 62 GW to 83 GW in the fourth quarter of 2025 (Source: GE Vernova).
Boom Supersonic said Baker Hughes would supply generators for 1.21 GW of Superpower turbines for Crusoe (Source: Boom Supersonic).
the IEA said 15 to 27 GW of onsite natural gas may power data centres by 2030 (Source: IEA).
Mitsubishi Power announced two M501JAC units of about 1,150 MW for onsite power at a Wyoming data center (Source: Mitsubishi Power).
GE Vernova reported data center orders over USD 5 billion in the first half (Source: GE Vernova).
the EPA issued permitting guidance for islanded power generation facilities (Source: EPA).
Siemens Energy reported record Gas Services orders that included large data center orders (Source: Siemens Energy).
Williams said the first phase of its Socrates power project was completed within budget and on time (Source: Williams).
Full analysis
The Data Center Gas Turbine Market is valued at USD 5.84 billion in 2026 and is projected to reach USD 11.46 billion by 2035, up from USD 2.51 billion in 2025, a compound annual growth rate (CAGR) of 16.39% from 2025 to 2035 (DC Market Insights estimate). The money in this market is moved by the wait for a grid connection: an artificial intelligence (AI) campus that can energise in 2027 on its own turbines earns revenue years before a utility line arrives, so developers now buy power plants as part of the data center. The International Energy Agency (IEA) said in April 2026 that around 15 to 27 gigawatts (GW) of onsite natural gas may power data centres by 2030, mostly in the United States (US), and GE Vernova reported data center orders above USD 5 billion in the first half of 2026 alone, more than double its 2025 total. DC Market Insights therefore expects gas turbine capacity commissioned at data centers to rise from 1,300 megawatts (MW) in 2025 to 4,700 MW in 2035, at an installed price of USD 1,900 per kilowatt (kW) in 2025. Heavy-duty frame turbines are the fastest-growing turbine type at 21.99% a year, and Latin America is the fastest-growing region at 36.71% a year from a small base.
Key Market Statistics: How Big Is the Data Center Gas Turbine Market in 2026?
DC Market Insights values the Data Center Gas Turbine Market at USD 5.84 billion in 2026, 132.6% above 2025, as turbines ordered in 2024 and 2025 for off-grid AI campuses reach commissioning.
- Market size 2025: USD 2.51 billion
- Market size 2026: USD 5.84 billion
- Market size 2030: USD 9.91 billion
- Market size 2035: USD 11.46 billion
- CAGR 2025-2035: 16.39% in the base case, 12.70% in the low case and 18.96% in the high case
- Gas turbine capacity commissioned at data centers: 1,300 MW in 2025, 4,200 MW in 2030 and 4,700 MW in 2035
- Largest turbine type: aeroderivative gas turbines, 48.0% of 2025 value (USD 1.21 billion)
- Fastest-growing turbine type: heavy-duty frame gas turbines, 21.99% a year
- Leading region: North America, 88.0% of 2025 value (USD 2.21 billion)
- Fastest-growing region: Latin America, 36.71% a year
- Largest country: the United States, USD 2.14 billion in 2025 (85.0% of global value)
- Market leader: GE Vernova, about 36% of 2025 value (DC Market Insights assessment)
Executive Summary
The Global Data Center Gas Turbine Market size was valued at USD 60.50 million in 2020, reached USD 2.51 billion in 2025, and is anticipated to reach USD 11.46 billion by 2035, at a CAGR of 16.39% during the forecast period.
| Report attribute | Details |
|---|---|
| Historical Period | 2020-2024 |
| Base Year | 2025 |
| Forecast Period | 2026-2035 |
| Data Center Gas Turbine Market Size 2025 | USD 2.51 Billion |
| Data Center Gas Turbine Market Size 2026 | USD 5.84 Billion |
| Data Center Gas Turbine Market, CAGR | 16.39% |
| Data Center Gas Turbine Market Size 2035 | USD 11.46 Billion |
Data center gas turbine spending grew 110.69% a year from 2020 to 2025, because capacity commissioned at data centers went from 40 MW, mostly standby and combined heat and power units, to 1,300 MW of prime and bridge power for AI campuses. Growth of 16.39% a year to 2035 rests on three numbers in the model: commissioned capacity rises to 4,700 MW a year, the installed price peaks at USD 2,200 per kW in 2028 while factory slots stay scarce, and long-term service on a fleet that grows from 2,230 MW at the end of 2025 to 44,230 MW in 2035 lifts service from 1.7% to 17.9% of the market. Value flattens between 2028 and 2030, between USD 9.88 billion and USD 10.24 billion, as grid connections catch up in the US, and then grows again as the Gulf states, India and Latin America add onsite plants.
Key Takeaways
- The market more than quadruples, to USD 11.46 billion by 2035, because time to power, not land or fibre, now decides when an AI campus earns revenue.
- Heavy-duty frame turbines rise from 30.0% to 48.0% of value, because campuses above 1 GW buy utility-class units such as the 1,150 MW Mitsubishi Power order for a Wyoming data center.
- Bridge power falls from 35.0% to 20.0% of value, because turbines bought to wait for the grid become permanent prime or backup plants once the connection arrives.
- Long-term service grows 47.61% a year, because every turbine shipped after 2024 carries a maintenance contract for 20 years or more.
- GE Vernova holds about 36% of 2025 value, because its aeroderivative fleet ships in weeks rather than years and its Crusoe order alone adds nearly 1 GW.
What Counts as a Data Center Gas Turbine, and What Does This Market Include?
A data center gas turbine is a combustion turbine generator that supplies electricity to one data center campus, and DC Market Insights values these units with their installation and service at USD 2.51 billion in 2025.
Included. Aeroderivative gas turbines (for example GE Vernova LM2500XPRESS and LM6000, Mitsubishi Power FT8, Boom Supersonic Superpower), heavy-duty frame gas turbines and industrial and small gas turbines (for example Solar Turbines Titan and Baker Hughes NovaLT) sold for prime power at off-grid or islanded campuses, bridge power until a grid connection, and dedicated plants co-located with or contracted to one data center; generator sets, enclosures, controls and emissions equipment supplied with the turbine; engineering, procurement and construction (EPC) and installation; and long-term service agreements (LTSAs).
Excluded. Reciprocating gas engines and diesel standby generators (covered in the Data Center Generator Market), fuel cells (covered in the Data Center Fuel Cell Market), batteries, utility gas plants that serve the wider grid, gas pipelines and fuel, and electricity sold under power purchase agreements.
How the segments fit together. Every segment table splits the same USD 2.51 billion of 2025 value: by turbine type, by application, by plant configuration and by offering, plus five regions and 12 countries. Each split sums to the total in every year from 2020 to 2035.
Why Do Data Center Gas Turbine Market Estimates Differ?
Public estimates for data center gas power differ because some count every turbine bought by a utility that serves data center load, while DC Market Insights counts USD 5.84 billion of 2026 spending on turbines tied to one campus.
Broader definitions add three things. First, utility combined-cycle plants built for general load growth, even when data centers are the main reason for the new demand; Mitsubishi Heavy Industries said in its October 2025 investor briefing that its US gas turbine contracts are with power companies, not directly with data centers. Second, reciprocating engines, which compete with turbines on many onsite projects, such as the 2 GW of Caterpillar gas generator sets ordered by American Intelligence and Power for its Monarch campus in January 2026. Third, fuel, pipelines and electricity revenue over the life of the plant. Including all three would multiply the figure several times, but it would no longer measure what a data center operator spends on turbines.
| Element | In this market? | Why |
|---|---|---|
| Onsite prime and bridge power turbines | Yes (USD 2.01 billion in 2025) | Bought for one campus |
| Dedicated co-located plants | Yes (USD 502.37 million in 2025) | Contracted to one campus |
| Utility plants for general load | No | Serve the wider grid |
| Reciprocating gas engines | No | Covered in the generator market |
| Fuel and electricity sales | No | Operating cost, not equipment |
Buyers inside the scope include hyperscale cloud operators, AI cloud developers, colocation providers and independent power producers (IPPs) that sell electricity only to one campus. Utility gas plants, reciprocating engines, fuel supply and power purchase agreements stay outside the scope in every table.
Why Are Data Centers Buying Their Own Gas Turbines?
Data centers buy turbines because grid connections for loads above 100 MW now take years, and DC Market Insights expects 19,500 MW of turbine capacity to be commissioned at data centers from 2026 to 2030 as a result.
Grid Rules for Large Loads Push Campuses Toward Their Own Plants
Power rules written in 2025 made onsite generation a planning default. Texas Senate Bill 6 set a 75 MW threshold for large loads and lets the Electric Reliability Council of Texas (ERCOT) direct them to run onsite backup generation or curtail during emergencies, according to the official Senate bill analysis of August 2025. In December 2025 the Federal Energy Regulatory Commission (FERC) found the co-location tariff of PJM Interconnection unjust and unreasonable and proposed two new transmission services for co-located loads. Executive Order 14318 of July 2025 lists natural gas turbines among the covered components of data center projects that need more than 100 MW of new load. DC Market Insights links prime and bridge power, 80.0% of 2025 value or USD 2.01 billion, to these grid limits.
Turbine Factory Slots Are Reserved Years Ahead
GE Vernova signed 20 GW of new gas equipment contracts in the second quarter of 2026, including 18 GW of slot reservation agreements, and lifted its backlog from 44 GW to 53 GW and its slot reservations from 56 GW to 63 GW, according to its earnings release of 22 July 2026. The company said data center orders reached over USD 5 billion year to date, more than double its 2025 total, and expects at least 125 GW under contract by the end of 2026. Because slots are booked through 2029, DC Market Insights models the installed price rising from USD 1,900 per kW in 2025 to a peak of USD 2,200 per kW in 2028.
Onsite Gas Becomes Part of the Official Power Outlook
The IEA said in April 2025 that natural gas expands by 175 terawatt-hours (TWh) to meet data centre demand by 2030, notably in the US, where gas already supplies over 40% of data centre electricity. Its April 2026 update put data centre use at 485 TWh in 2025 rising to 950 TWh in 2030, said around 15 to 27 GW of onsite natural gas may power data centres by 2030, and noted a 70% surge in gas turbine orders in 2025. The US Department of Energy (DOE) launched its Speed to Power initiative in September 2025 to gather multi-gigawatt generation projects. DC Market Insights places 21,730 MW of turbines at data centers by the end of 2030.
How Are Data Center Gas Turbine Projects Changing?
Data center gas turbine projects are getting larger and more permanent, and dedicated co-located plants rise from 20.0% of value in 2025 to 40.0% in 2035 in the DC Market Insights model.
Aviation Engines Repurposed as 35 to 42 MW Power Blocks
Aeroderivative turbines start in about five minutes and ship as trailer-sized packages. GE Vernova and Crusoe announced 29 LM2500XPRESS units of about 35 MW each in July 2025, expected to provide nearly 1 GW for AI data centers, and Crusoe described turbines installed onsite at its Abilene campus in August 2025. In February 2026 Boom Supersonic announced that Baker Hughes would supply 25 generators for its 42 MW Superpower turbines, 1.21 GW in total for its anchor customer Crusoe. Aeroderivative turbines hold 48.0% of 2025 value, or USD 1.21 billion.
Utility-Class Frame Turbines Move Inside the Campus Fence
Mitsubishi Power said in May 2026 that its first two M501JAC units, about 1,150 MW, will deliver dedicated on-site power to a large data center in the Switchgrass Industrial Park near Cheyenne, Wyoming, for Tallgrass. A single order of that size equals 88% of all turbine capacity commissioned at data centers in 2025. Heavy-duty frame turbines grow from USD 753.55 million in 2025 to USD 5.50 billion in 2035, and combined cycle plants rise from 22.0% to 45.0% of value as campuses add steam turbines to cut fuel use.
Islanded Plants Gain a Clearer Permitting Path
The US Environmental Protection Agency (EPA) issued guidance on 27 July 2026 that expands opportunities to develop and operate islanded power generation facilities, which sell no electricity to the grid and fall outside the Acid Rain Program. Its Clean Air Act resources page for data centers, updated in October 2026, says state and local agencies issue most data center air permits. DC Market Insights assigns 45.0% of 2025 value, USD 1.13 billion, to prime power for off-grid and islanded campuses.
Market Restraints: What Slows Data Center Gas Turbine Spending?
Turbine prices, lead times and emissions rules restrain the market, and the DC Market Insights low case of USD 8.30 billion in 2035 shows what 25% fewer commissioned MW and 5% lower prices would mean.
Aeroderivative Units Cost Twice as Much per kW as Frame Units
The US Energy Information Administration (EIA) put the overnight cost of an aeroderivative combustion turbine at USD 2,275 per kW and of an industrial frame unit at USD 1,158 per kW in 2025 dollars in its Annual Energy Outlook 2026 assumptions. A campus that overbuilds onsite generation by 30% to 70% relative to demand, the range the IEA gave in April 2026 for reliable islanded supply, pays USD 2.47 million to USD 3.23 million of turbine plant per MW of IT load at the 2025 model price of USD 1,900 per kW.
Emissions Limits Tighten on New Turbines
The EPA final rule creating 40 Code of Federal Regulations (CFR) part 60 subpart KKKKa took effect on 15 January 2026 for turbines that began construction after 13 December 2024, with nitrogen oxide (NOx) limits as low as 5 parts per million for large high-use units with selective catalytic reduction. In the European Union (EU), according to the directive texts, combustion installations above 20 MW of thermal input fall under the EU Emissions Trading System, and plants from 1 MW to 50 MW under the Medium Combustion Plant Directive (EU) 2015/2193. These rules add emissions control cost and keep Europe at 2.0% of 2025 value.
Where Are the Openings for Data Center Gas Turbine Suppliers?
The largest openings are service on a fleet of 44,230 MW by 2035 and the conversion of bridge plants into permanent assets, worth USD 2.06 billion and USD 5.16 billion of 2035 value respectively in the DC Market Insights model.
Service Contracts on a Fleet Twenty Times Larger
Long-term service agreements grow from USD 41.85 million in 2025 to USD 2.06 billion in 2035, priced at USD 45 per kW a year in 2025 and USD 52 per kW a year in 2035 on the prior-year fleet. Data center turbines run far more hours than utility peakers, so hot-gas-path inspections and overhauls come sooner and service revenue builds with each year of operation.
Turning Bridge Units into Combined Cycle and Hydrogen-Ready Plants
Combined cycle plants reach USD 5.16 billion in 2035, up from USD 552.61 million in 2025, as campuses add heat recovery steam generators to simple cycle units bought for speed. GE Vernova says its LM6000 is 100% hydrogen capable, which gives buyers facing future carbon rules a path to lower-carbon fuel without replacing the turbine.
How Much Does a Data Center Gas Turbine Cost per kW?
A data center gas turbine plant costs about USD 1,900 per kW installed in 2025 in the DC Market Insights model, 70% for the turbine package and 30% for EPC and installation.
| Year | Installed price (USD per kW) | Long-term service (USD per kW-year) | Capacity commissioned (MW) |
|---|---|---|---|
| 2020 | 1,250 | 35 | 40 |
| 2025 | 1,900 | 45 | 1,300 |
| 2030 | 2,150 | 50 | 4,200 |
| 2035 | 2,000 | 52 | 4,700 |
Public anchors support the range. The EIA assumption of USD 2,275 per kW for an aeroderivative turbine and USD 1,158 per kW for a frame turbine in 2025 dollars brackets the model price, which blends 48% aeroderivative, 30% heavy-duty frame and 22% industrial units in 2025. The 2028 peak of USD 2,200 per kW reflects scarce factory slots; GE Vernova said it remains on track for 20 GW of annual gas turbine output in the third quarter of 2026, and the price eases to USD 2,000 per kW by 2035 as that capacity meets demand.
Which Rules and Standards Apply to Data Center Gas Turbines?
Five rules shape USD 2.51 billion of 2025 spending, from US air permits to EU emissions trading.
- EPA New Source Performance Standards (NSPS), 40 CFR 60 subpart KKKKa: effective 15 January 2026, NOx limits for new stationary combustion turbines (Federal Register, 15 January 2026).
- Executive Order 14318: July 2025, accelerates federal permitting for data center projects above 100 MW and names natural gas turbines as covered components.
- Texas Senate Bill 6: 2025, 75 MW large-load threshold and ERCOT authority to direct onsite backup generation, according to the official Senate bill analysis.
- Ireland CRU connection policy: the Commission for Regulation of Utilities proposed in February 2025 that new data centres provide generation or storage matching their requested demand.
- EU Emissions Trading System Directive 2003/87/EC and Medium Combustion Plant Directive (EU) 2015/2193: carbon allowances above 20 MW of thermal input, and emission limits for plants from 1 MW to 50 MW.
Which Turbine Type and Application Lead Data Center Spending?
Aeroderivative gas turbines lead with 48.0% of 2025 value, and prime power for off-grid and islanded campuses leads applications with 45.0%, according to DC Market Insights.
By Turbine Type: Aeroderivative Gas Turbines Lead with 48.0%
| Turbine type | 2025 (USD million) | Share 2025 | 2035 (USD million) | CAGR 2025-2035 |
|---|---|---|---|---|
| Aeroderivative Gas Turbines | 1,205.69 | 48.0% | 3,894.89 | 12.44% |
| Heavy-Duty Frame Gas Turbines | 753.55 | 30.0% | 5,498.67 | 21.99% |
| Industrial and Small Gas Turbines | 552.61 | 22.0% | 2,062.00 | 14.07% |
| Total | 2,511.85 | 100.0% | 11,455.56 | 16.39% |
By Application: Prime Power Leads with 45.0%
| Application | 2025 (USD million) | Share 2025 | 2035 (USD million) | CAGR 2025-2035 |
|---|---|---|---|---|
| Prime Power for Off-Grid and Islanded Campuses | 1,130.33 | 45.0% | 4,582.23 | 15.02% |
| Bridge Power Until Grid Connection | 879.15 | 35.0% | 2,291.11 | 10.05% |
| Dedicated Co-Located Plants | 502.37 | 20.0% | 4,582.22 | 24.74% |
| Total | 2,511.85 | 100.0% | 11,455.56 | 16.39% |
By Plant Configuration: Simple Cycle Leads with 78.0%
| Plant configuration | 2025 (USD million) | Share 2025 | 2035 (USD million) | CAGR 2025-2035 |
|---|---|---|---|---|
| Simple Cycle | 1,959.24 | 78.0% | 6,300.56 | 12.39% |
| Combined Cycle | 552.61 | 22.0% | 5,155.00 | 25.02% |
| Total | 2,511.85 | 100.0% | 11,455.56 | 16.39% |
By Offering: Turbine Equipment Leads with 68.8%
| Offering | 2025 (USD million) | Share 2025 | 2035 (USD million) | CAGR 2025-2035 |
|---|---|---|---|---|
| Turbine Equipment | 1,729.00 | 68.8% | 6,580.00 | 14.30% |
| EPC and Installation | 741.00 | 29.5% | 2,820.00 | 14.30% |
| Long-Term Service Agreements | 41.85 | 1.7% | 2,055.56 | 47.61% |
| Total | 2,511.85 | 100.0% | 11,455.56 | 16.39% |
DC Exclusive: Onsite Gas Turbine Deal Tracker — 5 Named Turbine Deals, 3.88 GW
DC Market Insights built this tracker from 12 inputs taken from company and investor releases; it counts 3,877 MW of named gas turbine deals for data centers, worth about USD 8.34 billion at the modelled 2027 installed price of USD 2,150 per kW (a DC Market Insights estimate).
| Buyer or project | Supplier and turbine | Units | MW | Announced |
|---|---|---|---|---|
| Crusoe AI data centers | GE Vernova LM2500XPRESS | 29 | About 1,000 | July 2025 |
| Crusoe via Boom Supersonic | Superpower turbines, Baker Hughes generators | 25 generators | 1,210 | February 2026 |
| Tallgrass, Cheyenne campus | Mitsubishi Power M501JAC | 2 | About 1,150 | May 2026 |
| Frontier, Wyoming and Texas | Baker Hughes NovaLT | 16 | Up to 270 | May 2025 |
| xAI, Memphis | Permitted gas turbines | 15 | Up to 247 | July 2025 |
| Total | 3,877 |
Three large gas projects are left out of the 3,877 MW total on purpose. The 2 GW Monarch order uses Caterpillar reciprocating generator sets. Williams lists 400 MW across its two Socrates sites in Ohio without naming the generation technology. Entergy Louisiana’s three combined cycle plants for Meta’s Hyperion campus have no published MW figure. The named turbine deals equal 49% of the 7,900 MW the model commissions from 2025 to 2027, so the forecast needs only about the same volume again from deals that are not yet public.
Which Region Spends the Most on Data Center Gas Turbines?
North America leads with 88.0% of 2025 value, or USD 2.21 billion, and Latin America is the fastest-growing region at 36.71% a year.
North America Leads with 88.0% Share
North American spending rises from USD 2.21 billion in 2025 to USD 7.10 billion in 2035, a CAGR of 12.38%. Lawrence Berkeley National Laboratory found for the DOE in December 2024 that data centers used 4.4% of US electricity in 2023 and could use 6.7% to 12% by 2028, which is the gap that onsite turbines fill.
Middle East and Africa Holds 6.0% Share
Middle East and Africa grows from USD 150.71 million to USD 2.06 billion, 29.90% a year, as Saudi Arabia and the United Arab Emirates (UAE) pair AI campuses with low-cost associated gas.
Asia Pacific Holds 3.0% Share
Asia Pacific grows from USD 75.36 million to USD 1.15 billion, 31.28% a year, led by Malaysia, Japan and India in the DC Market Insights country allocation, where AI campus pipelines outpace new transmission.
Europe Holds 2.0% Share
Europe grows from USD 50.24 million to USD 572.78 million, 27.55% a year; Ireland leads because its regulator wants new data centres to bring generation matching their demand.
Latin America Is the Fastest-Growing Region at 36.71%
Latin America grows from USD 25.12 million to USD 572.78 million, as Mexico and Brazil use gas turbines where transmission to new campuses lags.
Which Countries Buy the Most Data Center Gas Turbines?
The United States buys USD 2.14 billion of data center gas turbines in 2025, 85.0% of the global total, and India is the fastest-growing large country at 36.71% a year.
| Rank | Country | 2025 (USD million) | 2035 (USD million) | CAGR 2025-2035 | Region |
|---|---|---|---|---|---|
| 1 | United States | 2,135.07 | 6,644.22 | 12.02% | North America |
| 2 | Canada | 75.36 | 458.22 | 19.78% | North America |
| 3 | Saudi Arabia | 75.36 | 916.44 | 28.38% | Middle East and Africa |
| 4 | United Arab Emirates | 62.80 | 687.33 | 27.03% | Middle East and Africa |
| 5 | Ireland | 30.14 | 286.39 | 25.25% | Europe |
| 6 | Malaysia | 20.09 | 229.11 | 27.56% | Asia Pacific |
| 7 | Japan | 15.07 | 229.11 | 31.28% | Asia Pacific |
| 8 | Mexico | 15.07 | 286.39 | 34.24% | Latin America |
| 9 | India | 12.56 | 286.39 | 36.71% | Asia Pacific |
| 10 | United Kingdom | 10.05 | 137.47 | 29.90% | Europe |
| 11 | Australia | 10.05 | 171.83 | 32.83% | Asia Pacific |
| 12 | Brazil | 7.54 | 171.83 | 36.70% | Latin America |
The United States stays the largest buyer through 2035, but its share falls from 85.0% to 58.0% as grid connections catch up. India, at 36.71% a year, is the fastest-growing large country because its AI campus pipeline grows from a very small onsite turbine base of USD 12.56 million in 2025 (DC Market Insights allocation).
How Could the 2035 Data Center Gas Turbine Forecast Change?
The 2035 market ranges from USD 8.30 billion to USD 14.26 billion around the USD 11.46 billion base case, depending on how many MW are commissioned after 2026 and at what price.
| Scenario | 2035 (USD million) | CAGR 2025-2035 | Assumption from 2027 |
|---|---|---|---|
| Low | 8,304.56 | 12.70% | Commissioned MW 25% lower, price 5% lower |
| Base | 11,455.56 | 16.39% | Model as described |
| High | 14,258.36 | 18.96% | Commissioned MW 20% higher, price 5% higher |
The low case follows faster grid connections under the new FERC and Texas rules; the high case follows wider use of islanded plants under the July 2026 EPA guidance.
Who Are the Leading Data Center Gas Turbine Companies?
GE Vernova leads with about 36% of 2025 value, and the top five suppliers hold about 76% (DC Market Insights assessment based on named data center deals and disclosed orders).
- GE Vernova
- Siemens Energy
- Mitsubishi Power
- Solar Turbines (Caterpillar)
- Baker Hughes
- Ansaldo Energia
- Kawasaki Heavy Industries
- Doosan Enerbility
- Everllence
- Boom Supersonic
- ProEnergy
- Harbin Electric
- Dongfang Electric
- Capstone Green Energy
The concentration estimate of about 76% for GE Vernova (about 36%), Siemens Energy (about 14%), Mitsubishi Power (about 10%), Solar Turbines (about 9%) and Baker Hughes (about 7%) reflects their share of named data center turbine deals. Siemens Energy reported record Gas Services orders of EUR 9.97 billion in its third fiscal quarter of 2026, up 61.9% on a comparable basis and including large orders related to data centers, and it named datacenters as a demand driver when it reported a record EUR 138 billion backlog for fiscal 2025. Caterpillar said in August 2026 that Power Generation sales rose 29% to USD 3.10 billion in the second quarter, with turbines and turbine-related services growing primarily in data center applications. Mitsubishi Heavy Industries concluded contracts for 31 large frame gas turbines in the first three quarters of its fiscal 2025, up 15 units on the year.
Recent Developments
Nine dated events from 2026 show turbine orders, rules and project announcements moving together.
- In January 2026, the EPA final rule for stationary combustion turbines, 40 CFR 60 subpart KKKKa, took effect on 15 January (Source: Federal Register).
- In January 2026, GE Vernova reported that Gas Power backlog and slot reservations grew from 62 GW to 83 GW in the fourth quarter of 2025 (Source: GE Vernova).
- In February 2026, Boom Supersonic said Baker Hughes would supply generators for 1.21 GW of Superpower turbines for Crusoe (Source: Boom Supersonic).
- In April 2026, the IEA said 15 to 27 GW of onsite natural gas may power data centres by 2030 (Source: IEA).
- In May 2026, Mitsubishi Power announced two M501JAC units of about 1,150 MW for onsite power at a Wyoming data center (Source: Mitsubishi Power).
- In July 2026, GE Vernova reported data center orders over USD 5 billion in the first half (Source: GE Vernova).
- In July 2026, the EPA issued permitting guidance for islanded power generation facilities (Source: EPA).
- In August 2026, Siemens Energy reported record Gas Services orders that included large data center orders (Source: Siemens Energy).
- In August 2026, Williams said the first phase of its Socrates power project was completed within budget and on time (Source: Williams).
Methodology: How DC Market Insights Sizes the Data Center Gas Turbine Market
DC Market Insights sizes the market bottom-up as turbine MW commissioned at data centers times installed price per kW, plus service per kW-year on the existing fleet, which gives USD 2.51 billion in 2025.
The model in numbers: commissioned capacity of 40 MW (2020), 1,300 MW (2025), 2,800 MW (2026), 4,200 MW (2030) and 4,700 MW (2035); installed price of USD 1,250, USD 1,900, USD 2,050, USD 2,150 and USD 2,000 per kW in the same years, split 70% turbine equipment and 30% EPC and installation; service at USD 35 per kW-year in 2020, USD 45 in 2025, USD 50 in 2030 and USD 52 in 2035 on the prior-year fleet, which starts at 300 MW at the end of 2019 and reaches 2,230 MW in 2025, 21,730 MW in 2030 and 44,230 MW in 2035. Segment, regional and country shares are DC Market Insights allocations that sum to the total in every year.
Three bound checks test the result. Ceiling one: the fleet of 21,730 MW at the end of 2030 includes about 14 GW of onsite prime and bridge turbines, below the low end of the IEA range of 15 to 27 GW of onsite gas by 2030, which also counts reciprocating engines. Ceiling two: the peak of 4,700 MW commissioned in 2035 equals 23.5% of the 20 GW of annual gas turbine output GE Vernova alone plans. Floor: the 3,877 MW of named turbine deals in the DC Exclusive tracker equals 49% of the 7,900 MW commissioned from 2025 to 2027. The full approach is described on the DC Market Insights research methodology page; the wider spending context is in the Data Center Market and Data Center Energy Storage Market reports.
Table of contents
- 01Introduction
- 1.1Market Definition
- 1.2Historical Period, Base Year and Forecast Period
- 1.3Report Attributes
- 02Research Methodology
- 2.1The Commissioned-MW Model in Numbers
- 2.2Bound Checks: IEA Onsite Gas Ceiling, GE Vernova Output Ceiling and Named-Deal Floor
- 03Executive Summary
- 3.1Market Snapshot, 2025, 2026 and 2035
- 3.2Key Market Statistics
- 3.3Key Takeaways
- 04What Counts as a Data Center Gas Turbine?
- 4.1Included: Aeroderivative, Frame and Industrial Turbines, EPC and Service
- 4.2Excluded: Reciprocating Engines, Fuel Cells, Utility Plants and Fuel
- 4.3How the Segments Fit Together
- 05Why Do Data Center Gas Turbine Market Estimates Differ?
- 5.1Utility Plants, Engines and Fuel in Broader Definitions
- 5.2Scope Comparison: What Is In and Out
- 5.3Buyers Inside the Scope
- 06Market Drivers
- 6.1Grid Rules for Large Loads Push Campuses Toward Their Own Plants
- 6.2Turbine Factory Slots Are Reserved Years Ahead
- 6.3Onsite Gas Becomes Part of the Official Power Outlook
- 07Market Trends
- 7.1Aviation Engines Repurposed as 35 to 42 MW Power Blocks
- 7.2Utility-Class Frame Turbines Move Inside the Campus Fence
- 7.3Islanded Plants Gain a Clearer Permitting Path
- 08Market Restraints
- 8.1Aeroderivative Units Cost Twice as Much per kW as Frame Units
- 8.2Emissions Limits Tighten on New Turbines
- 09Market Opportunities
- 9.1Service Contracts on a Fleet Twenty Times Larger
- 9.2Turning Bridge Units into Combined Cycle and Hydrogen-Ready Plants
- 10Pricing Analysis: Data Center Gas Turbine Cost per kW
- 10.1Installed Price and Service Price, 2020-2035
- 10.2Public Anchors: EIA Combustion Turbine Costs
- 11Standards and Regulation
- 11.1EPA NSPS 40 CFR 60 Subpart KKKKa
- 11.2Executive Order 14318
- 11.3Texas Senate Bill 6
- 11.4Ireland CRU Connection Policy
- 11.5EU Emissions Trading System and Medium Combustion Plant Directive
- 12Data Center Gas Turbine Market, By Turbine Type
- 12.1Aeroderivative Gas Turbines
- 12.2Heavy-Duty Frame Gas Turbines
- 12.3Industrial and Small Gas Turbines
- 13Data Center Gas Turbine Market, By Application
- 13.1Prime Power for Off-Grid and Islanded Campuses
- 13.2Bridge Power Until Grid Connection
- 13.3Dedicated Co-Located Plants
- 14Data Center Gas Turbine Market, By Plant Configuration
- 14.1Simple Cycle
- 14.2Combined Cycle
- 15Data Center Gas Turbine Market, By Offering
- 15.1Turbine Equipment
- 15.2EPC and Installation
- 15.3Long-Term Service Agreements
- 16DC Exclusive: Onsite Gas Turbine Deal Tracker
- 16.1Five Named Turbine Deals, 3,877 MW
- 16.2Projects Left Out and Why
- 17Regional Insights
- 17.1North America
- 17.2Middle East and Africa
- 17.3Asia Pacific
- 17.4Europe
- 17.5Latin America
- 18Country Analysis
- 18.1United States
- 18.2Canada
- 18.3Saudi Arabia
- 18.4United Arab Emirates
- 18.5Ireland
- 18.6Malaysia
- 18.7Japan
- 18.8Mexico
- 18.9India
- 18.10United Kingdom
- 18.11Australia
- 18.12Brazil
- 19Forecast Scenarios, 2035
- 19.1Low Case
- 19.2Base Case
- 19.3High Case
- 20Competitive Insights
- 20.1GE Vernova
- 20.2Siemens Energy
- 20.3Mitsubishi Power
- 20.4Solar Turbines (Caterpillar)
- 20.5Baker Hughes
- 20.6Ansaldo Energia
- 20.7Kawasaki Heavy Industries
- 20.8Doosan Enerbility
- 20.9Everllence
- 20.10Boom Supersonic
- 20.11ProEnergy
- 20.12Harbin Electric
- 20.13Dongfang Electric
- 20.14Capstone Green Energy
- 21Recent Developments
- 21.1Dated Events, January to August 2026
- Fig. 1Data Center Gas Turbine Market Size, 2020-2035 (USD Million)
- Table 1Report Attributes
- Table 2Scope Comparison
- Table 3Installed Price, Service Price and Capacity Commissioned, 2020-2035
- Table 4Market by Turbine Type, 2025 and 2035
- Table 5Market by Application, 2025 and 2035
- Table 6Market by Plant Configuration, 2025 and 2035
- Table 7Market by Offering, 2025 and 2035
- Table 8Onsite Gas Turbine Deal Tracker
- Table 9Top 12 Countries, 2025 and 2035
- Table 10Forecast Scenarios, 2035
About this report
Written by Amit Jain and reviewed by Deepti Agrawal, Senior Editor, Research. Figures are built top-down and bottom-up and reconciled before publication, with 2025 as the base year.
Read our methodologyHow we built this
- Historical period2020-2024
- Base year2025
- Forecast period2026-2035
- Sizing approachTop-down + bottom-up
Need more than the report?
Advisory on this market
Due diligence, site selection and market entry work, by the analysts who wrote this report.
See consulting servicesFrequently asked questions
USD 5.84 billion in 2026, up 132.6% from USD 2.51 billion in 2025, according to DC Market Insights estimates. The market is projected to reach USD 11.46 billion by 2035, a CAGR of 16.39% from 2025.
16.39% a year from 2025 to 2035, after 110.69% a year from 2020 to 2025, because turbine capacity commissioned at data centers rises from 1,300 MW in 2025 to 4,700 MW in 2035 as campuses build their own power.
1,300 MW of gas turbines were commissioned at data centers in 2025 because grid connections for loads above 100 MW take years. Onsite turbines let an AI campus energise first and connect to the grid later.
48.0% of 2025 value, or USD 1.21 billion, goes to aeroderivative gas turbines, which start in about five minutes. Heavy-duty frame turbines grow fastest at 21.99% a year as campuses above 1 GW buy utility-class units.
About USD 1,900 per kW installed in 2025, 70% turbine package and 30% EPC (DC Market Insights estimate). EIA assumes USD 2,275 per kW for an aeroderivative turbine and USD 1,158 per kW for a frame unit in 2025 dollars.
15 to 27 GW of onsite natural gas may power data centres by 2030, mostly in the United States, according to the IEA. DC Market Insights places 21,730 MW of gas turbines at data centers by the end of 2030.
88.0% of 2025 value, or USD 2.21 billion, is spent in North America. Latin America grows fastest at 36.71% a year, and India is the fastest-growing large country at 36.71% a year.
About 36% of 2025 value is held by GE Vernova, which reported data center orders above USD 5 billion in the first half of 2026 (DC Market Insights assessment). Siemens Energy, Mitsubishi Power, Solar Turbines and Baker Hughes follow.
Since 15 January 2026, new US turbines fall under EPA subpart KKKKa NOx limits, and Executive Order 14318 speeds permits for projects above 100 MW. EU plants above 20 MW of thermal input join the EU Emissions Trading System.
USD 5.84 billion in 2026 is the DC Market Insights figure for turbines tied to one data center campus. Estimates that add utility plants for general load, reciprocating engines or fuel and electricity sales are larger.
Licences, delivery and payment
Which licence should I choose?
Single User is a view-only PDF for one person. Multi User adds a printable PDF and the Excel data for unlimited users at one location. Enterprise covers your whole company and includes 100 free analyst hours.
How and when will I receive the report?
By email, within 24–48 business hours of payment, in the formats of your licence.
How can I pay?
Securely through PayPal: with a PayPal account, a debit or credit card, or PayPal Pay Later where available. Prices are in US dollars.
Can I see a sample first?
Yes. Request a free sample and we will email it to you.
Can the report be tailored to my needs?
Yes. We can add countries, segments or data cuts. Talk to an analyst about the scope you need.
Can I get an invoice or pay against a purchase order?
Write to sales@dcmarketinsights.com and our team will help.