
Data Center Power Cable Market Size, Share & Forecast to 2035
Market at a glance
The Data Center Power Cable market was worth USD 1,740.0 million in 2025 and is forecast to reach USD 4,720.0 million by 2035, growing at a 25.06% CAGR.
 By Amit Jain, Senior Consultant, ICT & Emerging Technologies
 Reviewed by Deepti Agrawal
Last updated 21 Oct 2026
Base year 2025 PDF + Excel
What is inside the report
- 01Introduction
- 02Executive Summary
- 03Market Scope
- 04Why Market Estimates Differ
- 05Market Drivers
- 06Market Trends
- 07Market Challenges
- 08Market Opportunities
- 09Pricing Analysis
- 10Standards and Regulation
- 19chapters
- 2020-2024Historical period
- 2026-2035Forecast period
- —Companies profiled
Segmentation
Full analysis
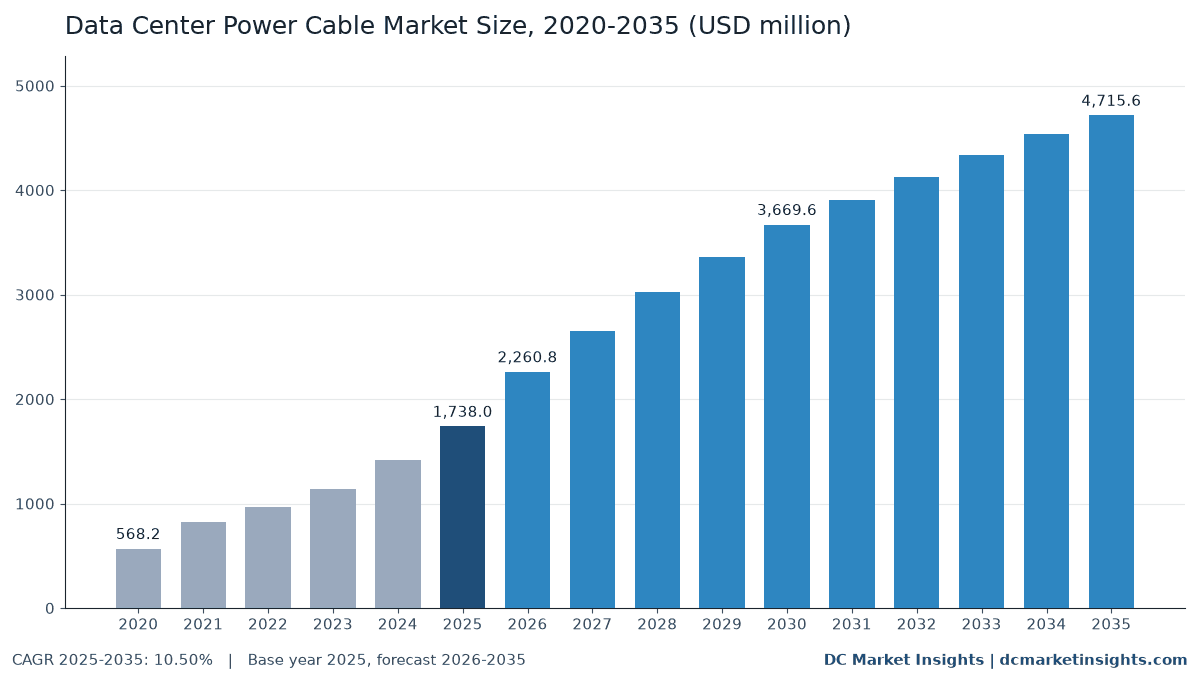
The Data Center Power Cable Market is valued at USD 2.26 billion in 2026 and is projected to reach USD 4.72 billion by 2035, up from USD 1.74 billion in 2025, a CAGR of 10.50% from 2025 to 2035 (DC Market Insights estimate). In this market the metal moves the money as much as the megawatts: the World Bank’s London Metal Exchange (LME) copper series averaged USD 9,947 per tonne in 2025 and USD 13,431 per tonne from January to September 2026, and copper makes up roughly half the price of a low voltage feeder cable. On top of that, the United States put a 50% duty on the copper content of semi-finished copper products from 1 August 2025, and Prysmian, the largest cable maker, credited growth in its North American construction cable business to data center expansion. DC Market Insights puts power cable content at about USD 115,000 per megawatt (MW) of new air-cooled IT capacity and USD 145,000 per MW in an artificial intelligence (AI) hall in 2025, which is why the 30.08% jump in 2026 is part price and part volume. Medium voltage feeder cables, which now carry 15 kilovolt (kV) to 35 kV power deep inside AI campuses, rise from USD 441.90 million to USD 1.21 billion, while DC power cables grow fastest at 11.55% a year and Asia Pacific is the fastest region at 12.46% a year.
Key Market Statistics: How Big Is the Data Center Power Cable Market in 2026?
DC Market Insights values the Data Center Power Cable Market at USD 2.26 billion in 2026, 30.08% above the USD 1.74 billion of 2025.
- Market size 2025: USD 1.74 billion; 2026: USD 2.26 billion; 2030: USD 3.67 billion; 2035: USD 4.72 billion.
- CAGR 2025-2035: 10.50% in the base case; the 2035 range runs from USD 3.75 billion (low, 8.00%) to USD 5.90 billion (high, 13.00%).
- Power cable content per new MW: about USD 115,000 air-cooled and USD 145,000 in an AI hall in 2025 (DC Market Insights estimate).
- Largest product type: low voltage power cables, USD 702.90 million or 40.4% of 2025 spend.
- Fastest product type: DC power cables, from USD 66.60 million in 2025 to USD 198.77 million in 2035, 11.55% a year.
- Copper conductors took USD 1,390.40 million (80.0%) in 2025; aluminium grows faster, 13.43% a year.
- Leading region: North America, USD 729.96 million (42.0%) in 2025; fastest region: Asia Pacific, 12.46% a year.
- Largest country: United States, USD 664.26 million in 2025; fastest large country: India, 16.75% a year.
- Market leaders: Prysmian (including Encore Wire), Nexans, Southwire, Sumitomo Electric and LS Cable & System hold about 38% of 2025 spend (DC Market Insights estimate).
How Fast Has Data Center Power Cable Spending Grown Since 2020?
The Global Data Center Power Cable Market size was valued at USD 568.20 million in 2020, reached USD 1.74 billion in 2025, and is anticipated to reach USD 4.72 billion by 2035, at a CAGR of 10.50% during the forecast period.
| Attribute | Details |
|---|---|
| Historical period | 2020-2024 |
| Base year | 2025 |
| Forecast period | 2026-2035 |
| Market size 2025 | USD 1.74 billion |
| Market size 2026 | USD 2.26 billion |
| CAGR 2025-2035 | 10.50% |
| Market size 2035 | USD 4.72 billion |
| CAGR 2020-2025 | 25.06% |
Spending rose 3.06 times between 2020 and 2025, 25.06% a year, for two reasons that compound: new data center IT capacity brought into service each year rose from about 5.0 gigawatts (GW) to 12.0 GW, and the LME copper price rose from USD 6,174 per tonne in 2020 to USD 9,947 in 2025, lifting cable content per MW from about USD 85,000 to USD 115,000. Growth slows to 10.50% a year after 2025 because DC Market Insights assumes copper settles back from its 2026 peak and yearly capacity additions flatten toward 27 GW, while the installed base of 116 GW rising to 311 GW keeps re-cabling spend climbing.
Which Cables Count as Data Center Power Cables?
This market counts USD 1.74 billion of 2025 end-user spend on cables that carry electric power from the site substation to the rack, plus their joints and terminations.
Included
- Medium voltage (MV) feeder cables, 5 kV to 35 kV, from the campus substation to unit substations, switchgear and generators.
- Low voltage (LV) power cables below 1 kV: transformer-to-switchboard feeders, uninterruptible power supply (UPS) and mechanical plant circuits, branch circuits and generator cables.
- Power whips and rack power cords between distribution units and IT racks.
- DC power cables for battery strings, 48 V rack bus links and 800 V direct current (DC) distribution.
- Cable accessories: terminations, splices, lugs and fire-rated glands.
Excluded
- Busway and busduct, counted in the Data Center Busway Market.
- Fibre and copper data cabling, and the trays and ladders that hold cables, counted in the Data Center Cable Management Market.
- High voltage transmission cables outside the site fence, owned by the utility.
- Installation labour, which electrical contractors bill separately.
How Do the Power Cable Segments Add Up?
Each 2025 dollar sits once in every dimension: new build (USD 1,506.00 million) plus retrofit and re-cabling (USD 232.00 million) adds to USD 1.74 billion, and the product type, conductor material and data center type splits add to the same total.
Why Do Data Center Power Cable Market Estimates Differ?
DC Market Insights puts the 2026 market at USD 2.26 billion for power cables and accessories bought for data centers; definitions that add data cabling or busway come out two to three times larger.
Three choices explain the gap. First, many estimates count every cable in the building, so fibre trunks, copper Ethernet and direct-attach links sit next to power feeders, although they are bought from different suppliers on different budgets. Second, busway replaces cable in many new white spaces, and some estimates fold it in as power distribution cabling. Third, value depends on the copper price: an estimate built at 2024 metal prices understates 2026 spend, because LME copper averaged USD 9,142 per tonne in 2024 and USD 13,431 per tonne in the first nine months of 2026. A narrower view that counts only MV cable misses that LV cables, whips and accessories take 70.7% of 2025 spend.
| Element | In this estimate | Why |
|---|---|---|
| MV feeder cables inside the site | Yes, USD 441.90 million (2025) | Bought by the data center developer |
| LV power cables | Yes, USD 702.90 million (2025) | Core of every electrical fit-out |
| Power whips and rack cords | Yes, USD 302.00 million (2025) | Last metres of power to the rack |
| Accessories and terminations | Yes, USD 224.60 million (2025) | Sold with the cable |
| Busway and busduct | No | Counted in the busway report |
| Fibre and copper data cabling | No | Different product and budget |
| Utility transmission cables | No | Paid by the grid operator |
So data cabling, busway, utility high voltage lines, cable trays and installation labour stay out of scope, even when the same distributor ships them to the same site. In scope are all data center buyers: hyperscale and AI campuses, colocation providers, enterprises and small edge and telecom sites that buy a few kilometres of LV cable and a box of rack cords.
What Is Driving Data Center Power Cable Demand?
Three forces lift spending from USD 1.74 billion in 2025 to USD 3.67 billion in 2030: a record copper price, MV distribution moving inside AI campuses, and a grid forecast that rewrites the load outlook.
LME Copper at USD 13,431 per Tonne in 2026 Re-Prices Every Kilometre
The United States Geological Survey (USGS) Mineral Commodity Summaries 2026 report a record Commodity Exchange (COMEX) copper average of USD 4.80 per pound in 2025, 14% above 2024, and add that copper joined the United States critical minerals list on 7 November 2025 (USGS Mineral Commodity Summaries 2026). The World Bank series then shows LME copper at USD 13,012 per tonne in January 2026 and USD 14,474 in September. Cable makers pass metal through within weeks, so DC Market Insights lifts air-hall content from USD 115,000 per MW in 2025 to USD 130,000 in 2026, about 13%, less than the 35% copper rise because contracts lag and some feeders switch to aluminium.
Medium Voltage Moves from the Substation Yard to the Data Hall
AI halls of 50 MW to 300 MW take 15 kV to 35 kV feeders to unit substations next to each hall instead of long LV runs, and liquid cooling plant adds MV-fed chillers and pumps. Prysmian announced on 19 June 2025 a USD 500 million expansion at its Encore Wire campus in Texas, including an MV cable plant of more than 650,000 square feet expected online in 2027. Southwire’s data center team said in an Infrastructure Masons member story in October 2025 that MV cable is the biggest constraint today. DC Market Insights adds about USD 30,000 per AI MW for these feeders, and MV cable grows from USD 441.90 million to USD 1,209.82 million.
NERC Sees 224 GW More Peak Demand, Mostly Data Centers
The North American Electric Reliability Corporation (NERC) 2025 Long-Term Reliability Assessment, published in January 2026, forecasts summer peak demand rising by over 224 GW in ten years, 69% above the previous year’s forecast, with new AI data centers accounting for most of the increase; the Midcontinent grid operator alone expects about 6 GW of data center load by 2027 and 14 GW by 2030. The United States Department of Energy (DOE) puts data center use at 176 terawatt-hours (TWh) in 2023, 4.4% of the nation’s electricity, rising to 6.7% to 12% by 2028 (DOE and Lawrence Berkeley National Laboratory). Every one of those megawatts needs about 8 tonnes of copper in power cable at 2025 content, a DC Market Insights figure.
How Are Data Center Power Cables Changing?
The clearest shift is in the conductor: aluminium grows 13.43% a year, from USD 347.60 million in 2025 to USD 1.23 billion in 2035, against 9.64% for copper.
Aluminium Feeders Gain as Copper Carries a 50% United States Duty
The presidential proclamation of 30 July 2025 placed a 50% duty on semi-finished copper products and copper-intensive derivatives from 1 August 2025, charged on the copper content (White House proclamation). The USGS notes that aluminium substitutes for copper in power cable, and large LV and MV feeders, where price matters more than diameter, are where developers switch first. DC Market Insights raises the aluminium share of spend from 20% in 2025 to 26% in 2035.
800 V DC and Superconducting Links Enter the Data Hall
Nexans opened its Stella Nova test centre in June 2025 with a superconducting LV AC and DC demonstration for data halls and states that superconducting cable systems carry up to 10 times more power than conventional cables. AI racks heading toward 800 V DC distribution need DC-rated cables between power racks, batteries and IT racks, which is why DC power cables grow 11.55% a year to USD 198.77 million.
Low Smoke Zero Halogen Becomes the Default in Europe
The European Union Construction Products Regulation (CPR) 2024/3110 applies from 8 January 2026, and cables keep their reaction-to-fire classes under the EN 50575 harmonised standard. Colocation buyers in Frankfurt, Amsterdam and Dublin specify low smoke zero halogen (LSZH) sheaths in higher fire classes for data halls, adding about 8% to LV cable cost per MW in Europe (DC Market Insights estimate).
What Holds Back Data Center Power Cable Spending?
Two limits hold growth near 10.50% a year after 2025: busway taking over the white space, and metal-price swings that delay orders.
Busway Replaces Whips and Branch Circuits in New White Space
The Data Center Busway Market reached USD 1.44 billion in 2025 by DC Market Insights estimates, with overhead busway in about 48% of new white space. Each MW served by track busway needs fewer power whips and branch circuits, so DC Market Insights holds whip and rack cord content flat per MW and lets the line grow 10.45% a year, at the pace of capacity rather than copper.
Copper Swings Push Contractors to Delay or Re-Bid
Copper rose from USD 11,785 per tonne in December 2025 to USD 14,474 in September 2026 in the World Bank series, a 23% move in nine months. Electrical contractors on fixed-price packages re-bid or defer cable orders when metal jumps, and the DC Market Insights low case of USD 3.75 billion in 2035 assumes copper falls back below USD 9,000 per tonne and AI-hall additions slip.
Where Is the New Power Cable Revenue to 2035?
Two pools add the most: MV feeders (USD 441.90 million to USD 1.21 billion) and re-cabling of older halls (USD 232.00 million to USD 715.30 million).
MV Feeders for AI Campuses: USD 441.90 million to USD 1.21 billion
Each 100 MW AI campus carries about USD 4.8 million of MV cable at 2025 content, a DC Market Insights figure, and the AI share of new capacity rises from 35% to 66%. Nexans reported PWR-Connect standard sales of EUR 2,341 million in 2025, up 13.5%, and linked its exceptional fourth-quarter growth to large infrastructure and data center projects (Nexans full-year 2025 results).
Re-Cabling the 116 GW Installed Base: USD 232.00 million to USD 715.30 million
Halls built before 2015 were cabled for 5 kilowatt (kW) to 10 kW racks; retrofits to 30 kW and more replace feeders, whips and terminations. At about USD 2,000 per installed MW a year in 2025, rising to USD 2,300 by 2035, re-cabling grows 11.92% a year, faster than new build at 10.26%.
What Does Data Center Power Cable Cost per Megawatt?
Power cable content averaged about USD 115,000 per new MW of air-cooled IT capacity and USD 145,000 per MW in an AI hall in 2025 (DC Market Insights estimates).
| Cost line (DC Market Insights estimate) | 2020 | 2025 | 2030 | 2035 |
|---|---|---|---|---|
| Air-cooled hall content (USD per new MW) | 85,000 | 115,000 | 129,000 | 131,000 |
| AI hall content (USD per new MW) | 105,000 | 145,000 | 157,000 | 157,000 |
| Re-cabling of installed base (USD per MW per year) | 1,800 | 2,000 | 2,200 | 2,300 |
| LME copper, annual average (USD per tonne) | 6,174 | 9,947 | 11,500 (planning) | 11,500 (planning) |
The 2020 and 2025 copper values are World Bank annual averages; the 2030 and 2035 values are the DC Market Insights planning price. Content per MW follows copper with a lag: about 55% of an AI hall’s cable bill is copper metal at 2025 prices, so each USD 1,000 per tonne on copper adds about USD 8,000 per MW. The USGS reports the 2025 LME cash average at USD 4.40 per pound, close to the World Bank series.
Which Standards and Rules Apply to Data Center Power Cables?
Six standards and rules shape most of the USD 1.74 billion spent in 2025: three product standards and codes, one EU regulation and two United States trade and mineral measures.
- IEC 60502-2 of the International Electrotechnical Commission (IEC): extruded-insulation power cables from 6 kV up to 30 kV, amended in 2024; the reference for MV feeders outside North America.
- UL 44 of UL Solutions: thermoset-insulated wires and cables, harmonised with the Canadian CSA C22.2 No. 38 and revised in May 2021.
- NFPA 70, the National Electrical Code (NEC), 2026 edition published in September 2025: wiring methods for data center and IT equipment rooms in the United States.
- EU Construction Products Regulation 2024/3110, applying from 8 January 2026, with EN 50575 reaction-to-fire classes for cables in buildings.
- United States copper proclamation of 30 July 2025: a 50% duty on the copper content of semi-finished copper products from 1 August 2025.
- United States Final 2025 List of Critical Minerals, 7 November 2025, which adds copper.
Together the duty and the critical-mineral listing favour cable made in North America, which is where Prysmian, Southwire and Nexans are adding capacity.
Which Data Center Power Cable Segment Is Largest?
Low voltage power cables are the largest segment, USD 702.90 million or 40.4% of 2025 spend, while DC power cables grow fastest at 11.55% a year.
By Product Type
| Product Type | 2025 (USD million) | Share 2025 | 2035 (USD million) | CAGR 2025-2035 |
|---|---|---|---|---|
| Medium Voltage Feeder Cables | USD 441.90 million | 25.4% | USD 1,209.82 million | 10.60% |
| Low Voltage Power Cables | USD 702.90 million | 40.4% | USD 1,876.92 million | 10.32% |
| Power Whips and Rack Power Cords | USD 302.00 million | 17.4% | USD 816.28 million | 10.45% |
| DC Power Cables | USD 66.60 million | 3.8% | USD 198.77 million | 11.55% |
| Cable Accessories and Terminations | USD 224.60 million | 12.9% | USD 613.83 million | 10.58% |
MV feeder cables hold 25.4% of 2025 spend and 25.7% of 2035 spend as AI halls take MV closer to the load. Accessories and terminations follow cable volume at about 12% of new-build value.
By Conductor Material
| Conductor Material | 2025 (USD million) | Share 2025 | 2035 (USD million) | CAGR 2025-2035 |
|---|---|---|---|---|
| Copper | USD 1,390.40 million | 80.0% | USD 3,489.56 million | 9.64% |
| Aluminium | USD 347.60 million | 20.0% | USD 1,226.06 million | 13.43% |
Copper keeps 74.0% of 2035 spend because whips, rack cords and short LV circuits stay copper, but aluminium feeders win the long MV and large LV runs.
By Project Type
| Project Type | 2025 (USD million) | Share 2025 | 2035 (USD million) | CAGR 2025-2035 |
|---|---|---|---|---|
| New Build | USD 1,506.00 million | 86.7% | USD 4,000.32 million | 10.26% |
| Retrofit and Re-cabling | USD 232.00 million | 13.3% | USD 715.30 million | 11.92% |
New build takes 86.7% of 2025 spend; re-cabling grows faster, 11.92% a year, as rack densities in older halls rise.
By Data Center Type
| Data Center Type | 2025 (USD million) | Share 2025 | 2035 (USD million) | CAGR 2025-2035 |
|---|---|---|---|---|
| Hyperscale and AI Campuses | USD 729.96 million | 42.0% | USD 2,452.12 million | 12.88% |
| Colocation | USD 538.78 million | 31.0% | USD 1,414.69 million | 10.13% |
| Enterprise | USD 347.60 million | 20.0% | USD 613.03 million | 5.84% |
| Edge and Telecom | USD 121.66 million | 7.0% | USD 235.78 million | 6.84% |
Hyperscale and AI campuses grow 12.88% a year to 52.0% of 2035 spend; enterprise sites grow only 5.84% a year as enterprise IT moves to colocation and cloud.
DC Exclusive: Copper Price Ladder, the Cable Bill of a 100 MW AI Hall from USD 6,000 to USD 15,000 per Tonne
The power cable bill of a 100 MW AI hall swings from USD 11.34 million to USD 18.55 million between copper at USD 6,000 and USD 15,000 per tonne, according to this DC Market Insights price ladder built from 6 inputs.
| LME copper (USD per tonne) | Reference point | Cable content (USD per MW) | 100 MW AI hall (USD million) |
|---|---|---|---|
| 6,000 | Close to the 2020 average of 6,174 | 113,355 | 11.34 |
| 8,000 | Low-case planning price | 129,390 | 12.94 |
| 9,947 | 2025 average | 145,000 | 14.50 |
| 12,000 | Near the December 2025 level of 11,785 | 161,460 | 16.15 |
| 13,431 | January-September 2026 average | 172,933 | 17.29 |
| 15,000 | Above the September 2026 level of 14,474 | 185,512 | 18.55 |
The ladder holds the hall design fixed: USD 145,000 per MW at 2025 copper, of which 55% is copper metal, about 8.0 tonnes per MW, and 45% is insulation, sheath, manufacturing and distribution. For comparison, the Copper Development Association cites about 27 tonnes of copper per MW for a whole United States data center, so power cable holds roughly 30% of the building’s copper, with busway, transformers, grounding and IT equipment holding the rest. Two lessons follow. A developer that bought at the 2025 average saves about USD 2.8 million per 100 MW against the 2026 average, and an aluminium MV and feeder design, which DC Market Insights puts at about 20% of the cable bill, removes about a fifth of that copper exposure.
Which Region Buys the Most Data Center Power Cable?
North America buys the most, USD 729.96 million or 42.0% of 2025 spend, while Asia Pacific grows fastest at 12.46% a year to USD 1.46 billion in 2035.
| Region | 2025 (USD million) | Share 2025 | 2035 (USD million) | CAGR 2025-2035 |
|---|---|---|---|---|
| North America | USD 729.96 million | 42.0% | USD 1,815.52 million | 9.54% |
| Europe | USD 382.36 million | 22.0% | USD 943.12 million | 9.45% |
| Asia Pacific | USD 451.88 million | 26.0% | USD 1,461.84 million | 12.46% |
| Latin America | USD 69.52 million | 4.0% | USD 188.62 million | 10.50% |
| Middle East and Africa | USD 104.28 million | 6.0% | USD 306.52 million | 11.38% |
North America
North America took USD 729.96 million in 2025. Hubbell reported 9% organic growth in the fourth quarter of 2025 driven by datacenter projects, and Southwire announced in August 2026 a more than USD 256 million wire and cable expansion in Starkville, Mississippi, naming data centers as a driver.
Europe
Europe spent USD 382.36 million in 2025. The European Commission cites 70 TWh of data center use in 2024 heading to about 115 TWh by 2030, and its Energy Efficiency Directive asks sites of 500 kW of IT power and above to report energy data every year.
Asia Pacific
Asia Pacific grows from USD 451.88 million to USD 1.46 billion, 12.46% a year. The Malaysian Investment Development Authority (MIDA) reported RM152.9 billion of approved information and communication investment in 2025, led by data centres, and India’s installed data center capacity reached 1.57 GW in August 2026 according to the Press Information Bureau.
Latin America
Latin America spent USD 69.52 million in 2025, growing 10.50% a year, mostly in Brazil, Mexico and Chile, where most data center cable is still copper LV bought through distributors.
Middle East and Africa
The Middle East and Africa grows 11.38% a year to USD 306.52 million, led by Saudi Arabia at 13.81% a year, where stc and HUMAIN formed a joint venture for data centers supporting up to 1 GW of AI workloads, and by the 1 GW Stargate UAE cluster whose first 200 MW is planned for 2026.
Which Countries Spend the Most on Data Center Power Cable?
The United States spends the most, USD 664.26 million in 2025, and India is the fastest large country at 16.75% a year.
| Rank | Country | Region | 2025 (USD million) | 2035 (USD million) | CAGR 2025-2035 |
|---|---|---|---|---|---|
| 1 | United States | North America | USD 664.26 million | USD 1,633.97 million | 9.42% |
| 2 | China | Asia Pacific | USD 171.71 million | USD 482.41 million | 10.88% |
| 3 | Germany | Europe | USD 72.65 million | USD 179.19 million | 9.45% |
| 4 | United Kingdom | Europe | USD 68.82 million | USD 160.33 million | 8.83% |
| 5 | Japan | Asia Pacific | USD 67.78 million | USD 190.04 million | 10.86% |
| 6 | Canada | North America | USD 65.70 million | USD 181.55 million | 10.70% |
| 7 | India | Asia Pacific | USD 49.71 million | USD 233.89 million | 16.75% |
| 8 | Australia | Asia Pacific | USD 45.19 million | USD 146.18 million | 12.46% |
| 9 | Ireland | Europe | USD 40.15 million | USD 89.60 million | 8.36% |
| 10 | France | Europe | USD 38.24 million | USD 94.31 million | 9.45% |
| 11 | Netherlands | Europe | USD 36.32 million | USD 80.17 million | 8.24% |
| 12 | Saudi Arabia | Middle East and Africa | USD 26.07 million | USD 95.02 million | 13.81% |
Virginia, Texas and Ohio account for most of the United States figure, and the copper duty makes it the highest-priced cable market per MW. India’s USD 49.71 million grows to USD 233.89 million as capacity heads toward about 8 GW by 2030, served by domestic makers such as KEI Industries and Polycab.
What Could the Data Center Power Cable Market Reach by 2035?
The 2035 value ranges from USD 3.75 billion to USD 5.90 billion, with a base case of USD 4.72 billion (DC Market Insights scenarios).
| Scenario | 2035 (USD million) | CAGR 2025-2035 | Assumption |
|---|---|---|---|
| Low | USD 3,752.21 million | 8.00% | Copper back below USD 9,000 per tonne, more busway and aluminium, slower AI additions |
| Base | USD 4,715.62 million | 10.50% | 27 GW of new capacity in 2035, 66% AI, copper near USD 11,500 per tonne |
| High | USD 5,899.76 million | 13.00% | Copper stays above USD 13,000 per tonne and MV distribution reaches every AI hall |
Who Are the Leading Data Center Power Cable Makers?
Prysmian (including Encore Wire), Nexans, Southwire, Sumitomo Electric and LS Cable & System hold about 38% of 2025 spend, a DC Market Insights estimate based on data center exposure, North American capacity and stated segment growth.
- Prysmian (including Encore Wire)
- Nexans
- Southwire
- Sumitomo Electric
- LS Cable & System
- Furukawa Electric
- NKT
- KEI Industries
- Polycab
- Hengtong Group
- Elsewedy Electric
- Riyadh Cables
- Ducab
- Cerro Wire
Prysmian reported 2025 revenue of EUR 19,650 million, up 5.4% organic, with Encore Wire in its first full year, and headlined its fourth-quarter construction business as driven by data center expansion in North America (Prysmian full-year 2025 results); in April 2026 it called itself a one-stop shop for data centers and reported 10% growth in North America mainly driven by data centers. Nexans reported 2025 standard sales of EUR 6.1 billion, up 8.3% organic. Sumitomo Electric reported net sales of JPY 5,110 billion for the year to March 2026 and named data center demand and power cables among its growth lines. KEI Industries reported revenue of INR 117,478 million in its 2026 financial year and lists telecom and data centers among the sectors it serves, with 60,732 kilometres of cable capacity at its Sanand plant. NKT reported 2025 revenue of EUR 2,722 million at standard metal prices.
What Changed in Data Center Power Cable Since Mid-2025?
Six dated moves since June 2025 show makers adding MV and North American capacity for data centers.
- In June 2025, Prysmian announced a USD 500 million Encore Wire expansion in Texas, including an MV cable plant online in 2027 (Source: Prysmian).
- In June 2025, Nexans opened Stella Nova with a superconducting AC and DC demonstration for data halls (Source: Nexans).
- In July 2025, the United States set a 50% duty on the copper content of semi-finished copper products from 1 August 2025 (Source: White House).
- In February 2026, Nexans reported PWR-Connect sales up 13.5% and linked fourth-quarter growth to data center projects (Source: Nexans).
- In April 2026, Prysmian reported 10% growth in North America mainly driven by data centers (Source: Prysmian).
- In October 2026, Southwire broke ground on its more than USD 256 million Starkville, Mississippi expansion (Source: Southwire).
Analyst Takeaways: What Should Data Center Buyers Plan For?
Plan about USD 145,000 per MW of power cable for an AI hall at 2025 copper, and hedge the metal, because copper moves the bill more than design does.
- USD 8,000 per MW: each USD 1,000 per tonne on copper adds this much to an AI hall’s cable bill.
- USD 2.8 million per 100 MW: the gap between 2025 and 2026 average copper on one AI hall.
- USD 1,209.82 million by 2035: MV feeders become the second-largest line, so secure MV cable slots early.
- 26.0% aluminium by 2035: aluminium feeders cut copper exposure and the United States copper duty.
Methodology: How Did DC Market Insights Size the Data Center Power Cable Market?
DC Market Insights built the Data Center Power Cable Market bottom-up from new and installed data center capacity and the copper price, giving USD 1.74 billion for 2025 from 10 model inputs.
New-build spend equals new IT capacity (12.0 GW in 2025, 22.0 GW in 2030, 27.0 GW in 2035) times USD 115,000 per MW of air-hall content, plus the AI share (35%, 60%, 66%) times an AI premium of USD 30,000 per MW in 2025: USD 1,506.00 million. Installed-base spend equals installed IT capacity (116 GW in 2025, 311 GW in 2035) times USD 2,000 per MW a year for re-cabling, moves and whip refresh: USD 232.00 million. Content per MW follows the World Bank LME copper average with a lag. Segment, region and country shares are applied to the components and the total, and every split sums to it.
Three bound checks hold. Ceiling one: if all 27 tonnes of copper per MW that the Copper Development Association cites for a data center went into power cable at twice the metal price, 12.0 GW in 2025 would need about USD 6.4 billion of cable, far above the USD 1.74 billion base. Ceiling two: the market equals about 8% of Prysmian’s 2025 revenue of EUR 19,650 million alone, and Prysmian is one of more than a dozen makers that sell to data centers. Floor: a minimum fit of USD 60,000 per new MW plus USD 1,000 per installed MW a year gives about USD 836 million, below the base. MV switchgear stays in the Data Center Switchgear Market, and filters and surge protection in the Data Center Power Quality Market. The full method is described on the DC Market Insights research methodology page.
Table of contents
- 01Introduction
- 1.1Report Description
- 1.2Key Market Statistics, 2025, 2026, 2030 and 2035
- 02Executive Summary
- 2.1Market Snapshot, 2025, 2026 and 2035
- 2.2Market Size Chart, 2020-2035
- 03Market Scope
- 3.1Included
- 3.2Excluded
- 3.3How Do the Power Cable Segments Add Up?
- 04Why Market Estimates Differ
- 4.1Scope Table: In and Out of This Estimate
- 05Market Drivers
- 5.1LME Copper at USD 13,431 per Tonne in 2026 Re-Prices Every Kilometre
- 5.2Medium Voltage Moves from the Substation Yard to the Data Hall
- 5.3NERC Sees 224 GW More Peak Demand, Mostly Data Centers
- 06Market Trends
- 6.1Aluminium Feeders Gain as Copper Carries a 50% United States Duty
- 6.2800 V DC and Superconducting Links Enter the Data Hall
- 6.3Low Smoke Zero Halogen Becomes the Default in Europe
- 07Market Challenges
- 7.1Busway Replaces Whips and Branch Circuits in New White Space
- 7.2Copper Swings Push Contractors to Delay or Re-Bid
- 08Market Opportunities
- 8.1MV Feeders for AI Campuses: USD 441.90 million to USD 1.21 billion
- 8.2Re-Cabling the 116 GW Installed Base: USD 232.00 million to USD 715.30 million
- 09Pricing Analysis
- 9.1Power Cable Content per MW, 2020-2035
- 9.2LME Copper Price Anchors
- 10Standards and Regulation
- 10.1IEC 60502-2
- 10.2UL 44
- 10.3NFPA 70 National Electrical Code 2026
- 10.4EU Construction Products Regulation 2024/3110 and EN 50575
- 10.5United States Copper Proclamation, July 2025
- 10.6United States Critical Minerals List, November 2025
- 11Market Segmentation
- 11.1By Product Type
- 11.2Medium Voltage Feeder Cables
- 11.3Low Voltage Power Cables
- 11.4Power Whips and Rack Power Cords
- 11.5DC Power Cables
- 11.6Cable Accessories and Terminations
- 11.7By Conductor Material
- 11.8Copper
- 11.9Aluminium
- 11.10By Project Type
- 11.11New Build
- 11.12Retrofit and Re-cabling
- 11.13By Data Center Type
- 11.14Hyperscale and AI Campuses
- 11.15Colocation
- 11.16Enterprise
- 11.17Edge and Telecom
- 12DC Exclusive: Copper Price Ladder for a 100 MW AI Hall
- 12.1Six Copper Price Steps, USD 6,000 to USD 15,000 per Tonne
- 12.2Copper Content: 8.0 Tonnes per MW in Power Cable
- 13Regional Insights
- 13.1North America
- 13.2Europe
- 13.3Asia Pacific
- 13.4Latin America
- 13.5Middle East and Africa
- 14Country Analysis
- 14.1United States
- 14.2China
- 14.3Germany
- 14.4United Kingdom
- 14.5Japan
- 14.6Canada
- 14.7India
- 14.8Australia
- 14.9Ireland
- 14.10France
- 14.11Netherlands
- 14.12Saudi Arabia
- 15Forecast Scenarios, 2035
- 15.1Low Scenario
- 15.2Base Scenario
- 15.3High Scenario
- 16Competitive Insights
- 16.1Prysmian (including Encore Wire)
- 16.2Nexans
- 16.3Southwire
- 16.4Sumitomo Electric
- 16.5LS Cable & System
- 16.6Furukawa Electric
- 16.7NKT
- 16.8KEI Industries
- 16.9Polycab
- 16.10Hengtong Group
- 16.11Elsewedy Electric
- 16.12Riyadh Cables
- 16.13Ducab
- 16.14Cerro Wire
- 17Recent Developments
- 17.1Prysmian Encore Wire Expansion, June 2025
- 17.2Nexans Stella Nova, June 2025
- 17.3United States Copper Duty, July 2025
- 17.4Nexans Full-Year Results, February 2026
- 17.5Prysmian First-Quarter Update, April 2026
- 17.6Southwire Starkville Groundbreaking, October 2026
- 18Analyst Takeaways
- 18.1Copper Sensitivity per MW
- 18.22025 versus 2026 Copper Gap
- 18.3MV Feeders to 2035
- 18.4Aluminium Share by 2035
- 19Research Methodology
- 19.1Model Inputs
- 19.2Bound Checks
- Fig. 1Data Center Power Cable Market Size, 2020-2035 (USD million)
- Table 1Market Snapshot, 2025, 2026 and 2035
- Table 2Scope Table: In and Out of This Estimate
- Table 3Power Cable Content per MW, 2020-2035
- Table 4Market by Product Type, 2025 and 2035
- Table 5Market by Conductor Material, 2025 and 2035
- Table 6Market by Project Type, 2025 and 2035
- Table 7Market by Data Center Type, 2025 and 2035
- Table 8Copper Price Ladder: Cable Bill of a 100 MW AI Hall
- Table 9Market by Region, 2025 and 2035
- Table 10Top 12 Countries, 2025 and 2035
- Table 112035 Forecast Scenarios
About this report
Written by Amit Jain and reviewed by Deepti Agrawal, Senior Editor, Research. Figures are built top-down and bottom-up and reconciled before publication, with 2025 as the base year.
Read our methodologyHow we built this
- Historical period2020-2024
- Base year2025
- Forecast period2026-2035
- Sizing approachTop-down + bottom-up
Need more than the report?
Advisory on this market
Due diligence, site selection and market entry work, by the analysts who wrote this report.
See consulting servicesFrequently asked questions
USD 2.26 billion in 2026, up 30.08% from USD 1.74 billion in 2025, according to DC Market Insights estimates. The market is projected to reach USD 4.72 billion by 2035, a CAGR of 10.50% from 2025.
10.50% a year from 2025 to 2035, after 25.06% a year from 2020 to 2025, because new IT capacity rises from 12.0 GW to 27.0 GW a year and LME copper rose from USD 6,174 per tonne in 2020 to USD 9,947 in 2025.
About USD 115,000 per new MW of air-cooled IT capacity and USD 145,000 per MW in an AI hall in 2025 (DC Market Insights estimates), roughly 8 tonnes of copper per MW, plus about USD 2,000 per installed MW a year for re-cabling.
Each USD 1,000 per tonne on copper adds about USD 8,000 per MW to an AI hall’s cable bill. A 100 MW AI hall costs USD 14.50 million in cable at the 2025 copper average and USD 17.29 million at the 2026 average (DC Market Insights).
Low voltage power cables, with USD 702.90 million or 40.4% of 2025 spend. Medium voltage feeder cables follow with USD 441.90 million and reach USD 1,209.82 million by 2035.
About USD 30,000 more cable per MW than an air-cooled hall in 2025, because AI halls of 50 MW to 300 MW take 15 kV to 35 kV feeders to unit substations beside each hall. Prysmian is building an MV cable plant in Texas due online in 2027.
The 50% duty from 1 August 2025 applies to the copper content of semi-finished copper products and copper-intensive derivatives, per the 30 July 2025 proclamation. It raises the cost of imported copper cable and favours aluminium feeders and North American plants.
North America, with USD 729.96 million or 42.0% of 2025 spend. Asia Pacific grows fastest at 12.46% a year, and India is the fastest large country at 16.75% a year.
Prysmian (including Encore Wire), Nexans, Southwire, Sumitomo Electric and LS Cable & System hold about 38% of 2025 spend (DC Market Insights estimate). Prysmian reported 2025 revenue of EUR 19,650 million and credits data centers for North American growth.
USD 2.26 billion in 2026 is the DC Market Insights figure for power cables and accessories only. Estimates that add fibre and copper data cabling, busway or installation labour come out two to three times larger, and older estimates use lower copper prices.
Licences, delivery and payment
Which licence should I choose?
Single User is a view-only PDF for one person. Multi User adds a printable PDF and the Excel data for unlimited users at one location. Enterprise covers your whole company and includes 100 free analyst hours.
How and when will I receive the report?
By email, within 24–48 business hours of payment, in the formats of your licence.
How can I pay?
Securely through PayPal: with a PayPal account, a debit or credit card, or PayPal Pay Later where available. Prices are in US dollars.
Can I see a sample first?
Yes. Request a free sample and we will email it to you.
Can the report be tailored to my needs?
Yes. We can add countries, segments or data cuts. Talk to an analyst about the scope you need.
Can I get an invoice or pay against a purchase order?
Write to sales@dcmarketinsights.com and our team will help.